7 Big Data Application Examples for Web Data Projects
Explore seven web data project ideas, from analytics and search to sensor dashboards, and learn how to turn each question into useful data and action.

Big data application examples span website analytics, search, recommendations, financial analysis, government services, research discovery, and sensor dashboards. For a web data project, start with a question and the decision it should inform; then choose the data and tools that fit its volume, variety, speed, privacy needs, and cost. A small project may need only a database and a simple report. “Big data” is useful framing when data volume, variety, or arrival speed makes collection and analysis more demanding, not a reason to add infrastructure by default.
NIST’s big data framework describes networked, digitized, sensor-laden, information-driven environments and catalogs use cases across sectors. Its catalog offers useful project inspiration, but a listed use case does not prove a current system’s architecture, algorithm, performance, or privacy properties. NIST’s use-case collection is best read as a set of application areas, not a ranking of technologies.
How to turn an application example into a project
- Write the question. Name what you want to learn, such as which help pages assist visitors in completing a task.
- Choose the action. Say what decision might change if you learn the answer: revise navigation, improve search, or investigate an unexpected pattern.
- Pick the minimum useful measures. Select fields that answer the question. More data is not automatically more useful.
- Check scope and governance. Consider whether data can identify people, how long it should be retained, who can access it, and what consent or policy requirements apply.
- Choose an implementation that fits. Consider data volume and arrival speed, structured and unstructured inputs, batch or streaming analysis, integrations, operational effort, and cost.
- Validate before acting. Check missing values, instrumentation changes, bot traffic, time zones, and whether the measure actually reflects the task.
These are practical selection criteria, not a universal platform recommendation. NIST and Digital.gov describe application contexts; neither source establishes one best technology for every project.

1. Website and app behavior analytics
Project question: Which content or interaction helps visitors complete a specific task? Web analytics collects, analyzes, and reports website metrics and data. Digital.gov notes that analysis can inform design and development decisions. Start with the site’s goal, then select measures that reflect progress toward it.
Useful data: page views, acquisition source, device class, task starts and completions, and engagement measures. For a help center, you might compare which article paths precede successful task completion. Define the event and the time window clearly, and avoid treating more page views as inherently better.
Action: identify a confusing route, improve the content or navigation, then review the same measure after the change. Keep a record of instrumentation changes so a tracking update is not mistaken for a change in visitor behavior.
Scale thoughtfully: a low traffic site can often answer this with a modest analytics setup and periodic reporting. Higher event volume or many event types may call for a more scalable collection and analysis pipeline, but the project question should still determine what is collected.
2. Web search and information retrieval
Project question: Can users find the right item from a query? NIST’s catalog explicitly includes “Web Search” as a commercial use case. For a project, explore how a collection is indexed, what people search for, and whether results match the intended information need. These are project directions, not claims about the implementation behind NIST’s listed case.
Useful data: query terms, result impressions, selected results, no-result searches, and task feedback. If query text may contain personal or sensitive information, define access, retention, and redaction rules before collecting it.
Action: investigate repeated no-result queries, tune synonyms or metadata, and review a sample of results for relevance. A click alone is an imperfect quality signal: users may click a result and still fail to find an answer.
Scale thoughtfully: distinguish indexing needs from analytics needs. A project that only reviews a small set of searches may need a simple export; frequent updates to a large collection can create different indexing and freshness requirements.
3. Recommendations and personalization
Project question: Can item and interaction data help surface useful next choices? NIST’s catalog lists Netflix Movie Service as a use case, which supports recommendations as an application area. The catalog entry does not establish Netflix’s current production methods.
Useful data: item attributes and interactions such as views, saves, or explicit ratings, selected according to the product’s purpose. A prototype might compare simple popularity-based suggestions with suggestions based on shared item attributes. Treat this as a project design, not a description of any named service.
Action: evaluate whether recommendations help users discover relevant items. Decide in advance how to assess relevance and coverage, and consider whether the system repeatedly exposes only already-popular items.
Scale thoughtfully: a small catalog may be handled with straightforward rules. More data or faster updates may justify a more involved analysis workflow. Personalization also raises privacy and user-control questions, so do not collect interaction histories without a clear purpose and governance plan.
4. Transaction and financial analysis
Project question: What patterns in transactions or financial records merit investigation? NIST’s use-case catalog includes financial industries such as banking, securities and investments, and insurance. A learning project could examine transaction patterns or potential risk signals. Fraud detection is a plausible theme, but the catalog entry alone does not show that a particular system was deployed or achieved a measured result.
Useful data: appropriately authorized transaction records, timestamps, categories, and outcomes relevant to the question. Use synthetic or properly de-identified data for demonstrations where possible. A pattern is a signal for review, not proof of misconduct.
Action: summarize activity by time or category, inspect unusual changes, and document how a finding would be reviewed. If a model or rule flags records, assess false positives and false negatives before anyone relies on it.
Scale thoughtfully: access controls, auditability, data quality, and retention may matter as much as processing volume. Choose an approach based on the analysis and governance requirements, rather than assuming a large-data platform makes financial conclusions trustworthy.
5. Government service and website measurement
Project question: How do people find, access, and use public services online? Digital.gov describes the federal Digital Analytics Program (DAP) as helping agencies understand use of government services. It says DAP uses Google Analytics 360 to measure traffic and engagement across thousands of federal government websites and apps.
The analytics.usa.gov about page describes a public dashboard drawing on a unified DAP account. It says the dashboard covers more than 500 federal second-level domains and approximately 7,000 hostnames, does not track individuals, and anonymizes visitor IP addresses. These figures describe program coverage, not every federal site or all government websites.
Useful data and action: teams might examine aggregate traffic and engagement to identify service pages that need clearer content or navigation. Follow the applicable privacy and accessibility requirements, define measures around user tasks, and avoid treating the federal program as a universal template for every organization.
6. Research networks and discovery
Project question: How do people discover and connect research outputs? NIST’s catalog lists Mendeley and describes it as an international research network. This can illustrate networked research and information discovery. A historical catalog listing does not establish current product features or business status.
Useful data: for a classroom or prototype, use a permitted research corpus, publication metadata, and relationships such as shared topics or citations if the dataset supports them. Explore how a reader might move from one relevant item to another.
Action: test whether search, filters, or related-item links help a user find material for a defined research task. Be explicit about what your data represents; metadata coverage and indexing choices shape what discovery can show.
7. Sensor and streaming data in web applications
Project question: Can a web dashboard make a changing physical system easier to understand? NIST characterizes the big data landscape as networked, digitized, and sensor-laden. A project could collect a sensor or event stream and display trends in a web application. This is a project pattern, not a named deployment established by the cited sources.
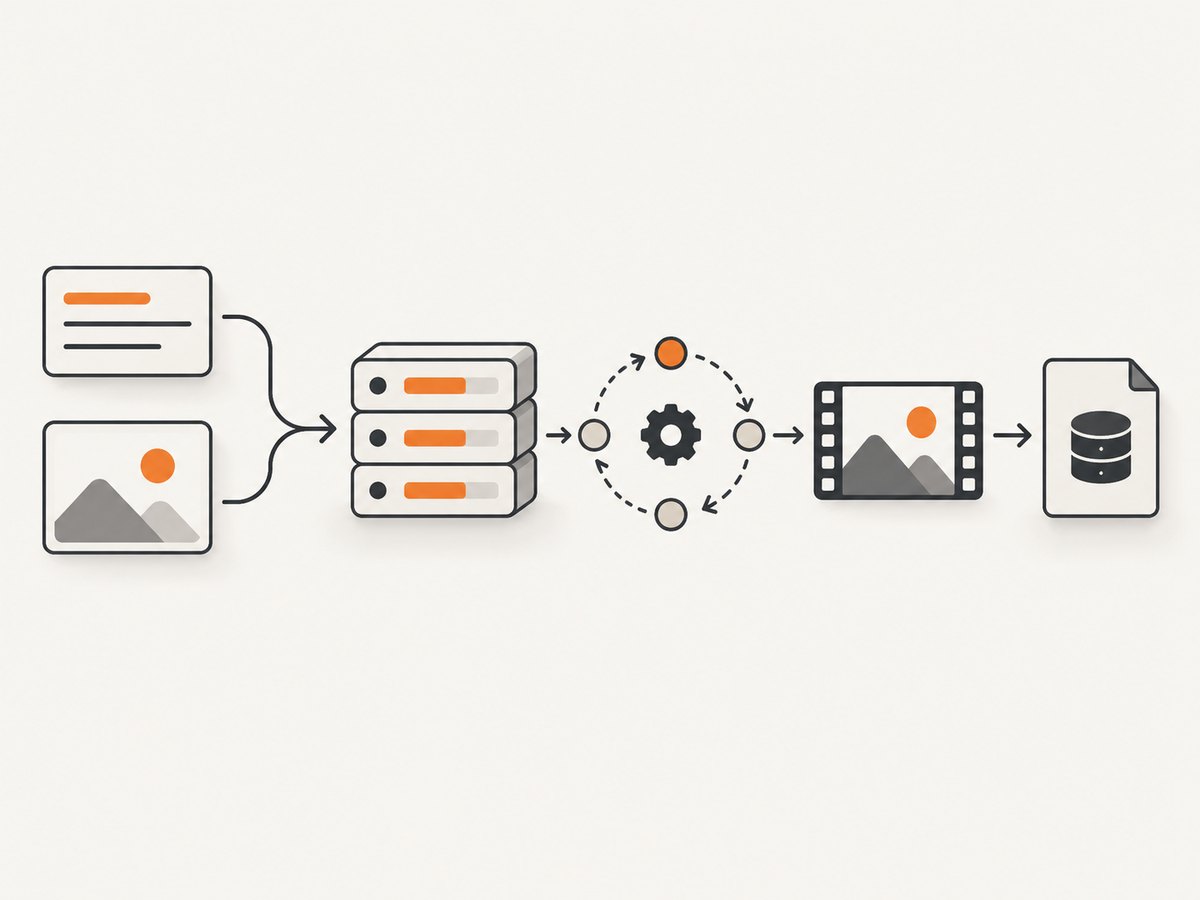
Useful data: timestamped readings, sensor identifiers, units, and status or quality indicators. Preserve units and time-zone conventions, handle gaps and duplicate events, and distinguish a missing reading from a measured zero.
Action: show a recent trend, flag stale data, and give users enough context to interpret changes. Decide how quickly the dashboard must update. A daily summary can be simpler and cheaper to operate than a continuously refreshed view when real-time decisions are unnecessary.
Compare project needs before choosing tools
| Question | Why it matters |
|---|---|
| How much data arrives, and how quickly? | Separates a periodic report from a high-volume or time-sensitive pipeline. |
| What kinds of data are involved? | Structured events, text, media, and sensor readings can need different handling. |
| Is batch or streaming analysis needed? | Match update frequency to the decision; continuous processing is not always useful. |
| What decision will analysis support? | Defines measures and helps avoid collecting data without purpose. |
| What privacy and governance rules apply? | Shapes collection, retention, access, and sharing. |
| What integrations and operating costs are acceptable? | Includes implementation and ongoing maintenance, not only initial setup. |
For a web data project that needs page images as examples or visual records, ScreenshotNeo is a website screenshot API and MCP server from Yorker Media. A screenshot can help document a page or compare what a site presents, but it does not replace event analytics or prove how visitors behave. The API accepts a URL and returns an image or PDF; its MCP tools let compatible AI agents request screenshots and page information.
Or skip the browser setup
One GET request can capture a page as an image or PDF. See the ScreenshotNeo API documentation for parameters and configuration.
curl -G "https://api.screenshotneo.com/v1/shot" -d access_key=YOUR_API_KEY --data-urlencode url=https://stripe.com -o shot.webpimport requests
r = requests.get(
"https://api.screenshotneo.com/v1/shot",
params={"access_key": "YOUR_API_KEY", "url": "https://stripe.com"},
timeout=90,
)
open("shot.webp", "wb").write(r.content)const q = new URLSearchParams({ access_key: 'YOUR_API_KEY', url: 'https://stripe.com' });
const res = await fetch(`https://api.screenshotneo.com/v1/shot?${q}`);Cookie banners are accepted and removed before capture, along with 60+ known consent platforms, newsletter popups, and chat widgets; each step can be turned off. Bot checks, blank pages, timeouts, failed loads, and cache hits cost nothing, and response headers report the page verdict and billing status. An MCP server provides take_screenshot, get_page_info, and capture_pdf for AI agents. The free plan includes 1,000 shots per month without a card; paid plans start at $5 for 3,000 shots. Sign up for 1,000 free screenshots a month, with no card.
Collection and analysis checklist
- Write down the user or operational question before selecting metrics.
- Choose only fields needed to answer it, with a retention and access plan.
- Document event definitions, units, time zones, and known gaps.
- Check whether observed changes could come from tracking or coverage changes.
- Review privacy risks and applicable organizational requirements.
- Start with the simplest approach that can answer the question reliably.
- Record the decision taken and how you will tell whether it helped.
Troubleshooting common project problems
| Symptom | Likely cause | Practical fix |
|---|---|---|
| Traffic rises but task completion does not | Page views are being treated as the goal, or the task event is missing. | Define the user task and validate completion instrumentation before interpreting the trend. |
| Search has many clicks but users still fail to find answers | Clicks are an incomplete relevance measure. | Review query-result samples and add a task-oriented quality check. |
| Recommendation results are repetitive | The project may over-rely on popularity or limited interaction data. | Inspect coverage across items and define relevance criteria before changing the approach. |
| Transaction data produces too many suspicious flags | A signal or rule may not distinguish unusual from genuinely problematic activity. | Review false positives and false negatives; treat flags as leads for human review. |
| Sensor charts show sudden zero values | Missing readings may have been encoded as zero, or units and timestamps may be inconsistent. | Represent missingness explicitly and validate units, time zones, duplicates, and stale readings. |
| Two reports disagree | They may differ in filters, time zones, event definitions, or data coverage. | Compare definitions and instrumentation before combining results. |
Performance, reliability, and cost
Performance needs follow the decision’s timing. If a weekly report answers the question, a streaming pipeline adds work without necessarily adding value. When data arrives quickly or analysis must inform an immediate action, account for ingestion delays, retries, duplicate events, and late-arriving records. Record timestamps and stable identifiers where appropriate so a pipeline can detect duplicates and explain gaps.
Reliability starts with data quality: validate required fields, retain clear definitions, monitor missing or stale inputs, and keep track of changes to collection. For a dashboard, communicate freshness so readers do not mistake an old value for a current one. For a research or transaction project, record the dataset scope and limits alongside any conclusion.
Cost includes collection, storage, processing, licenses or services, and the people needed to operate the workflow. Estimate based on expected volume and update rate, then revisit after a representative period. Data minimization can lower cost and reduce governance burden while keeping the project focused. No cited source provides a universal cost or performance benchmark across these application areas.
Frequently asked questions
What are examples of big data applications?
Examples include web search, recommendation systems, financial analysis, government service measurement, research discovery, website analytics, and sensor data dashboards. NIST’s catalog spans sectors, while the exact project design depends on the question and data available.
Does every web analytics project need big data?
No. Begin with the goal and data needed to measure it. Use more involved infrastructure only when volume, variety, speed, or analysis requirements call for it.
What can website analytics tell me?
With suitable measures, analytics can show how people find and use a site and help teams make design and development decisions. It cannot explain intent by itself, so interpret metrics in relation to a defined task.
Do the NIST use cases describe current implementations?
They identify use-case topics and contributors. The catalog alone does not establish current architecture, algorithms, results, or privacy practices.