How to Capture and Analyze Network Traffic with tcpdump
Learn a repeatable tcpdump workflow: choose an interface, filter safely, save pcaps, analyze them in Wireshark, and troubleshoot common capture failures.
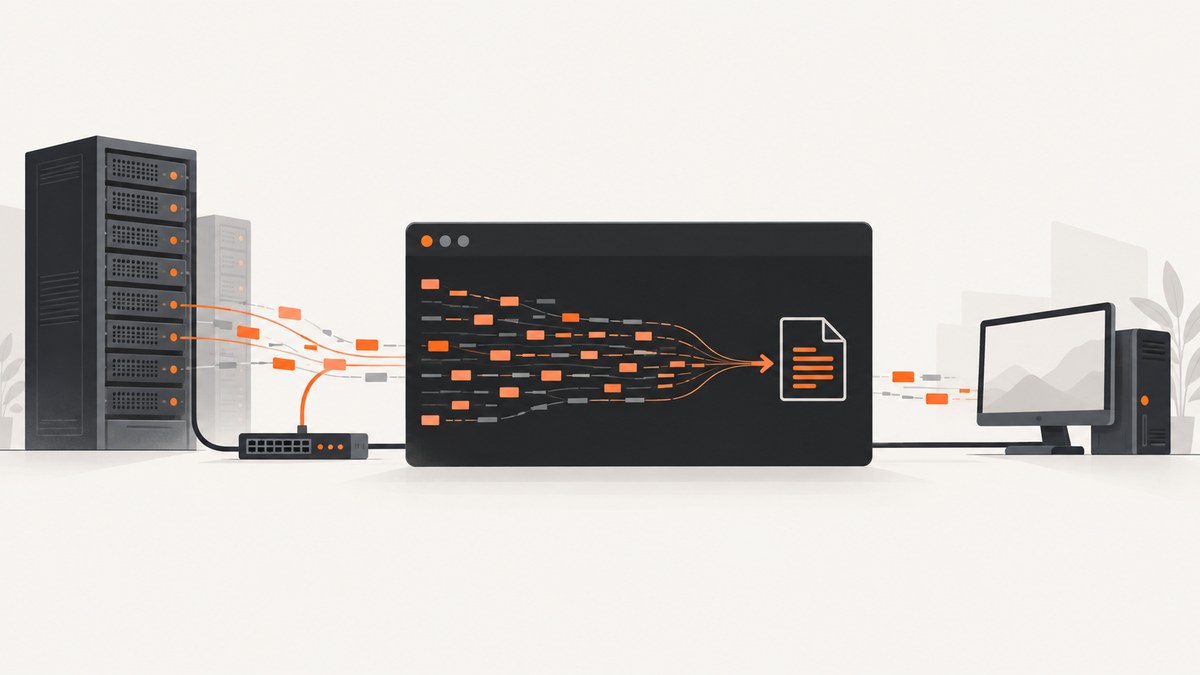
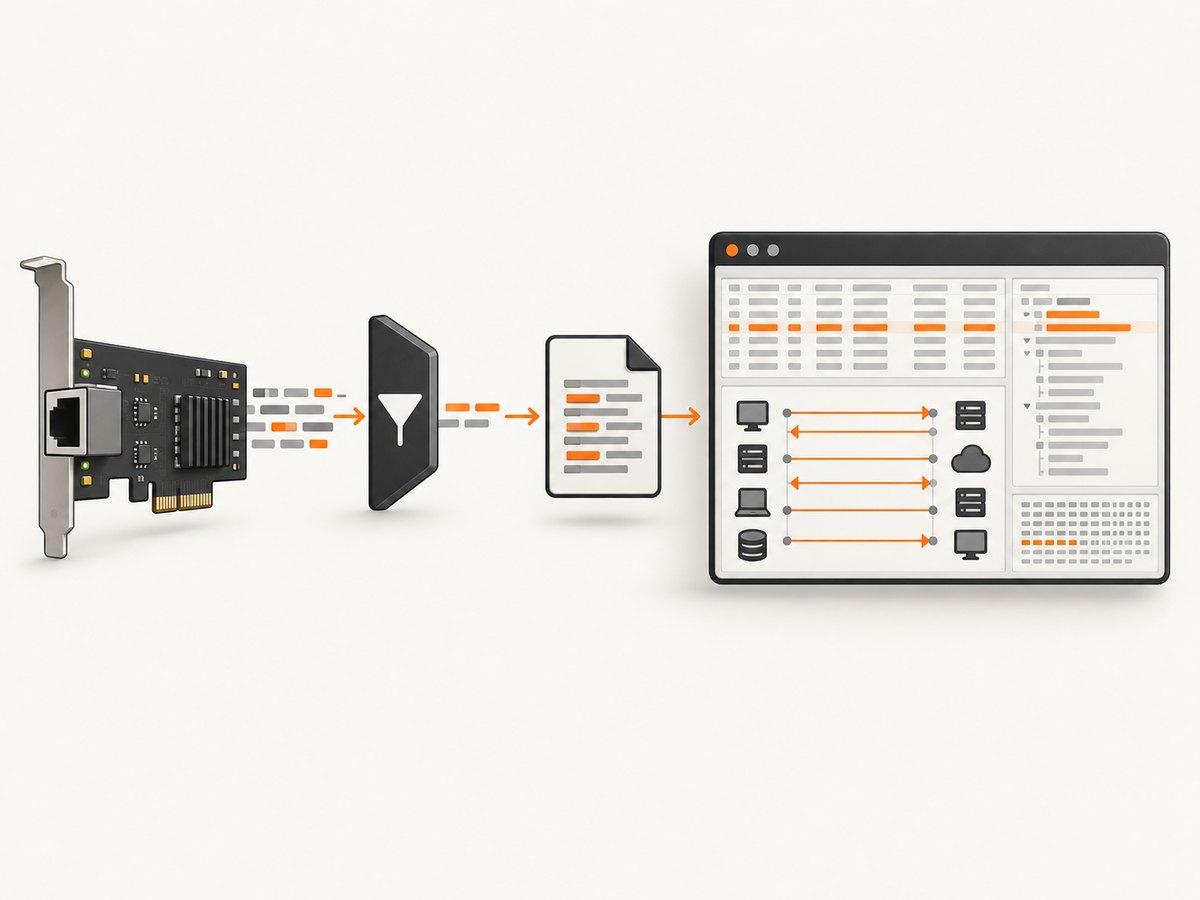
Direct answer: capture with tcpdump on the interface carrying the traffic, use a narrow Berkeley Packet Filter (BPF) expression, set an adequate snap length, and write to a pcap file. Then read that file with tcpdump or open it in Wireshark, where you can apply richer display filters and inspect conversations, retransmissions, DNS timing, and protocol errors.
A minimal HTTPS capture looks like this:
sudo tcpdump -i eth0 -nn -s 65535 -w incident.pcap 'host 192.0.2.10 and port 443'Interface names vary across Linux distributions, cloud hosts, containers, and virtual machines, so identify the correct one before starting. The tcpdump manual documents interface selection, snap length, write-to-file behavior, and filter expressions.
What tcpdump does
tcpdump is a command-line packet capture and analysis tool built on libpcap. It can inspect packets on a live interface or read an existing capture file. The project describes it as a tool for network monitoring and data acquisition. It is small enough to run on a remote production host, while Wireshark is better suited to interactive investigation on a workstation.
A useful mental model is a two-stage pipeline:
- Capture filter: a BPF expression evaluated while packets arrive. It controls what gets written and therefore controls file size and data exposure.
- Display filter: a Wireshark expression applied after capture. It lets you explore fields and conversations without collecting the traffic again.
These syntaxes are different. For example, tcpdump accepts tcp port 443; Wireshark uses fields such as tcp.port == 443. Mixing them is a common cause of errors. See the Wireshark User’s Guide for display-filter behavior.
1. Identify the interface
List capture interfaces with:
sudo tcpdump -DOn many systems, a second option is useful for a quick live view:
sudo tcpdump -i any -nn -c 20The any pseudo-interface is convenient for discovery, but it can have platform-specific behavior and may not preserve the same link-layer details as a physical adapter. Once you know where the traffic is, select that adapter explicitly:
sudo tcpdump -i ens5 -nn -c 20Generate a small amount of known traffic while watching the output. For example, resolve a hostname or make an HTTPS request from the affected host, then confirm that the expected source, destination, and protocol appear.
2. Build a focused capture filter
Start with the incident question. A narrow filter reduces disk usage, CPU work, and accidental collection of unrelated credentials or personal data.
| Question | Capture filter |
|---|---|
| What does one host exchange with an HTTPS service? | host 192.0.2.10 and port 443 |
| Are web connections failing? | tcp and (port 80 or port 443) |
| Is DNS involved? | udp port 53 or tcp port 53 |
| Are ICMP checks failing? | icmp |
| Which traffic crosses a subnet? | net 192.0.2.0/24 |
| Which two endpoints are relevant? | host 192.0.2.10 and host 198.51.100.20 |
Combine terms with and, or, and parentheses. Quote the expression so your shell does not interpret the parentheses:
sudo tcpdump -i ens5 -nn 'host 192.0.2.10 and (port 80 or port 443)'-nn disables both reverse DNS and service-name lookups. This makes output faster and avoids ambiguous names while you are troubleshooting.
3. Save a reusable pcap
Write packets to a file instead of relying on terminal output:
sudo tcpdump -i ens5 -nn -s 65535 -w incident.pcap 'host 192.0.2.10 and port 443'-i ens5selects the interface.-nnkeeps addresses and ports numeric.-s 65535requests a full packet snapshot, subject to platform and link-layer limits.-w incident.pcapwrites a pcap for later review.
Stop with Ctrl-C. The summary printed on exit includes packets captured, received by filter, and dropped by kernel. Record those numbers with the host, interface, start and end times, filter, and command line. They make the result reproducible.
On a busy host, add a packet count or time limit:
sudo tcpdump -i ens5 -nn -s 65535 -c 200 -w sample.pcap 'tcp port 443'
sudo timeout 60 tcpdump -i ens5 -nn -s 65535 -w sixty-seconds.pcap 'host 192.0.2.10'
For long incidents, use the rotation and limit options available in your installed tcpdump build. Check man tcpdump locally because exact rotation flags and behavior differ by platform and version. Keep each file bounded and monitor free disk space.
4. Read and refine the capture with tcpdump
You can test new filters against the saved file without recapturing:
tcpdump -nn -r incident.pcap
tcpdump -nn -tttt -r incident.pcap
tcpdump -nn -r incident.pcap 'dns or icmp'
tcpdump -nn -r incident.pcap 'tcp[tcpflags] & tcp-rst != 0'
Use -v, -vv, or -vvv when you need additional protocol fields. Use -X or -A only for a specific payload question: hexadecimal and ASCII output can expose tokens, cookies, credentials, and application data in terminals or logs.
To inspect timestamps precisely, choose a format deliberately. -tttt prints human-readable dates; numeric timestamps are easier to correlate with machine logs. If clock synchronization is poor, compare relative packet timing rather than assuming wall-clock values are exact.
5. Analyze the pcap in Wireshark
Copy the pcap through an approved secure channel and open it in Wireshark. Wireshark reads tcpdump pcaps and pcapng files. Its capture-filter syntax follows libpcap, while its display-filter language is separate and more expressive.
- Confirm the capture scope, interface, timestamps, and whether packets were dropped.
- Open Statistics → Protocol Hierarchy to see which protocols are present.
- Use Conversations and Endpoints to identify top talkers and the affected host pair.
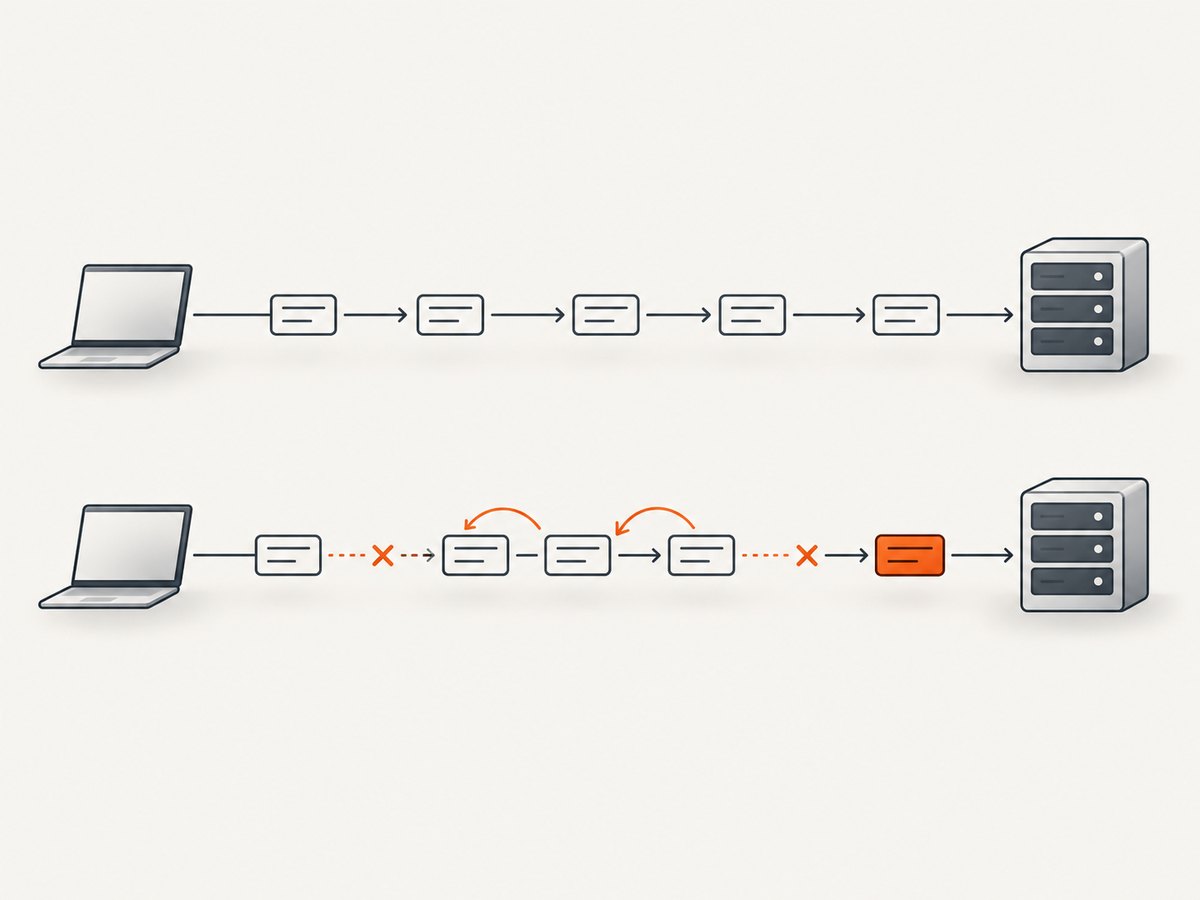
- Follow a TCP stream or conversation to correlate requests, responses, resets, and retransmissions.
- Inspect DNS request-to-response timing, TCP SYN/SYN-ACK/ACK handshakes, duplicate acknowledgements, retransmissions, FIN/RST packets, and application-layer errors.
- Compare a healthy trace with a failing trace when possible. Record packet numbers and display filters for every conclusion.
Examples of Wireshark display filters include:
ip.addr == 192.0.2.10
tcp.port == 443
dns
tcp.analysis.retransmission
tcp.flags.reset == 1
http.response.code >= 400
Encrypted HTTPS payloads normally cannot be read from a pcap alone. You can still analyze DNS, IP addresses, TCP setup, packet loss, timing, TLS handshakes, alerts, and connection resets. Decryption requires the appropriate session secrets and authorization.
Wireshark’s command-line tools can support repeatable workflows: capinfos summarizes files, editcap converts or trims captures, and tshark applies protocol-aware extraction. The Wireshark documentation covers these tools and their options.
Capture-filter versus display-filter decisions
| Use a capture filter when… | Use a display filter when… |
|---|---|
| You are collecting live traffic and need to limit volume. | The file already exists and you want to explore it. |
| You know the relevant host, network, port, or protocol. | You need protocol fields, retransmission analysis, or conversation views. |
| You must reduce exposure of unrelated traffic. | You want to test several hypotheses without recapturing. |
When uncertain, capture the smallest scope that answers the question, then use display filters for investigation. A broad “capture everything” file is harder to protect and may lose packets under load.
Edge cases and operational controls
Containers, bridges, and virtual machines
Traffic may be visible on a host bridge, a container namespace interface, a virtual NIC, or the physical uplink. Run tcpdump -D in the relevant namespace and capture close to the workload. Capturing only the uplink can miss traffic that never leaves the host.
Loopback and local services
Requests to a service on the same machine may use lo and never appear on eth0 or ens5. Capture loopback separately when diagnosing local proxies, sidecars, or Unix-hosted clients.
VLANs, tunnels, and offloading
VLAN tags, encapsulation, and checksum or segmentation offload can make packets look surprising. Capture at the point where the behavior occurs and document whether traffic is before or after a tunnel or virtual switch. Do not infer packet loss solely from an apparently bad checksum on a host capture; offloading can leave checksums unfinished until hardware transmission.
Snap length and truncation
A short snap length saves space but can remove the headers or payload needed for analysis. Use -s 65535 when full packets matter, then narrow the BPF expression and duration to control size.
Permissions and dropped packets
Packet capture generally requires root or a capability such as CAP_NET_RAW. Prefer the least privilege approved by your operating system policy. If tcpdump reports kernel drops, shorten the filter, reduce the snap length when payloads are unnecessary, capture on a less busy interface, or use a bounded rotating workflow. There is no universal packet-loss rate; check the summary for each capture.
Privacy, authorization, and retention
A pcap contains raw communications. Depending on the protocol, it may include credentials, session cookies, personal data, URLs, DNS queries, and application payloads. Capture only traffic you are authorized to inspect. Store files with restrictive permissions, transfer them through an approved secure channel, define a retention and deletion date, and redact or minimize data before sharing outside the incident team.
Performance, reliability, and cost notes
- Performance: BPF filtering at capture time is the main way to reduce CPU, memory, and disk pressure. Avoid name lookups with
-nnand avoid verbose payload output unless needed. - Reliability: Write to local storage with enough free space, use explicit duration or count limits, and preserve the exact command and drop counters. Repeat a short capture before extending a long one.
- Analysis cost: Reading a pcap repeatedly is cheaper and safer than repeatedly collecting live traffic. Keep a small original file and create working copies for trimming or conversion.
- Security cost: The more traffic you collect, the greater the impact of a leak. Narrow filters and short retention reduce that risk.
Common errors and fixes
| Error or symptom | Cause | Fix |
|---|---|---|
tcpdump: ... No such device exists |
The interface name is wrong or unavailable in the current namespace. | Run tcpdump -D; check the host or container namespace and select the listed adapter. |
Permission denied |
The process lacks capture privileges or cannot write the destination. | Use the approved elevated method, choose a writable directory, and verify file permissions. |
| The pcap is empty | The filter or interface does not match the traffic. | Capture 20 packets with -i any -nn, generate known traffic, then narrow the filter. |
| Names make output slow or confusing | Reverse DNS and service lookups are enabled. | Add -nn. |
| Important payload is missing | Snap length truncated packets, or the protocol is encrypted. | Use -s 65535 for a controlled recapture; remember encryption still hides application content. |
| Packets appear dropped | The host or capture path is overloaded. | Narrow the BPF filter, shorten the capture, reduce unnecessary payload capture, and inspect the final drop counters. |
| Wireshark rejects the filter | A tcpdump capture expression was entered as a display filter, or vice versa. | Translate it: tcp port 443 becomes tcp.port == 443 in Wireshark. |
| Timestamps do not match application logs | Clock skew, timezone confusion, or different logging precision. | Check host time synchronization and compare relative packet order and intervals. |
Or skip the browser setup
tcpdump is the right tool for packets on infrastructure. When your question is instead “what did a web page render?”, ScreenshotNeo provides a one-request website screenshot API and MCP server. It removes cookie and consent banners, newsletter popups, and chat widgets before capture. Bot checks, blank pages, failed loads, timeouts, and cache hits are not billed, and the response identifies the page verdict and billing status.
See the ScreenshotNeo API documentation for all options. A direct call is:
curl -G "https://api.screenshotneo.com/v1/shot" -d access_key=YOUR_API_KEY --data-urlencode url=https://stripe.com -o shot.webpPython
import requests
r = requests.get("https://api.screenshotneo.com/v1/shot", params={"access_key": "YOUR_API_KEY", "url": "https://stripe.com"}, timeout=90)
open("shot.webp", "wb").write(r.content)
Node.js
const q = new URLSearchParams({ access_key: 'YOUR_API_KEY', url: 'https://stripe.com' });
const res = await fetch(`https://api.screenshotneo.com/v1/shot?${q}`);
ScreenshotNeo also supports full-page and element captures, dark mode, device presets, custom CSS and JavaScript, waits, request blocking, headers and cookies, PDFs, caching, signed links, asynchronous jobs, bulk capture, and an MCP server with take_screenshot, get_page_info, and capture_pdf tools. The free plan includes 1,000 screenshots a month with no card; paid plans start at $5 for 3,000. Create a free ScreenshotNeo account.
Short FAQ
Can tcpdump capture traffic from another machine?
Only when packets are visible at a capture point you control, such as that machine, a mirror port, or an approved network sensor. It cannot magically observe traffic on an unrelated network.
Should I use pcap or pcapng?
Use the format produced by your installed tools and confirm that the downstream analyzer supports it. Wireshark supports both; interoperability requirements may determine which format you retain.
Can I recover a password from a capture?
Only if the protocol transmits it in readable form and you are authorized to inspect it. Modern encrypted protocols generally expose metadata and timing rather than plaintext credentials.
How long should I capture?
Capture long enough to include a reproducible failure, with a count or time limit. A focused one-minute trace is often more useful than an unbounded file containing hours of unrelated traffic.
What should I attach to a bug report?
Share the smallest authorized pcap, the exact command and filter, interface name, timestamps, packet and drop counts, relevant display filters, and a short description of the expected and observed behavior.