How to Scale a Puppeteer Screenshot API on Kubernetes
Scale Puppeteer screenshot workers on Kubernetes with measured capacity, workload-aware autoscaling, bounded concurrency, and graceful shutdown.

To scale a Puppeteer screenshot API on Kubernetes, run stateless workers in a Deployment behind a Service, measure their real resource use, and use a HorizontalPodAutoscaler (HPA) with a metric that tracks your workload. Bound each worker’s concurrent captures, keep warm capacity for bursts, and drain active jobs before closing browsers during pod termination. There is no universal safe number of pages per pod: benchmark representative pages and capture options on your own browser version and cluster.
Kubernetes changes the number of pods from observed metrics; it does not know that a browser worker is saturated unless the metric reflects the work. CPU is a useful starting point when rendering is CPU-bound. If requests spend much of their time waiting for navigation or external resources, compare CPU with queue depth or oldest-job age. These are architecture recommendations, not a tested deployment recipe. [Kubernetes HPA documentation]
1. Define what you are scaling
Decide what one API request means. In a synchronous service, it may represent one submitted URL and one returned image. In a queued service, acceptance and completion are separate events: the API can return a job ID before rendering finishes. State your timeout, completion latency objective, and behavior when demand exceeds capacity.
A queue can absorb short bursts, but it must be bounded. Choose a maximum queue size and a policy for full queues: reject new work with a retryable response, or apply backpressure upstream. Track queue depth and the age of the oldest job. A queue that grows continuously is not healthy capacity just because requests are still being accepted.
Define the service-level measures you will watch before choosing an autoscaling signal:
- Request acceptance rate and completed captures per second.
- Queue depth and oldest-job age, if jobs are queued.
- End-to-end latency, including time waiting for a worker.
- Render duration, timeouts, failed navigations, and output size.
- Worker CPU, memory, restarts, and browser crashes.
2. Build a stateless worker Deployment
Package the API worker as a Deployment and expose ready replicas through a Service. Keep job state outside a pod if a pod restart must not lose it. Make replicas replaceable: a worker should be able to receive a job, render it, return or store the result, and exit without being the only place that knows the job exists. Kubernetes’ HPA targets scalable workloads such as Deployments. The official walkthrough also requires a working Metrics Server for its resource-metric example. [Kubernetes HPA walkthrough]
Set minimum and maximum replicas according to availability and budget needs. Check that the cluster can schedule the maximum intended replica count; an HPA cannot create capacity if nodes have no room. Do not copy CPU values from the Kubernetes PHP sample into a Puppeteer deployment. Those values describe that example application, not browser rendering.
Here is a starting manifest. Replace the image, port, probes, resource values, and replica bounds with values established for your service. The CPU request is required for CPU utilization calculations; the sample values below are placeholders, not capacity guidance.
apiVersion: apps/v1
kind: Deployment
metadata:
  name: screenshot-worker
spec:
  replicas: 2
  selector:
    matchLabels:
      app: screenshot-worker
  template:
    metadata:
      labels:
        app: screenshot-worker
    spec:
      terminationGracePeriodSeconds: 120
      containers:
        - name: worker
          image: registry.example.invalid/screenshot-worker:VERSION
          ports:
            - name: http
              containerPort: 3000
          resources:
            requests:
              cpu: "500m" # placeholder: measure your workload
              memory: "1Gi" # placeholder: measure your workload
            limits:
              memory: "2Gi" # placeholder: validate under load
          startupProbe:
            httpGet:
              path: /health/startup
              port: http
            periodSeconds: 5
            failureThreshold: 60
          readinessProbe:
            httpGet:
              path: /health/ready
              port: http
            periodSeconds: 5
          livenessProbe:
            httpGet:
              path: /health/live
              port: http
            periodSeconds: 10
---
apiVersion: v1
kind: Service
metadata:
  name: screenshot-worker
spec:
  selector:
    app: screenshot-worker
  ports:
    - name: http
      port: 80
      targetPort: http
Use distinct health checks. Startup should pass only after the process and browser initialization are complete. Readiness should mean the worker can accept another job, not merely that its HTTP server has bound a port. Liveness should detect a stuck process, not kill a worker just because a valid screenshot is taking a long time.
3. Measure before setting requests and concurrency
HPA CPU utilization is measured relative to requested CPU. Kubernetes notes that it cannot calculate pod CPU utilization for this metric when a relevant CPU request is missing. Set requests based on observed use under representative load, then validate limits and memory behavior separately. CPU scaling does not prevent a worker from exhausting memory.
Benchmark across the dimensions that change the work:
- Use representative URLs, including typical and unusually complex pages.
- Test viewport captures and full-page captures separately.
- Vary image type and quality, viewport, font and asset loading, and navigation behavior.
- Compare browser startup per job with browser reuse, while checking isolation and cleanup.
- Increase concurrent jobs gradually and record latency, memory growth, errors, and restarts.
- Repeat long enough to reveal memory growth across many jobs, not just a short burst.
Record the browser and Puppeteer versions, resource requests and limits, cluster configuration, page mix, and concurrency for every result. The reviewed official sources provide no throughput, memory-per-page, or safe-concurrency benchmark for your service. Do not publish a pages-per-pod promise without measurements and conditions.
4. Choose and configure the autoscaling signal
Start with CPU utilization if it rises with rendering demand. HPA’s default controller sync period is 15 seconds, but this is only a control-loop interval. Metric collection, scheduling, image pulls, browser startup, and readiness all add time; it is not a scale-up latency guarantee. Keep enough ready workers for the burst your service must handle before new pods become usable.
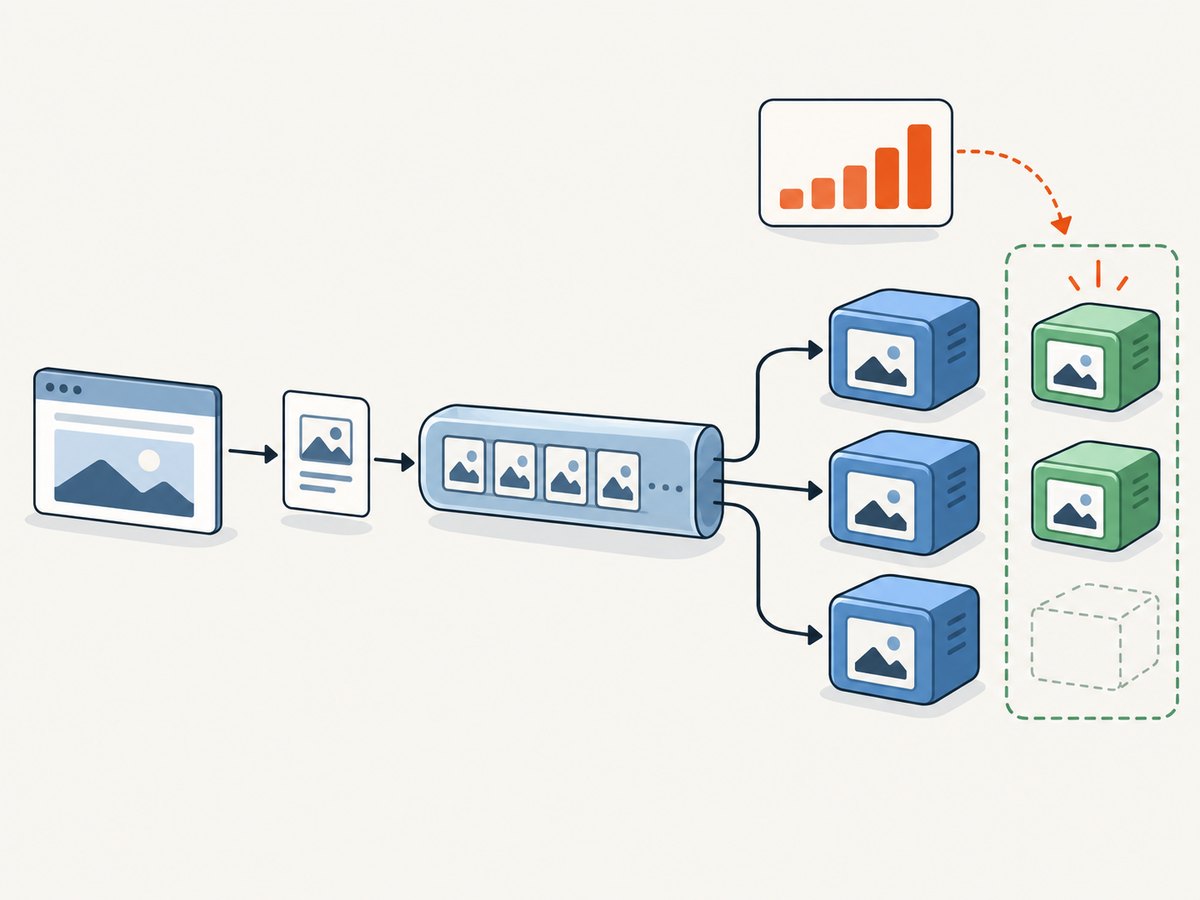
If CPU does not track queue delay or render latency, consider a custom per-pod metric or an external metric such as queue depth or oldest-job age. These require the relevant metrics API or adapter. Kubernetes autoscaling/v2 supports multiple metrics and behavior rules; when several metrics are configured, HPA uses the largest proposed replica count, subject to the configured maximum. Compare candidate signals against the actual service bottleneck rather than assuming one is always better.
Example CPU-based HPA:
apiVersion: autoscaling/v2
kind: HorizontalPodAutoscaler
metadata:
  name: screenshot-worker
spec:
  scaleTargetRef:
    apiVersion: apps/v1
    kind: Deployment
    name: screenshot-worker
  minReplicas: 2
  maxReplicas: 20
  metrics:
    - type: Resource
      resource:
        name: cpu
        target:
          type: Utilization
          averageUtilization: 70
  behavior:
    scaleUp:
      stabilizationWindowSeconds: 0
      policies:
        - type: Percent
          value: 100
          periodSeconds: 60
        - type: Pods
          value: 4
          periodSeconds: 60
      selectPolicy: Max
    scaleDown:
      stabilizationWindowSeconds: 300
      policies:
        - type: Percent
          value: 25
          periodSeconds: 60
The replica bounds and policy numbers are illustrative starting points only. Tune scale-up and scale-down behavior against burst patterns, pod startup time, and budget. A longer scale-down stabilization window can reduce flapping, while warm replicas reduce the time users wait during a surge. Neither replaces measurement.
With sidecars, total pod CPU can hide the worker container’s load. Kubernetes supports container resource metrics for targeting a named container; the documentation identifies this as stable since Kubernetes v1.30. Confirm cluster version and metric support before using it. Version-specific HPA features, including custom metrics and behavior controls, should be checked against the Kubernetes version you operate. [HPA metrics and behavior]
5. Bound Puppeteer work inside each pod
Autoscaling controls pod count, not how many pages your worker opens at once. Put a bounded queue and explicit concurrency limit in the worker. Derive the limit from load tests; high concurrency can increase memory pressure and tail latency, while a low limit can leave CPU idle and queue jobs unnecessarily. There is no universal best arrangement of one browser per request, one browser per pod, or a shared browser with multiple pages.
Puppeteer’s screenshot API supports full-page capture, clipping, output type, encoding, and quality. Quality applies to JPEG and WebP, not PNG. A full-page screenshot can do different work from a viewport capture, so treat those options as distinct workload classes when measuring. The API returns bytes by default, or a string when base64 encoding is requested. Some context operations, including creating or closing pages, wait for an active screenshot in that context to finish. [Puppeteer Page.screenshot()] [Puppeteer ScreenshotOptions]
A minimal worker sketch shows where to enforce a limit. This example uses a semaphore from a package such as async-mutex; production code also needs request validation, timeouts, result delivery, and shutdown handling.
import express from 'express';
import puppeteer from 'puppeteer';
import { Semaphore } from 'async-mutex';

const app = express();
const slots = new Semaphore(Number(process.env.MAX_CONCURRENT_CAPTURES ?? 2));
let accepting = true;
const browser = await puppeteer.launch({ headless: true });

app.get('/shot', async (req, res) => {
  if (!accepting) return res.status(503).send('worker draining');
  const url = String(req.query.url ?? '');
  try {
    const parsed = new URL(url);
    if (!['http:', 'https:'].includes(parsed.protocol)) {
      return res.status(400).send('URL must use HTTP or HTTPS');
    }
  } catch {
    return res.status(400).send('Invalid URL');
  }

  const [, release] = await slots.acquire();
  let page;
  try {
    page = await browser.newPage();
    await page.goto(url, { waitUntil: 'networkidle2', timeout: 30000 });
    const png = await page.screenshot({ type: 'png', fullPage: false });
    res.type('png').send(png);
  } catch (error) {
    res.status(502).send('Capture failed');
  } finally {
    if (page) await page.close().catch(() => {});
    release();
  }
});

app.listen(3000);
Do not accept arbitrary URLs from untrusted callers without an SSRF policy. Validate allowed schemes and destinations, and consider blocking access to internal address ranges and metadata endpoints. Set navigation and total-job timeouts, cap request and output sizes where appropriate, and avoid logging credentials embedded in URLs or custom headers. This is service hardening advice; implement it according to your network and threat model.
6. Drain jobs before closing the browser
On termination, stop accepting new jobs, let active jobs finish within a bounded grace period or cancel them cleanly, and then close the browser. Ensure the pod’s termination grace period exceeds the drain window and account for the service’s request timeout. Test what happens to queued, rendering, and response-delivery jobs when a pod is terminated.
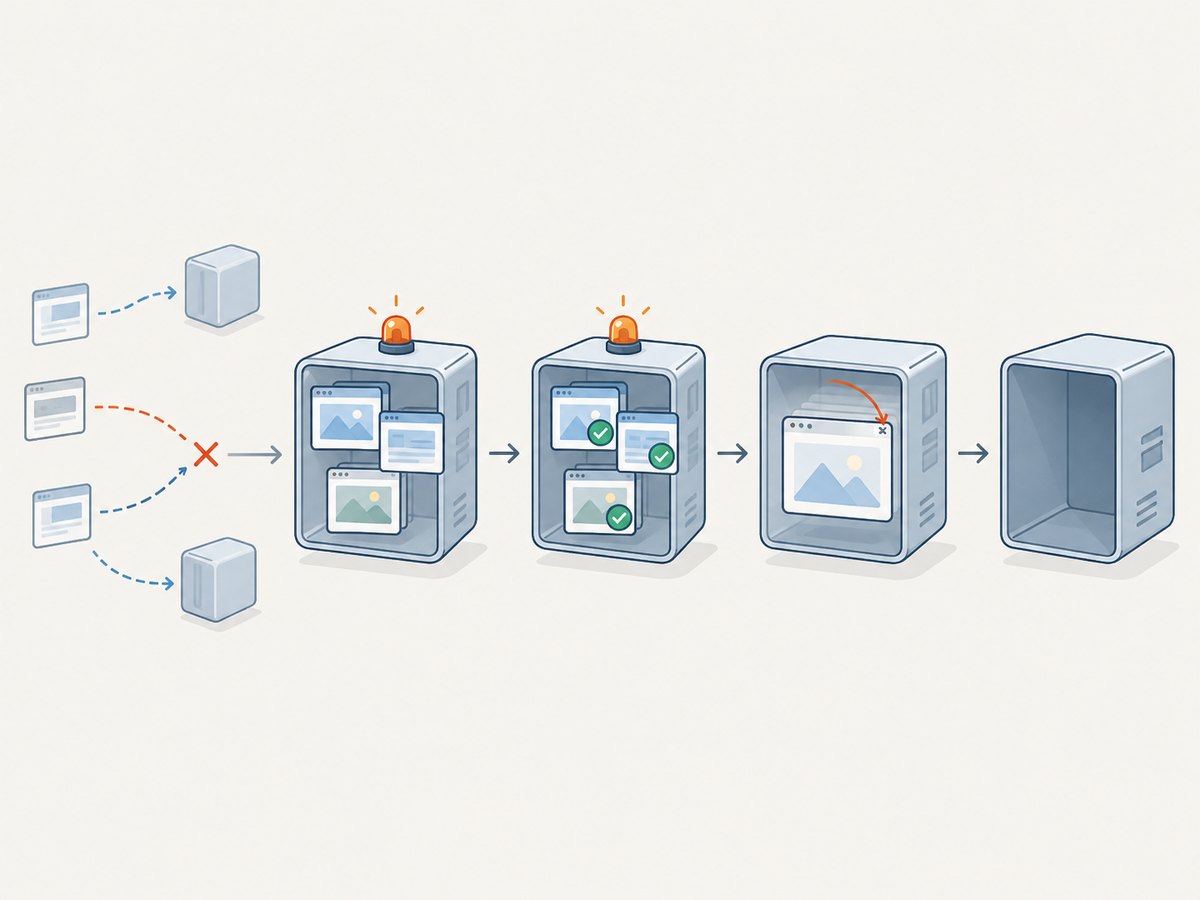
Puppeteer’s handleSIGTERM launch option defaults to true and closes the browser process on SIGTERM. That behavior alone does not document application-level queue draining. Your shutdown handler still needs to remove readiness, stop accepting work, wait for in-flight jobs, and close resources in order. [Puppeteer LaunchOptions]
7. Troubleshooting common scaling failures
| Symptom | Likely cause | What to check or change |
|---|---|---|
| HPA shows unknown CPU or no target value | Metrics Server or resource metrics are unavailable, or CPU requests are missing. | Check metric collection and pod resource requests; confirm the cluster supports the selected metric. |
| Replicas stay flat while the queue grows | CPU may not represent demand, or the custom metrics adapter is missing or returning stale data. | Compare the configured metric with queue age and latency. Check HPA events and adapter/API status. |
| Pods scale up but wait before serving | Scheduling, image pulls, browser startup, or readiness delays. | Inspect pod events and startup time. Keep warm capacity and ensure the cluster can schedule the intended maximum. |
| Repeated scale-up and scale-down | Noisy metrics, short observation windows, or overly aggressive policies. | Review metric correlation and HPA behavior settings; use stabilization and rate limits where appropriate. |
| Workers restart or get killed during captures | Memory pressure, overly high concurrency, or health checks treating valid long work as failure. | Inspect memory, OOM events, and probe configuration. Reduce concurrency or adjust measured resources and timeouts. |
| Captures fail during rollout or node drain | Pod stops receiving traffic or closes Chromium before jobs finish. | Verify readiness removal, queue claiming, drain duration, termination grace period, and shutdown ordering. |
| Long tail latency despite low CPU | Captures may wait on network resources, navigation conditions, or a saturated queue. | Break out queue wait from render time; inspect external waits and test a workload metric alongside CPU. |
| Screenshot output is unexpectedly large or slow | Full-page capture, image dimensions, format, or encoding changes the work. | Check capture options and output size; benchmark each workload class and select an appropriate format. |
8. Performance, reliability, and cost checklist
- Benchmark the page mix and options your customers actually send.
- Set CPU and memory requests from observations; monitor memory separately from HPA CPU.
- Bound concurrency and queue length, and return an explicit overload response.
- Track queue wait, render duration, failures, and pod readiness independently.
- Keep warm replicas based on the time it takes to schedule and initialize a worker.
- Test scale-up, scale-down, rollout, node drain, and termination while jobs are in each lifecycle stage.
- Set replica maximums that fit both cluster capacity and budget; watch cost alongside queue age and latency.
- Re-run benchmarks after changing Puppeteer, Chromium, resource settings, or cluster version.
More replicas can reduce queueing only when the cluster can schedule them and the downstream systems can handle the added page loads. Higher limits or concurrency can increase memory use and failure rates. Treat cost, latency, and error rate as a joint capacity decision rather than optimizing one number in isolation.
Or skip the browser setup
If your application needs screenshots but you do not want to operate Chromium workers, ScreenshotNeo is a website screenshot API and MCP server. Its API accepts one GET request and returns an image or PDF; see the ScreenshotNeo API documentation for options and setup.
curl -G "https://api.screenshotneo.com/v1/shot" -d access_key=YOUR_API_KEY --data-urlencode url=https://stripe.com -o shot.webpimport requests
r = requests.get("https://api.screenshotneo.com/v1/shot", params={"access_key": "YOUR_API_KEY", "url": "https://stripe.com"}, timeout=90)
open("shot.webp", "wb").write(r.content)const q = new URLSearchParams({ access_key: 'YOUR_API_KEY', url: 'https://stripe.com' });
const res = await fetch(`https://api.screenshotneo.com/v1/shot?${q}`);Cookie banners, newsletter popups, and chat widgets are removed before the shot. Bot checks, blank pages, and failed loads are never billed; responses identify page verdict and billing status. Its MCP server lets AI agents use screenshot tools. The free plan includes 1,000 screenshots a month with no card; paid plans start at $5 for 3,000. Create a free ScreenshotNeo account.
FAQ
How many Puppeteer pages can run in one pod?
There is no source-backed universal number. Measure representative pages while increasing concurrency under your actual CPU and memory settings, then set a bounded limit below the point where latency, memory growth, or errors become unacceptable.
Should I autoscale on CPU or queue length?
Use the metric that best predicts delayed work in your service. CPU is straightforward when rendering consumes CPU; queue age or depth may add useful demand information when CPU does not track waiting work. Validate the relationship before relying on either.
Does the 15-second HPA sync period mean pods are ready in 15 seconds?
No. It is the default controller sync interval documented by Kubernetes. Metric collection, scheduling, image startup, browser initialization, and readiness add time.
Can HPA stop browser workers from running out of memory?
No. HPA changes replica count based on configured metrics. Measure and monitor memory, bound concurrency, and validate pod memory settings separately.
Is a queue required?
No. A synchronous service can scale directly from a suitable metric. A bounded queue is an option for smoothing bursts when the API can separate acceptance from completion and define overload behavior.