Why HTTP Load Tests Fail to Catch Critical Errors
A load test can hit its throughput target and still miss failures users experience. Learn how to test behavior, observe tails, and diagnose blind spots.
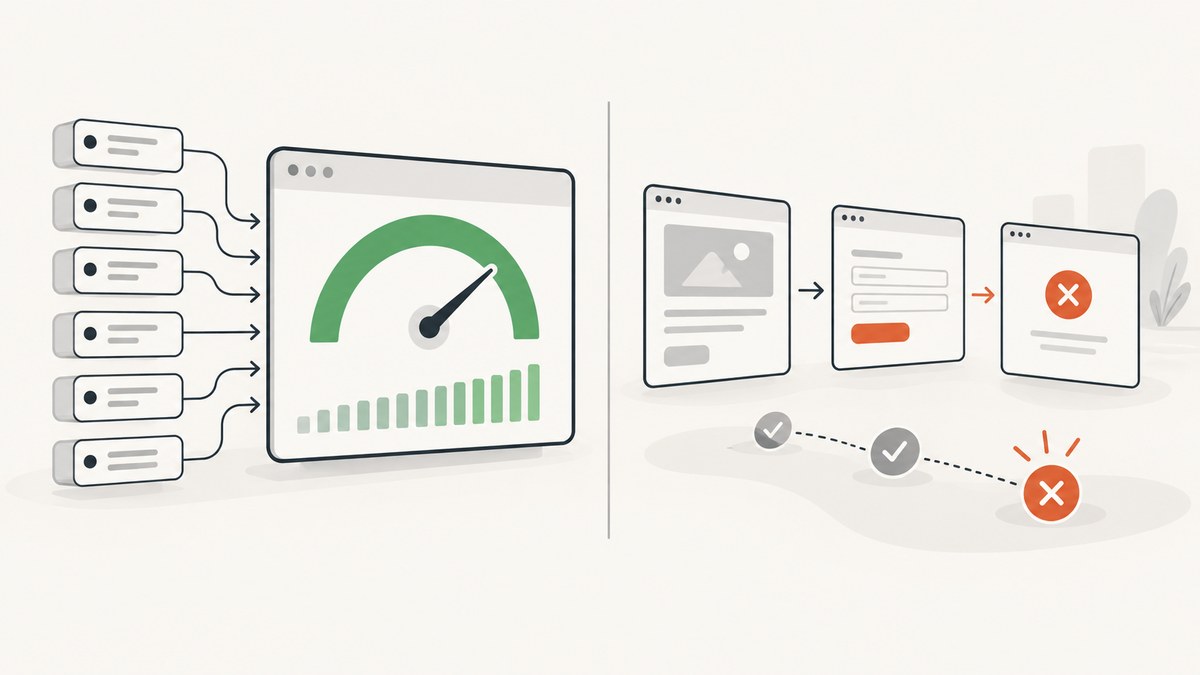
Direct answer: HTTP load tests miss critical errors when they measure transport instead of user-visible behavior. A status-200 response can contain incorrect data, a fast HTTP 500 can make average latency look better, and the load generator can fail before the application reaches the intended load. A realistic test defines business success, validates response meaning, controls arrival rate and concurrency, measures tail latency and errors separately, and monitors both the generator and the system under test.
What a “passing” load test actually proves
A green report usually proves only that a scripted client completed requests within selected limits. It does not automatically prove that:
- the response contained the right records, headers, or permissions;
- the requested business operation completed;
- all critical user flows worked under contention;
- the target received the load you intended to send;
- users in other regions or on slower clients saw the same result; or
- the service remained healthy during a burst, scale-up, or dependency failure.
Google’s SRE guidance treats latency, traffic, errors, and saturation as four core signals. It also counts incorrect content returned with HTTP 200 as an implicit error, alongside explicit failures such as HTTP 500 and policy failures such as violating a response-time objective. See the SRE monitoring guidance.
1. Assert meaning, not just HTTP status
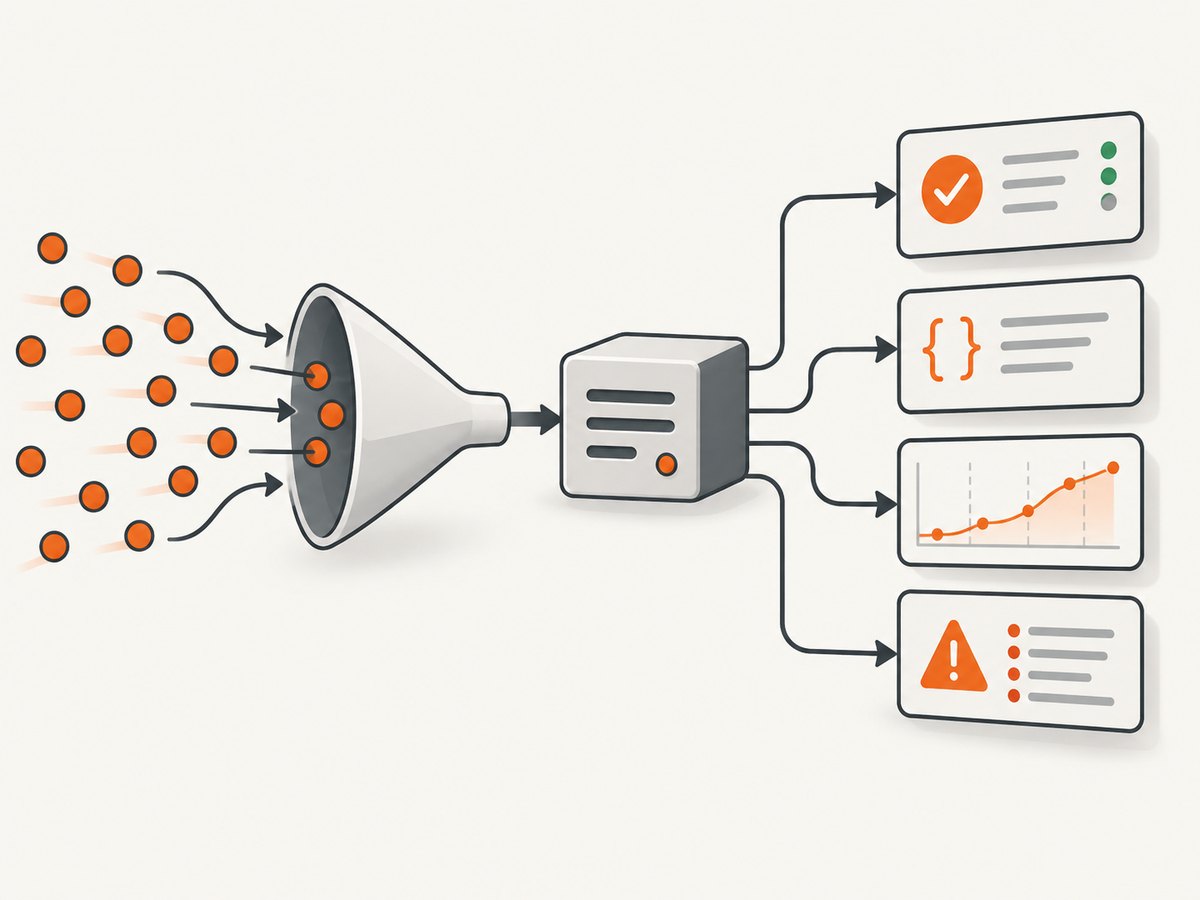
The most common blind spot is an assertion that stops at status === 200. Applications can return a cached, partial, unauthorized, or stale payload with a successful status. Validate the headers and payload fields that define success, then verify state changes for workflows such as checkout, account creation, or job submission.
Example k6 check
import http from 'k6/http';
import { check, sleep } from 'k6';

export const options = {
  thresholds: {
    http_req_failed: ['rate<0.01'],
    http_req_duration: ['p(95)<500', 'p(99)<1000'],
  },
};

export default function () {
  const res = http.get('https://example.com/api/orders/123', {
    headers: { Accept: 'application/json' },
  });

  let body = {};
  try { body = res.json(); } catch (_) {}

  check(res, {
    'status is 200': (r) => r.status === 200,
    'content type is JSON': (r) => (r.headers['Content-Type'] || '').includes('application/json'),
    'order is complete': () => body.id === '123' && body.status === 'complete',
  });

  sleep(1);
}
Keep checks close to the user outcome. For a write operation, follow the request with a read or an independently observable event when practical. If a failed response causes later script steps to throw, handle it deliberately so the scenario records a failed transaction instead of silently ending early. Grafana’s k6 checks documentation covers status, headers, and payload validation.
2. Averages hide tails and fast failures
Mean latency combines very different experiences. A service that returns 99 successful requests in 200 ms and one fast database error in 20 ms may report a pleasing average while one percent of users cannot complete the action. Conversely, a small number of very slow requests can be hidden by a large volume of fast cache hits.
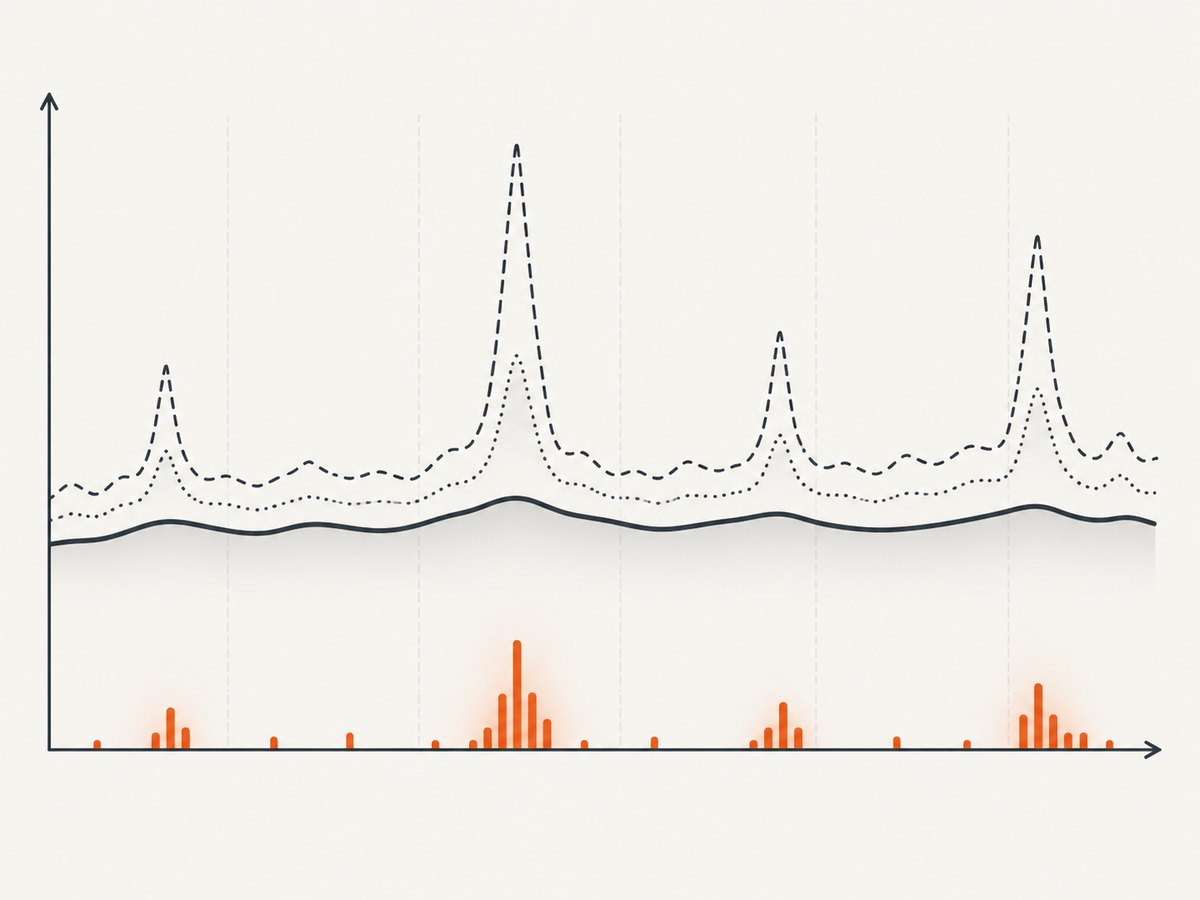
Set explicit percentile and error-rate thresholds. Report latency by endpoint and outcome, separating successful requests from 4xx/5xx responses. At minimum, collect p50, p95, and p99, plus the number and rate of failed requests. A threshold should express a service objective, for example:
thresholds: {
  http_req_failed: ['rate<0.01'],
  'http_req_duration{status:200}': ['p(95)<400'],
  'http_req_duration{status:500}': ['p(95)<800'],
}
Do not treat an illustrative threshold as a universal benchmark. Choose limits from your product’s objectives and user research. k6 threshold syntax is documented in its thresholds reference.
3. The load generator may be the bottleneck
Virtual users are not the same as a guaranteed request rate. Client sleeps, connection reuse, DNS, TLS handshakes, serialization, and script work all affect how much traffic reaches the target. A generator that is CPU-bound, network-bound, out of file descriptors, or limited by sockets can report client-side errors before the application is stressed.
During every run, monitor generator CPU, memory, network throughput, open files, active connections, and runtime warnings. Correlate timestamps with target logs. If generator utilization approaches saturation, reduce per-request script overhead, use a more efficient client, raise operating-system limits where appropriate, or distribute the generators across machines or regions. k6 documents connection resets, timeouts, and open-file-limit failures in its large-test guidance. Locust also warns that a non-cooperative custom client can block a worker; see its performance documentation.
4. A narrow workload misses real behavior
A single happy-path endpoint cannot represent a product. Real traffic contains multiple journeys, different data sizes, authenticated and anonymous users, cache hits and misses, retries, pagination, uploads, and dependency calls. Build coverage in layers:
- Critical flows: identify the operations whose failure matters most to users or revenue.
- Data variation: use realistic account sizes, search terms, permissions, and payload lengths.
- Traffic mix: assign proportions to journeys instead of sending every virtual user through one script.
- Failure continuation: record a failed step while preserving later independent scenarios.
- State validation: verify that writes changed the expected state, not merely that a response arrived.
Keep test data isolated and repeatable. Avoid one shared account or identifier that introduces lock contention unrelated to normal usage. Make cleanup explicit so a long run does not gradually change the workload.
5. Choose the right load model
Use a model that matches the question:
| Question | Workload | What to inspect |
|---|---|---|
| Will the service scale to expected demand? | Gradual ramp to a sustained arrival rate | Capacity, tail latency, instance creation, recovery |
| Is steady state reliable? | Constant arrival rate or concurrency for a defined duration | Error rate, resource leaks, queue growth |
| What happens during a burst? | Controlled spike with a known start and end | Cold starts, throttling, retries, dropped work |
| Where is the breaking point? | Stepwise increases with pauses | Saturation transitions and failure modes |
Arrival-rate tests answer “how many requests per second can be accepted?” Concurrency tests answer “how many active users can be served?” They are related but not interchangeable. Ramp-up controls how quickly you reach a level; it does not define the level itself. Keep generator location consistent for comparisons, and use user-relevant regions when geographic latency is part of the requirement.
6. Observe the system at useful resolution
Collect time-aligned metrics and logs from the client and every important dependency. At the target, watch request latency, traffic, errors, CPU, memory, network, queue depth, database time, cache behavior, and saturation signals. A resource need not reach 100 percent before it causes user-visible degradation.
For rapid spikes, minute-level aggregates can hide the failure. Google Cloud recommends fine-grained, including second-by-second, log analysis for load and scaling investigations. Repeat runs at several load levels and inspect instance creation, initialization, request distribution, and latency recovery. Cloud quotas and platform limits change, so verify current provider documentation before applying a platform-specific limit to another environment.
7. A runnable test plan
- Write the acceptance contract. Define successful content, allowed error rate, percentile objectives, duration, and the user flows in scope.
- Instrument checks. Assert status, headers, payload fields, and state transitions.
- Prepare data. Create representative records and credentials; record how they are reset.
- Validate the generator. Run a small baseline and confirm it has CPU, network, socket, and file-descriptor headroom.
- Run a ramp. Increase demand in steps while recording target and generator telemetry.
- Run steady state. Hold the expected rate long enough to expose queues, leaks, and cache changes.
- Run a burst separately. Do not confuse spike behavior with the steady-state capacity result.
- Review failures by outcome. Group by endpoint, status, exception, region, and dependency; inspect raw payloads and logs.
- Repeat. Keep location, build, data, and configuration stable when comparing changes.
8. Troubleshooting common false greens
| Symptom | Likely cause | Fix |
|---|---|---|
| All requests are 200 but users report wrong data | No semantic assertions, stale cache, or partial response | Check payload fields, headers, freshness, permissions, and state transitions. |
| Average latency improves as errors rise | Fast 4xx/5xx responses are included in the average | Report error rate and latency by status and outcome; enforce thresholds. |
| Generator shows timeouts while target looks idle | Client CPU, sockets, network, or file descriptors are exhausted | Inspect generator telemetry, lower script overhead, raise limits, or distribute load. |
| Throughput plateaus below the target | Think time, connection limits, or arrival-rate configuration is constraining demand | Measure actual requests per second and remove unintended sleeps or client caps. |
| Only later workflow steps disappear | An early failed response throws or skips the scenario | Handle failure explicitly, record it, and continue independent steps. |
| Results vary widely between runs | Different data, regions, warm-up, autoscaling state, or dependency conditions | Control those variables, add a warm-up, and compare time-aligned evidence. |
| Production fails although staging passes | Different limits, data sizes, integrations, traffic mix, or initialization cost | Reproduce production constraints safely and include dependencies in the model. |
9. Checklist before calling a test green
- Have you written the user-visible success condition?
- Do checks validate status, headers, payload, and critical state changes?
- Are error rate and latency evaluated independently?
- Are p95 and p99 thresholds explicit?
- Does the workload include critical flows, data variation, and realistic proportions?
- Did you choose ramp, steady, or spike behavior intentionally?
- Did you verify the generator has headroom?
- Are target saturation, dependencies, and logs monitored at useful resolution?
- Did you repeat the run under controlled configuration?
- If browser rendering or mobile behavior matters, did you test those client layers separately?
Or skip the browser setup
Load testing is an HTTP concern, but teams often also need reliable screenshots of pages to inspect rendered states, regression evidence, or incident reports. ScreenshotNeo provides a website screenshot API and MCP server. One GET request returns a PNG, JPEG, WebP, or PDF. It accepts cookie and consent banners like a visitor, then removes more than 60 known consent platforms, newsletter popups, and chat widgets before capture; each step can be disabled. Bot checks, blank pages, timeouts, failed loads, and cache hits are not billed, and response headers identify the page verdict and whether it was billed.
curl -G 'https://api.screenshotneo.com/v1/shot' -d access_key=YOUR_API_KEY --data-urlencode url=https://stripe.com -o shot.webpimport requests
r = requests.get('https://api.screenshotneo.com/v1/shot', params={'access_key': 'YOUR_API_KEY', 'url': 'https://stripe.com'}, timeout=90)
open('shot.webp', 'wb').write(r.content)const q = new URLSearchParams({ access_key: 'YOUR_API_KEY', url: 'https://stripe.com' });
const res = await fetch(`https://api.screenshotneo.com/v1/shot?${q}`);See the ScreenshotNeo API documentation for the full option set, including full-page and selector capture, device presets, dark mode, retina scale, custom CSS and JavaScript, waits, request blocking, headers and cookies, geolocation, resizing, caching, signed links, asynchronous webhooks, bulk capture, usage data, and PDFs. Its MCP server exposes take_screenshot, get_page_info, and capture_pdf for Claude, Cursor, and other MCP clients.
The Free plan includes 1,000 screenshots per month with no card. Paid plans start at $5 for 3,000 shots, and every feature is included on every plan. Create a free ScreenshotNeo account.
FAQ
Can a 200 response still be an error?
Yes. If the payload is incorrect, incomplete, stale, or violates the user’s expected state, treat it as an implicit error and assert the relevant content.
Should I use concurrency or arrival rate?
Use arrival rate when you need a controlled request volume; use concurrency when active-user population is the question. Document the model so results are comparable.
How many runs are enough?
There is no universal number. Repeat enough to separate configuration noise from a change, and include separate ramp, steady-state, and burst questions when those behaviors matter.
Why monitor the generator?
A saturated generator can create client-side errors or limit offered load, making a healthy target look like the bottleneck. Generator headroom is part of test validity.
Does an HTTP test replace a browser test?
No. Protocol tests do not execute browser rendering, JavaScript behavior, layout, or mobile client constraints. Add browser-level coverage when those layers affect the user outcome.