How to Get Started With Infrastructure Monitoring
Set up useful infrastructure monitoring with a focused scope, core telemetry, dashboards, actionable alerts, and a practical troubleshooting workflow.
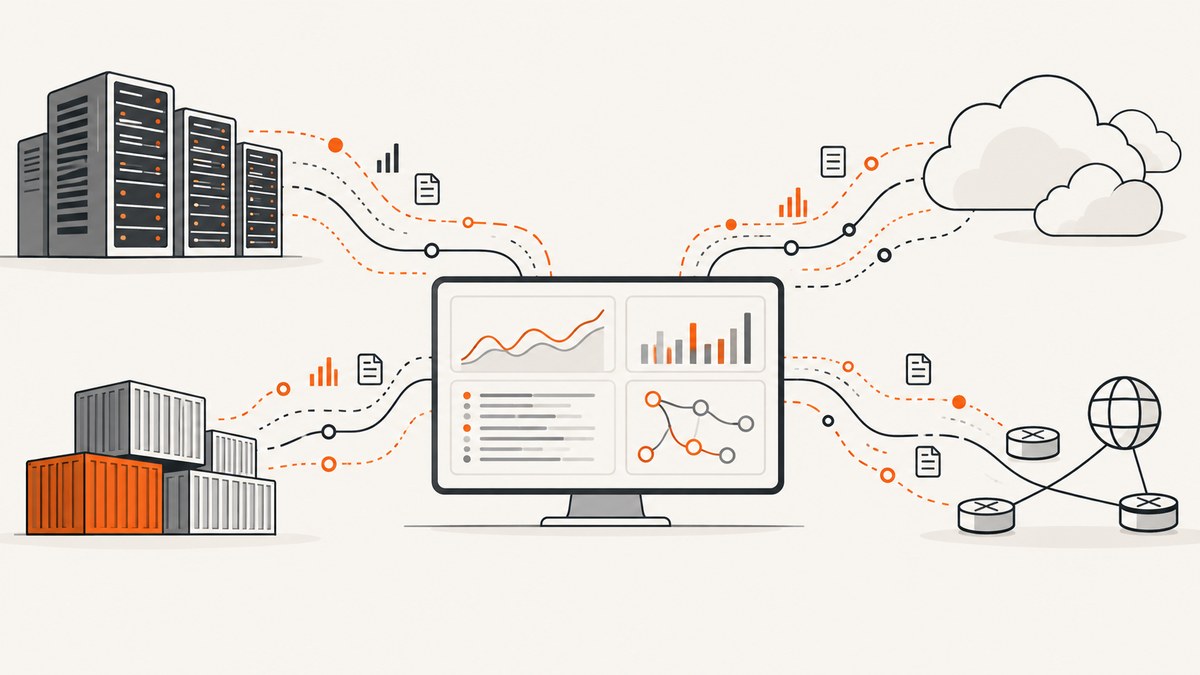
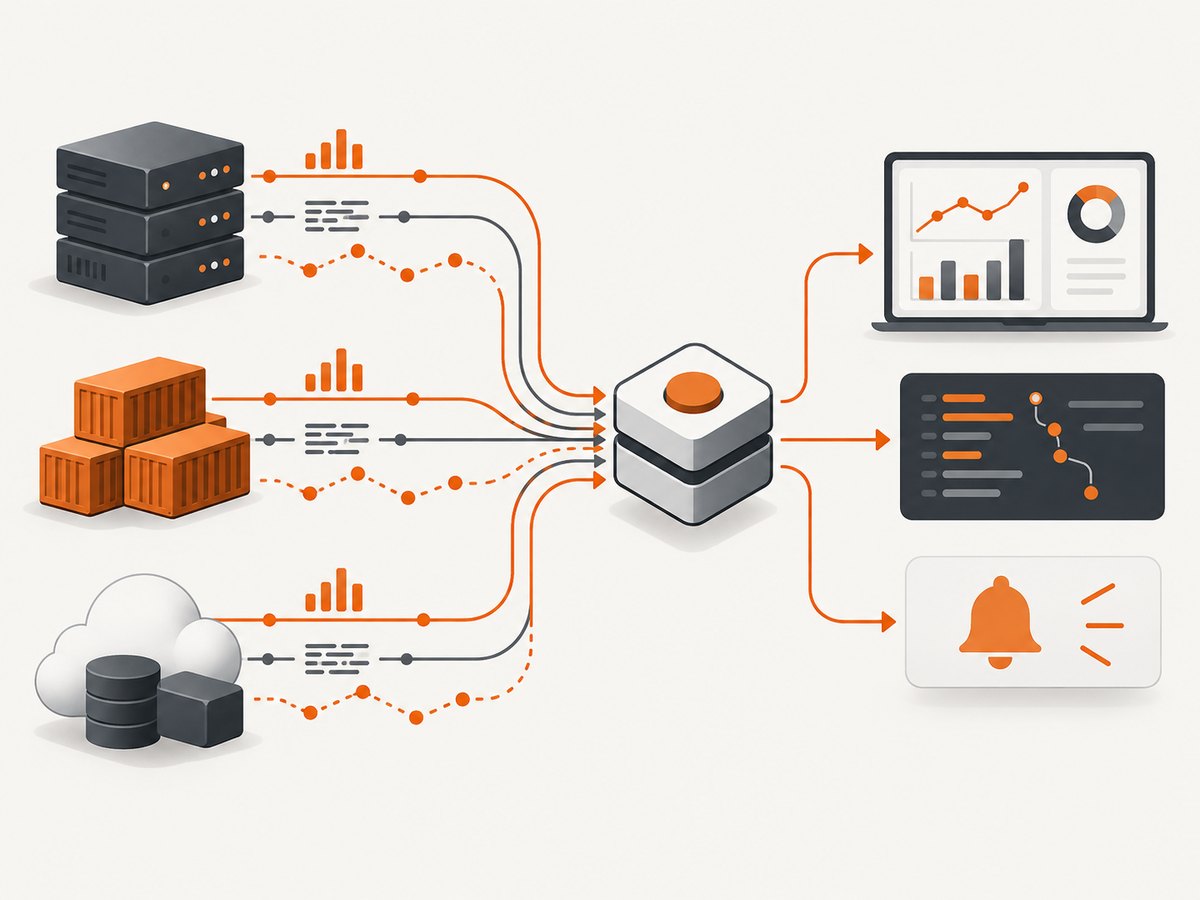
Infrastructure monitoring starts with a defined scope, a small set of useful telemetry, and alerts that lead to a human action. Begin by listing the hosts, cloud resources, clusters and networked services that matter to a business outcome. Collect host or resource metrics and relevant logs, place them on a focused dashboard, and add a few actionable alerts. Add traces when requests cross services; add profiling when you need to find code-level resource consumption.
This guide shows how to build that first monitoring path, choose between a cloud-native service and an OpenTelemetry collector, avoid noisy alerts, and expand coverage safely.
1. Define what you need to monitor
Write down the systems whose health or use needs attention. Include production hosts, databases, load balancers, queues, Kubernetes clusters, serverless functions, storage, and important third-party dependencies. For each item, record an owner and the outcome that can be affected: serving requests, processing jobs, meeting a latency objective, or keeping capacity available.
| Scope | Useful first signals | Question answered |
|---|---|---|
| Virtual or physical host | CPU, memory, disk, filesystem, network, process state | Is this machine healthy and near a resource limit? |
| Cloud resource | Service metrics, status, errors, throttling, capacity | Is the managed resource serving requests and within limits? |
| Container or pod | Restarts, CPU and memory usage, readiness, saturation | Is a workload failing or being constrained? |
| Database or queue | Connections, latency, storage, lag, depth, errors | Is data processing becoming a bottleneck? |
| Networked service | Request rate, errors, latency, dependency health | Can users complete the operation end to end? |
Decide who responds to each condition and during which hours. A dashboard can be useful without paging anyone; a page should represent a condition that requires prompt human work. This scope keeps the initial collection and alert set small enough to operate.
2. Choose metrics, logs, traces and profiles
Each telemetry signal answers a different question:
- Metrics are numerical measurements over time. They show trends, rates, saturation and error counts, making them useful for dashboards and alerting.
- Logs are contextual event records. They explain what a process reported at a particular time and often contain an error message, request identifier or configuration detail.
- Traces show a request’s path and timing through multiple services. They help locate a slow dependency or a failing hop in a distributed transaction.
- Profiles identify code-level resource consumption such as CPU or memory hot spots. Use them when aggregate metrics show a problem but do not explain which code is responsible.
Grafana’s telemetry guidance describes these signals as complementary rather than interchangeable (telemetry signal quick start). Start with metrics and logs. Add traces where a request crosses service boundaries, and profiling when an investigation reaches the code level.
3. Select a collection path
Cloud-native managed monitoring
If most of your estate is in one cloud, its native service can reduce the number of components you operate. AWS documents Amazon CloudWatch setup for EC2 and on-premises infrastructure metrics and logs, along with metrics, logs, alarms and dashboards (CloudWatch getting started). CloudWatch also documents OpenTelemetry support and native OTLP ingestion (CloudWatch overview).
This path is a natural first evaluation for an AWS-centered environment. Check which agents, permissions, regions, retention settings and integrations your actual resources require.
OpenTelemetry collector plus a backend
An OpenTelemetry Collector can receive, process and forward telemetry to a backend you select. The OpenTelemetry operations guide targets production operators collecting traces, metrics and logs from several services, including setups that avoid changing application code. Its learning path covers collector configuration and Kubernetes automation.
This approach is useful when you have several clouds, on-premises systems or a need to keep collection separate from storage and visualization. Grafana documents infrastructure integrations and a managed Cloud platform with dashboards, metrics, logs and traces (monitor infrastructure; OpenTelemetry insights).
Compare options against your operating model
| Criterion | Questions to ask |
|---|---|
| Coverage | Does it collect from your hosts, cloud services, containers, network and databases? |
| Collection effort | How are agents, collectors, permissions, upgrades and Kubernetes discovery managed? |
| Correlation | Can operators move from a metric to related logs and traces using shared resource or request attributes? |
| Operations | Are dashboards, alert routing, silences, escalation and incident workflows clear? |
| Data controls | What retention, access controls, regional storage and redaction options are available? |
| Cost | What are the current ingestion, retention, query and egress costs for your expected volume? |
AWS’s monitoring decision guide describes CloudWatch, X-Ray and AWS Distro for OpenTelemetry in its observability landscape. There is no neutral benchmark that makes one stack best for every geography, workload or team; evaluate with your own volume and response process.
4. Install a first collector
For a multi-service or Kubernetes environment, begin with a collector deployment appropriate to your topology. Keep collection close to the workloads and send to a controlled backend. A minimal configuration pattern looks like this:
receivers:
  otlp:
    protocols:
      grpc:
      http:
  hostmetrics:
    collection_interval: 60s
    scrapers:
      cpu:
      memory:
      disk:
      filesystem:
      network:

processors:
  memory_limiter:
    check_interval: 5s
    limit_mib: 512
  batch:
    timeout: 10s

exporters:
  otlphttp:
    endpoint: https://your-backend.example.com/v1/otlp
    headers:
      authorization: ${env:OTEL_EXPORTER_OTLP_HEADERS}

service:
  pipelines:
    metrics:
      receivers: [otlp, hostmetrics]
      processors: [memory_limiter, batch]
      exporters: [otlphttp]
    logs:
      receivers: [otlp]
      processors: [memory_limiter, batch]
      exporters: [otlphttp]
    traces:
      receivers: [otlp]
      processors: [memory_limiter, batch]
      exporters: [otlphttp]
Replace the endpoint and authentication mechanism with the values required by your backend. Validate the configuration before deployment, then send a small known workload and confirm that resource attributes, timestamps and service names arrive as expected. In Kubernetes, add discovery and resource limits deliberately; a collector that is itself starved or overloaded becomes an observability blind spot.
5. Build a dashboard operators can use
Start with one dashboard for a service or environment. Put the highest-value view at the top:
- Request or job rate.
- Error rate and failed operations.
- Latency, using a distribution or percentiles where supported.
- Resource saturation: CPU, memory, disk, network, queue depth or database connections.
- Recent deploys, restarts and important log events.
- Links or panels that let an operator inspect related logs and traces.
Use consistent labels for environment, region, cluster, namespace, service and instance. Keep units and time ranges obvious. A dashboard should help answer “what changed, when did it change, and which resource or request is affected?” CloudWatch describes dashboards that combine metric and log visualizations (CloudWatch metrics); Grafana documents dashboards for OpenTelemetry data.
6. Create actionable alerts
Choose a small set of conditions that warrant a response. Tie each alert to an outcome and include the affected service, owner, runbook link and a useful time window.
- Page on sustained elevated error rate for a critical operation.
- Page when a queue or lag condition threatens a stated processing objective.
- Warn on capacity trends that require planned work.
- Alert on host or pod health when the condition is persistent and redundancy is insufficient.
Avoid universal thresholds. CPU at 80% may be normal for one workload and dangerous for another. Establish a baseline from normal traffic, account for startup and batch periods, and use a duration or multiple evaluation periods to reduce flapping. CloudWatch documents alarms as a core capability; the useful threshold is specific to your workload and response agreement.
7. Test the monitoring path
- Generate a harmless test event and confirm the metric or log appears.
- Stop or isolate a disposable workload and verify the expected alert and notification route.
- Check that labels identify the correct environment and owner.
- Open the runbook from the alert and confirm that the first diagnostic commands still work.
- Record collection delay, dashboard load time and any dropped telemetry.
Repeat after collector upgrades, permission changes, backend migrations and major architecture changes. Monitoring is a service that needs its own health checks.
8. Troubleshooting common failures
| Symptom | Likely cause | Fix |
|---|---|---|
| No data from a host | Agent is stopped, permission is missing, or egress is blocked | Check service status and collector logs, verify credentials and firewall or proxy rules, then send a known test metric. |
| Metrics arrive with wrong timestamps | Clock drift or incorrect timezone handling | Synchronize host clocks, use UTC in transport and inspect timestamp conversion at the backend. |
| Logs are present but cannot be correlated | Inconsistent service, environment or request identifiers | Standardize resource attributes and propagate a request or trace identifier through services. |
| Alerts flap | Threshold is too close to normal variation or evaluation window is too short | Use a sustained condition, a longer window, hysteresis where available, and a workload-specific baseline. |
| Collector memory grows | Backend is slow, queues are too large, or cardinality is excessive | Enable memory limits and batching, inspect exporter errors, reduce unnecessary labels and scale collectors. |
| Dashboard is slow or expensive | Queries scan excessive history or high-cardinality dimensions | Limit default time ranges, pre-aggregate where supported, and remove unused dimensions. |
| Trace spans are missing | Instrumentation or sampling is incomplete | Check SDK and collector pipelines, verify propagation headers, and test one request end to end. |
9. Performance, reliability and cost
Collection consumes CPU, memory, network bandwidth and storage. Set a collection interval that matches the question: infrastructure capacity trends rarely need sub-second sampling, while a short-lived job may require event-level logs. Control metric cardinality by avoiding unbounded labels such as raw user IDs or arbitrary URLs.
Use batching and compression where supported, and deploy collectors with resource limits and redundancy appropriate to the environment. Decide what happens during a backend outage: bounded queues can absorb short interruptions, while persistent buffering increases disk use and recovery complexity. Monitor dropped records, exporter failures and queue depth.
Cost depends on telemetry volume, retention, query frequency, storage class, egress and the pricing model of the selected backend. Review ingestion and retention monthly as services and log verbosity change. Sample traces and debug logs when full-fidelity retention is not needed, while preserving enough data for incident investigation.
10. Or skip the browser setup
Infrastructure teams often need screenshots of dashboards, status pages or deployment views for incident records and reports. ScreenshotNeo is a website screenshot API and MCP server. One GET request returns a PNG, JPEG, WebP or PDF. It accepts cookie and consent banners like a visitor, removes more than 60 known consent platforms plus newsletter popups and chat widgets, and each step can be turned off. Bot checks, blank pages, timeouts, failed loads and cache hits are not billed; response headers identify the page verdict and billing status.
See the ScreenshotNeo API documentation for all options. A basic capture is:
curl -G "https://api.screenshotneo.com/v1/shot" -d access_key=YOUR_API_KEY --data-urlencode url=https://stripe.com -o shot.webpimport requests
r = requests.get("https://api.screenshotneo.com/v1/shot", params={"access_key": "YOUR_API_KEY", "url": "https://stripe.com"}, timeout=90)
open("shot.webp", "wb").write(r.content)const q = new URLSearchParams({ access_key: 'YOUR_API_KEY', url: 'https://stripe.com' });
const res = await fetch(`https://api.screenshotneo.com/v1/shot?${q}`);Options cover full-page capture with lazy images loaded, CSS selector elements, dark mode, 12 device presets or custom viewports, retina scale, PDF paper size and margins, custom CSS and JavaScript, clicks, selector waits, delays, network idle, request blocking, headers, cookies, user agents, authorization, timezone, geolocation, transparent backgrounds, resizing, chosen cache TTL, signed links, asynchronous jobs with signed webhooks, bulk capture of up to 100 URLs per call, a usage API and an OpenAPI specification. An MCP server provides take_screenshot, get_page_info and capture_pdf for Claude, Cursor and other MCP clients.
There are 1,000 free shots each month with no card. Paid plans start at $5 for 3,000 shots; yearly billing provides two months free, and every feature is on every plan. Create a free ScreenshotNeo account.
11. Expand coverage from real investigations
After the first incident reviews, list questions your current setup could not answer. Add a signal only when it closes one of those gaps. Examples include database query traces for unexplained latency, process-level metrics for noisy neighbors, or structured application logs for a failed workflow. Retire dashboards and alerts that no longer lead to action. This feedback loop keeps monitoring aligned with the systems and outcomes your team owns.
FAQ
Should I start with logs or metrics?
Start with both: metrics provide trends and alertable conditions, while logs provide event detail. Keep the initial volume focused on the systems and operations in scope.
Do I need distributed tracing on day one?
Add tracing when requests cross services or when metrics and logs cannot show where time is spent. A single-service system may gain more from reliable metrics and structured logs first.
Is a collector required for AWS monitoring?
No. CloudWatch provides AWS-native collection and visualization paths. A collector is useful when you need a common pipeline across several services, clouds or on-premises systems.
How many alerts should a new team create?
Create only the alerts tied to a response or planned action. Expand after reviewing real incidents and measuring which signals helped responders.
How often should monitoring be reviewed?
Review after incidents, deployments and architecture changes, and perform a regular cost and coverage review as telemetry volume grows.