12 HTTP Clients and Web Debugging Proxy Tools
Compare HTTP clients and debugging proxies, learn which tool fits each workflow, and automate reliable API and traffic inspection.
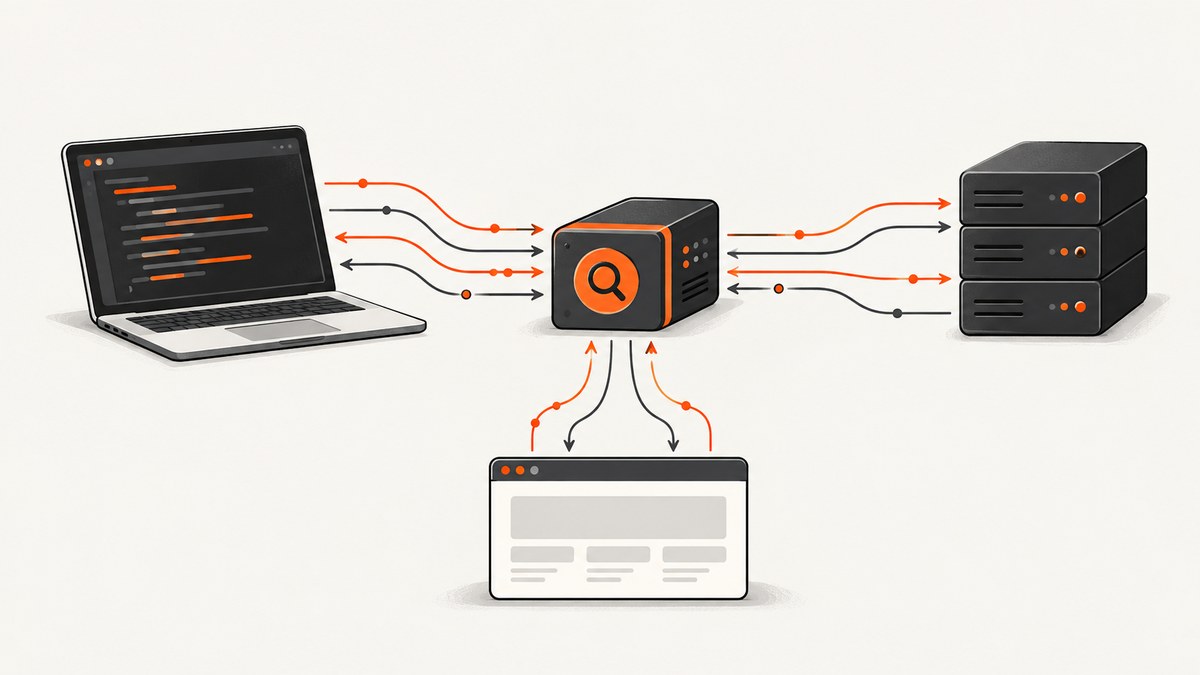
Short answer: use an HTTP client when you need to create, send, save, and automate API requests. Use a debugging proxy when you need to observe or change traffic produced by another application. Some products combine both jobs. Postman is the clearest example: its desktop app sends requests and can capture traffic through its built-in proxy. For TLS interception, the client or device must route traffic through the proxy and usually trust the proxy’s certificate; certificate pinning and application restrictions can prevent inspection.
This guide compares twelve practical entries built from six documented products and their documented interfaces. The entries are grouped by the job they perform, so you can choose a workflow instead of picking a winner without context.
1. Choose by workflow first
| What you need to do | Best starting point | Why |
|---|---|---|
| Build and send REST, GraphQL, or other API calls in a GUI | Postman, Insomnia, or HTTPie Desktop | They provide request builders, saved requests, and response inspection. |
| Keep API collections as files in Git | Bruno | Its documentation describes local-first, Git-native plain-text collections. |
| Work from a terminal or CI job | HTTPie CLI, Bruno CLI, or mitmdump | These products document command-line or non-interactive workflows. |
| Inspect another application’s HTTP, HTTPS, or WebSocket traffic | mitmproxy or OWASP ZAP | They are proxy-oriented and can observe routed traffic. |
| Capture screenshots of a web page instead of debugging requests | ScreenshotNeo | It is a website screenshot API with clean captures, pay-only-for-clean-shot billing, and an MCP server for AI agents. |
An API client creates a request directly. A proxy only sees traffic that an application or device sends through it. That distinction determines setup, permissions, and what evidence you can collect.
2. Postman desktop client and built-in proxy
Postman’s desktop app is both a general API client and a traffic-capture tool. Its built-in proxy can capture HTTP and HTTPS requests from configured clients, including requests, responses, and cookies. Captured traffic can be searched or filtered, kept in session history, and saved to collections. Postman also documents system-proxy, proxy-environment-variable, and custom-proxy settings for requests made by Postman itself.
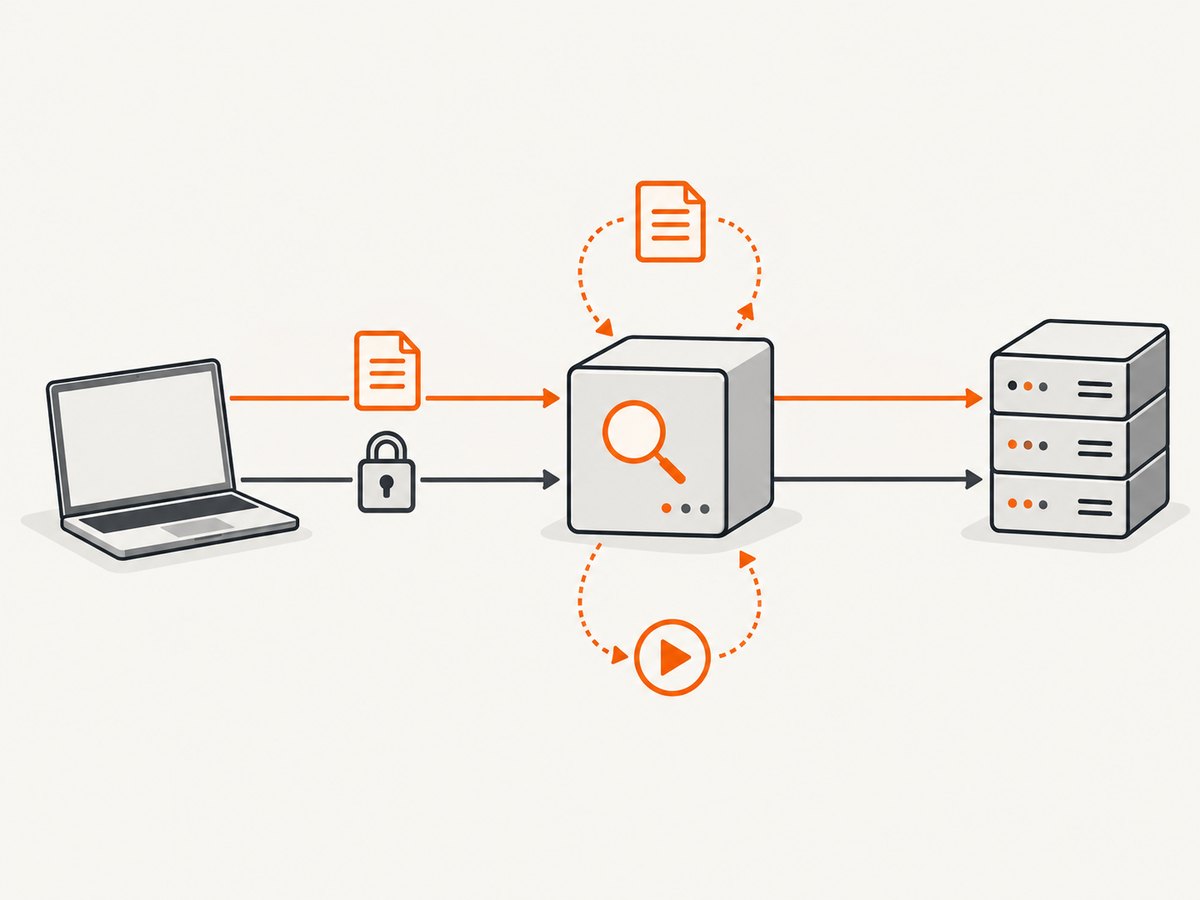
Use Postman when a team needs a GUI for authoring requests and occasionally needs to reproduce what a browser or local application sent. For capture, configure the source application to use the proxy, install the required certificate for HTTPS inspection, then generate traffic and filter the session history. Follow the Postman proxy documentation for the current setup.
3. mitmproxy console
mitmproxy is an interactive intercepting proxy for HTTP/1, HTTP/2, and WebSockets. It can intercept and modify requests and responses, save and replay conversations, and run Python scripts that change traffic. Its getting-started guide uses a local proxy and directs you to install the generated CA certificate before inspecting TLS traffic.
The console interface fits a developer who wants keyboard-driven inspection and the ability to pause or edit a flow. Start with the mitmproxy getting-started guide, route an authorized device or application through the listening host and port, and install the certificate only on systems you control.
4. mitmweb browser interface
mitmweb is mitmproxy’s browser-based interface. It exposes the same proxy-oriented concept through a web UI, which is useful when a team prefers visual flow inspection or when the terminal interface is too dense. The proxy still sees only traffic routed through it, and HTTPS inspection still depends on certificate trust and application behavior.
5. mitmdump for non-interactive capture
mitmdump is mitmproxy’s non-interactive output interface. It is suited to repeatable captures, log processing, and scripted transformations. Pair it with mitmproxy’s Python scripting support when a CI job or diagnostic harness needs to record or modify flows without a person clicking through a UI.
6. HTTPie Desktop
HTTPie documents a cross-platform desktop API testing client for REST, GraphQL, and HTTP APIs. It is a good fit when you want a friendly request-building workflow without adopting a proxy-first tool. Keep saved requests and environments organized around the API operations your team repeats.
HTTPie’s official desktop documentation is at httpie.io/docs/desktop. Verify current platform and plan details there before standardizing on it.
7. HTTPie CLI
HTTPie CLI is a terminal HTTP client for testing, debugging, and general interaction with APIs and HTTP servers. Its documentation covers HTTPS, proxies, authentication, JSON, uploads, and formatted output. It works well for a developer who wants readable command output, shell composition, or a request that can be committed to a script.
http GET https://api.example.com/users Authorization:'Bearer YOUR_TOKEN'
http POST https://api.example.com/users name=Ada email=ada@example.com
The commands above illustrate HTTPie syntax; replace the host and credentials with values from an API you are authorized to use. See the HTTPie CLI documentation for authentication, proxy, upload, and output options.
8. Insomnia collections
Kong describes Insomnia as an API design, debugging, and testing application. Collections hold requests, folders, environments, and optional OpenAPI specifications. The documentation lists HTTP, gRPC, GraphQL, and WebSockets among supported request types, and describes sending requests, running collections, and writing scripts.
Choose Insomnia when your API work spans more than simple REST calls or when an OpenAPI specification should sit beside executable requests. Its collection documentation explains the current organization and execution model.
9. Bruno local-first collections
Bruno’s documentation describes a local-first API client with Git-native plain-text collections. It supports REST, GraphQL, gRPC, and WebSocket requests and documents command-line automation and CI/CD workflows. This makes it a natural candidate when reviews, branches, and pull requests should show request changes as files.
Use the Bruno product documentation to confirm the current CLI and IDE workflows. Treat local files as a collaboration model described by the vendor, not as an independent security guarantee.
10. OWASP ZAP API and proxy tooling
OWASP ZAP is primarily a web-application testing and proxy-oriented tool. Its API documentation describes an API UI available when proxying through ZAP or reaching the host and port where it listens. It belongs in a security-testing workflow where observing and assessing web traffic is central; it is not a direct replacement for every general-purpose API client.
Start with the ZAP API reference, then confirm the proxy configuration and scope for your test environment.
11. Postman proxy settings for outbound requests
Postman’s proxy settings deserve a separate workflow entry because sending a request through an upstream proxy is different from capturing another application’s traffic. Postman documents system proxy, proxy environment variables, and custom proxy settings. Use these controls when your network requires an egress proxy or when a test must originate from a particular network path. They do not automatically make Postman an observer of every other application.
Read the current Postman proxy settings documentation before configuring credentials or bypass rules.
12. ScreenshotNeo for automated page images
ScreenshotNeo solves a related but different problem: returning a screenshot or PDF of a web page from one GET request. It is the first service to try when your workflow needs visual evidence, page previews, regression artifacts, or an image for an AI agent rather than raw HTTP traffic.

Its capture options include full-page screenshots with lazy images loaded, CSS-selector element capture, dark mode, twelve device presets plus custom viewports, retina scale, PDF paper size and margins, page ranges, custom CSS and JavaScript, clicks, selector or delay waits, network-idle waits, request and resource blocking, custom headers, cookies, user agents, Authorization, timezone, geolocation, transparent backgrounds, resizing, cache TTLs, signed image links, asynchronous jobs with signed webhooks, bulk capture for up to 100 URLs per call, a usage API, and an OpenAPI specification.
How to inspect HTTP or HTTPS traffic safely
- Define the exact application, device, hostnames, and time window you are authorized to inspect.
- Pick a proxy interface: mitmproxy for interactive console work, mitmweb for a browser UI, mitmdump for scripts, or ZAP for web-application testing.
- Start the local proxy and note its listening host and port.
- Configure the application or device to route traffic through that proxy.
- Install the proxy’s generated CA certificate where required for TLS inspection.
- Generate one known request and confirm that it appears before collecting a larger session.
- Save only the flows needed for debugging. Redact tokens, cookies, and personal data before sharing.
A proxy cannot decrypt traffic from every application. Certificate pinning, custom trust stores, encrypted tunnels, and applications that ignore system proxy settings can limit visibility. If no flow appears, first verify routing and bypass rules, then certificate trust, then whether the app uses a protocol the proxy supports.
Or skip the browser setup
If the deliverable is a page image or PDF, call ScreenshotNeo directly. The ScreenshotNeo documentation lists all options and parameter names; familiar names used by other screenshot APIs also work.
curl -G 'https://api.screenshotneo.com/v1/shot' -d access_key=YOUR_API_KEY --data-urlencode 'url=https://stripe.com' -o shot.webpimport requests
r = requests.get('https://api.screenshotneo.com/v1/shot', params={'access_key': 'YOUR_API_KEY', 'url': 'https://stripe.com'}, timeout=90)
open('shot.webp', 'wb').write(r.content)const q = new URLSearchParams({ access_key: 'YOUR_API_KEY', url: 'https://stripe.com' });
const res = await fetch(`https://api.screenshotneo.com/v1/shot?${q}`);Cookie and consent banners, newsletter popups, and chat widgets are removed before the shot. Bot checks, blank pages, failed loads, timeouts, and cache hits are not billed; response headers identify the page verdict and whether the shot was billed. An MCP server provides take_screenshot, get_page_info, and capture_pdf for Claude, Cursor, and other MCP clients. The Free plan includes 1,000 screenshots each month with no card, and paid plans start at $5 for 3,000 shots. Create a free ScreenshotNeo account.
Request testing versus traffic inspection
| Question | API client | Debugging proxy |
|---|---|---|
| Who creates the request? | You, a saved collection, or a script | The observed application or device |
| What is the main artifact? | Request, response, assertion, or collection | Captured flow and any edits or replay |
| Must traffic be routed through a special port? | Usually no | Yes |
| Is a CA certificate normally needed? | No for ordinary API calls | Usually for HTTPS interception |
| Best automation shape | Collection runner, CLI, scripts, CI | Proxy scripts, dumps, replay, or test harnesses |
Reliability, performance, and cost considerations
- Repeatability: save environments, headers, cookies, and assertions with the collection or script. Record proxy version and certificate setup for reproducible captures.
- Latency: a proxy adds a network hop and TLS processing. Capture only the traffic needed for diagnosis, and avoid judging application latency from an instrumented path without a baseline.
- Data volume: WebSocket sessions, downloads, and long-lived streams can create large captures. Filter hosts and resource types, or use non-interactive output.
- Secrets: cookies, Authorization headers, and request bodies may contain credentials or personal data. Redact before exporting a collection or flow.
- Screenshot cost: ScreenshotNeo bills only clean shots. Failed loads, bot checks, blank pages, timeouts, and cache hits are free, and the
X-Page-VerdictandX-Billedheaders explain the result. Caching with a TTL you choose can avoid repeated captures. - Plan choice: ScreenshotNeo offers Free 1,000 shots/month, Starter $5 for 3,000, Growth $15 for 15,000, Pro $39 for 60,000, Scale $99 for 250,000, and Business $249 for 1,000,000. Yearly billing gives two months free, and every feature is on every plan.
Troubleshooting
No requests appear in the proxy
Confirm the application is configured to use the proxy host and port, check operating-system bypass rules, and generate a request to a known HTTP endpoint. Some applications ignore system proxy settings or use their own network stack.
HTTPS shows certificate errors
Install and trust the proxy’s generated CA certificate in the correct device or application trust store. Do this only for systems and traffic you own or are authorized to inspect. Certificate pinning can still block interception.
Only some domains are visible
Check proxy exclusions, alternate transports, pinned certificates, and whether the app opens a tunnel or uses a protocol outside the selected tool’s support. Compare with a request generated directly by an API client.
Replay does not match the original request
Dynamic cookies, timestamps, CSRF tokens, signed headers, and server-side state may have expired. Capture the prerequisite calls, refresh variables, and replay in the same order.
ScreenshotNeo returns an unexpected page
Use a selector wait, delay, or network-idle wait for client-rendered content. Add custom headers, cookies, user agent, timezone, or geolocation when the page requires them. Use blocking, custom CSS, or JavaScript to remove page-specific noise.
The screenshot response is not billed
Inspect X-Page-Verdict and X-Billed. Bot checks, blank pages, failed loads, timeouts, and cache hits are intentionally free.
FAQ
Is Postman an HTTP debugging proxy?
Its desktop app includes a built-in proxy for capturing configured HTTP and HTTPS traffic, but Postman is also a request authoring client. Choose the proxy mode only when you need traffic generated by another client.
Can a proxy inspect HTTPS everywhere?
No. The source application must route traffic through it and trust the proxy certificate. Pinning and other application constraints can prevent inspection.
Which tool is best for Git review?
Bruno is the documented fit among this list because its collections are local-first, Git-native plain text. Confirm current collaboration behavior before adopting it for a team.
Should I use a proxy to make screenshots?
No. A proxy captures network flows; ScreenshotNeo returns a rendered screenshot or PDF and removes common consent banners, popups, and chat widgets before capture.
Can AI agents use ScreenshotNeo?
Yes. Its MCP server exposes take_screenshot, get_page_info, and capture_pdf to Claude, Cursor, and other MCP clients.