Website Technology Detection
Learn how to identify a website’s likely tech stack with manual checks, detection tools, and automation—and how to judge the evidence.

Website technology detection means looking for public signals that suggest which software a site uses. You can inspect a page yourself, use a browser extension or domain lookup, or automate checks with an API. These methods identify likely technologies from fingerprints in pages and infrastructure; they do not reveal a guaranteed, complete inventory of a site’s architecture.
For a quick check, use a lookup or browser extension. For repeatable checks across many domains, use an API or bulk workflow. For an important conclusion, corroborate a detector’s result with direct evidence and describe it as evidence consistent with a technology—not proof that the whole site is built with it.
1. What technology detection can tell you
Detectors compare evidence exposed by a site with known signatures. Evidence can include HTML, DOM elements and properties, JavaScript variables, response headers, cookies, metadata, script URLs, DNS records, and other URL or resource patterns. A matching fingerprint is associated with a technology label.

That label describes what the detector observed. It does not establish how the private backend, deployment pipeline, or every page is configured. A page can reveal a frontend framework while exposing nothing conclusive about its database or hosting setup.
Wappalyzer’s open-source fingerprint system illustrates this approach: its patterns cover multiple kinds of page and infrastructure evidence, rather than relying on one telltale string. See the Wappalyzer patterns repository for the implementation and pattern schema.
Evidence has different strengths
| Evidence | What it may suggest | How to treat it |
|---|---|---|
| A distinctive script, asset path, or DOM feature | A specific library, service, or frontend tool may be active | Often more useful when the asset is loaded and used on multiple pages |
| A response header, cookie, or metadata value | A platform or service may be involved | Check whether the signal is current and specific |
| A page title, visual style, or generic HTML pattern | A broad possibility | Weak evidence on its own; many systems can produce similar output |
| A lookup result without visible evidence | A database has associated the domain with a technology | Check the scan date and seek another signal before relying on it |
2. Choose a detection method
| Your need | Good starting point | Trade-off |
|---|---|---|
| Inspect one site while browsing | Browser extension or single-domain lookup | Convenient and quick, but limited to public signals and the tool’s coverage |
| Check a domain against an existing database | Wappalyzer technology lookup or BuiltWith domain lookup | Fast results may be cached, stale, or incomplete |
| Research technology adoption across domains | BuiltWith technology trends | Useful for trend research; a domain-level association is not proof of current use on every page |
| Repeat checks or integrate detection into a workflow | An API or bulk lookup | Requires integration and attention to access plans, usage credits, and scan latency |
| Prioritize current evidence on one complex site | Live scan or deeper crawl, followed by manual checks | Can take longer and cost more credits; private or unexposed components remain invisible |
Wappalyzer recommends its lookup or browser extension for manual checks and its API for automation. Its API documentation describes cached lookups, live scans, recursive crawling, and asynchronous callbacks for deeper crawls; it says API lookup requires a Business plan. Confirm current access and pricing with Wappalyzer’s API documentation before building around it.
3. Inspect a site manually
Manual inspection is useful when you want to understand why a detector made a claim, or when you only need to investigate one site. Use the browser’s developer tools to inspect what the page actually serves.
- Open the site and the relevant page. A homepage may use different tools from a checkout, documentation area, or application subdomain. Start with the page that matters to your question.
- View the source and loaded resources. Look for script and stylesheet URLs, metadata, comments, recognizable asset paths, and framework-related markup. Treat names as clues: filenames can be customized, copied, or left behind.
- Inspect the live DOM. In developer tools, compare the parsed DOM with the original response. Client-rendered pages may add elements after initial HTML loads.
- Check response headers and cookies. The browser Network panel shows response headers for requests and cookies set by the site. A signal might identify a service, but a header can be removed, proxied, or shared by multiple products.
- Repeat on another relevant page. Check whether the same signature appears where you would expect the technology to operate.
- Corroborate before recording the result. Use a second evidence type or independent lookup when the answer matters. Note the page, evidence, and date.
Do not infer a full stack from one script or header. A loaded analytics tag, for example, can identify an analytics provider without telling you how the site was built.
4. Use a lookup or browser extension
For a one-off answer, a domain lookup or browser extension avoids manually checking every resource. Wappalyzer’s product pages describe lookup and browser-extension options. BuiltWith offers a domain lookup. Review the technologies shown and ask three questions:
- Does the result include a scan or observation date?
- Is there visible evidence you can verify on the pages you care about?
- Could the detected code be unused, left over, or present only on a subset of pages?
Database lookups trade some control and freshness for convenience. A result can reflect a cached observation. Older data is more likely to include a technology the site no longer uses, and an absent result does not establish that a technology is absent.
5. Automate detection with an API
When checking many domains or running recurring research, an API makes results easier to collect and compare. Before choosing one, confirm its authentication model, response fields, access plan, usage limits, freshness options, and whether deeper scans run synchronously or asynchronously.
Wappalyzer documents cached results and live scans. Cached data is faster; live scans aim for current results. Recursive crawling can take minutes, may run asynchronously, and can use more credits. Its denoise option excludes low-confidence detections by default; disabling denoising returns more matches but increases false-positive risk. Consult the API documentation for current request formats and options.
A practical API workflow
- Start with a small sample of domains and decide whether cached freshness is enough.
- Store the domain, scan time, scan mode, returned technologies, and any confidence or evidence fields the API provides.
- Use asynchronous callbacks for deep crawls if the provider supports them; avoid holding a client connection open for a long crawl.
- Retry transient network failures with a bounded delay, but avoid retrying authentication or invalid-input errors unchanged.
- Deduplicate domains and cache your own results for the interval appropriate to your use case.
- Inspect representative matches manually before using detections to make consequential decisions.
Do not build a workflow that treats a missing label as a definitive negative. Detection depends on the pages scanned, the signals exposed, and the provider’s fingerprints.
6. Account for accuracy and blind spots
False positives and stale results are possible. BuiltWith says its results come from automated analysis of publicly accessible website code and infrastructure, and identifies unused code, signatures left after removal, and indexing delays as possible sources of false positives. It does not guarantee absolute accuracy; see its terms and FAQ.
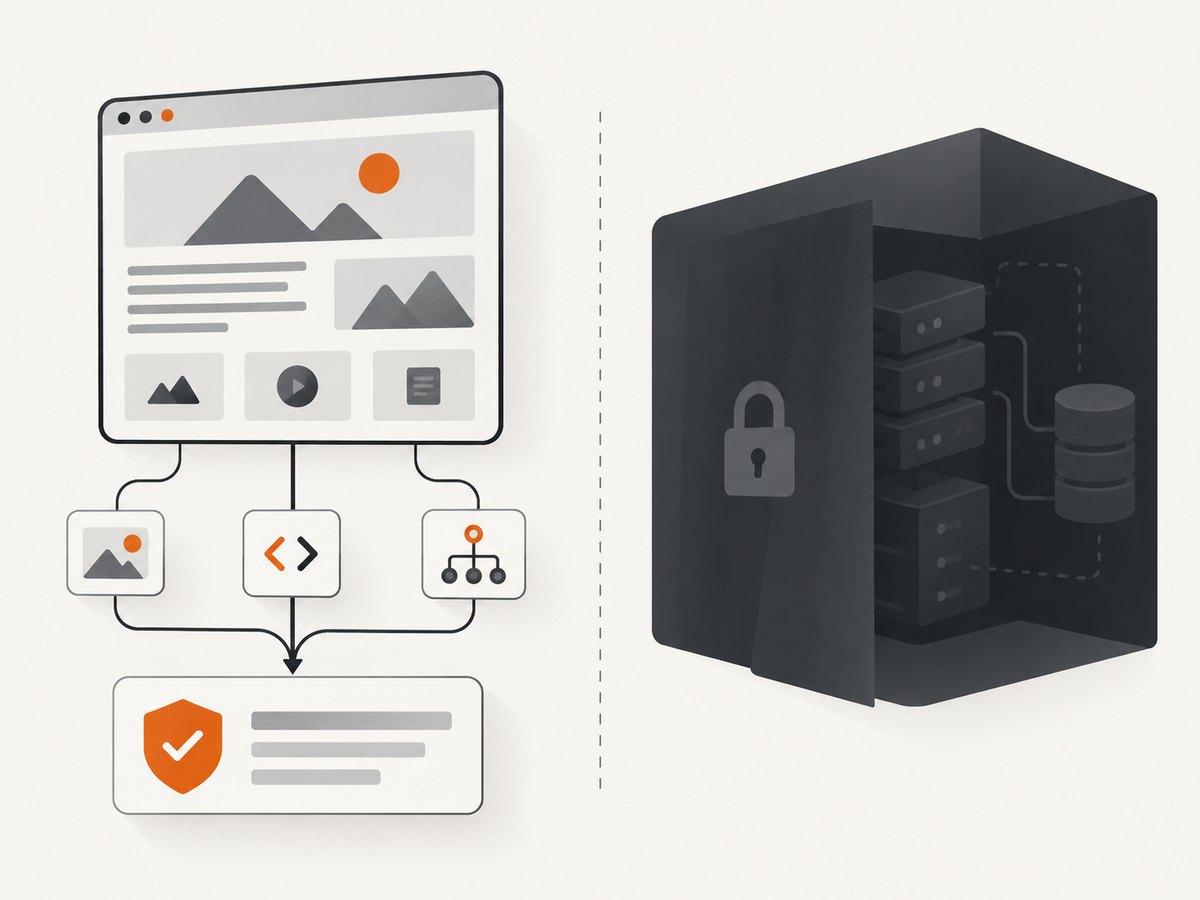
False negatives are possible too. A site may not expose a recognizable fingerprint, or the scanned page may not load the relevant component. The HTTP Archive’s 2024 Web Almanac methodology notes that headless ecommerce front ends can make platform detection challenging when the frontend does not expose the platform in the ordinary way. This is a limitation of public-signal detection, not proof that every detector misses every headless site.
When reporting a finding, use language such as: “The detector found evidence consistent with X on the pages it checked.” Avoid “the site is built entirely with X” unless you have independently verified that stronger claim.
7. A repeatable verification checklist
- Record the exact domain and page, including any subdomain that matters.
- Record when the result was collected and whether it came from a cached lookup or a live scan.
- Separate direct evidence (such as a loaded resource) from a database association or inference.
- Check more than one page if the technology may be used selectively.
- For important conclusions, corroborate with a second evidence type or source.
- Keep uncertain results marked as uncertain; do not turn “not detected” into “not present.”
- Recheck results before relying on them in a report, migration, security review, or market analysis.
8. Screenshot a page to inspect its visible output
A screenshot cannot identify a site’s entire technology stack. It can help document what a page visibly rendered at a particular point in an investigation—for example, when comparing two pages or keeping a visual record alongside your notes. For automated captures, ScreenshotNeo is a website screenshot API and MCP server for developers. Its API returns a screenshot or PDF from one GET request; it is useful for capturing the rendered page, while technology identification still depends on inspecting fingerprints and other evidence.
Or skip the browser setup
Use a capture call when you need a visual record without setting up a browser. The response can be a PNG, JPEG, WebP, or PDF; the example below saves the default image response. See the ScreenshotNeo API documentation for parameters.
curl -G "https://api.screenshotneo.com/v1/shot" -d access_key=YOUR_API_KEY --data-urlencode url=https://stripe.com -o shot.webpimport requests
r = requests.get(
"https://api.screenshotneo.com/v1/shot",
params={"access_key": "YOUR_API_KEY", "url": "https://stripe.com"},
timeout=90,
)
r.raise_for_status()
open("shot.webp", "wb").write(r.content)const q = new URLSearchParams({ access_key: 'YOUR_API_KEY', url: 'https://stripe.com' });
const res = await fetch(`https://api.screenshotneo.com/v1/shot?${q}`);
if (!res.ok) throw new Error(`Screenshot request failed: ${res.status}`);
const image = Buffer.from(await res.arrayBuffer());
await import('node:fs/promises').then(fs => fs.writeFile('shot.webp', image));ScreenshotNeo accepts cookie and consent banners like a visitor and removes more than 60 known consent platforms, newsletter popups, and chat widgets before capture; each step can be turned off. Bot checks or CAPTCHAs, blank pages, timeouts, failed loads, and cache hits cost nothing, and response headers say which page verdict and billing status applied. Its MCP server provides take_screenshot, get_page_info, and capture_pdf tools for Claude, Cursor, and other MCP clients. The free plan includes 1,000 screenshots a month with no card; paid plans start at $5 for 3,000.
Sign up free for 1,000 screenshots a month, no card required.
9. Troubleshooting
| Symptom | Likely cause | What to try |
|---|---|---|
| No technologies detected | The page exposes few recognized fingerprints, the scan failed to reach relevant pages, or the site uses a less detectable architecture | Check another relevant page, inspect resources manually, and try a live scan if available |
| A result seems outdated | The lookup may use cached or historical data, or a signature may remain after removal | Check the scan date, run a fresh scan where available, and verify the signal in the live page |
| A tool reports a technology you cannot see | The evidence may be on another page, be historical, or be a weak match | Inspect the specific page and evidence; use denoising or confidence filtering where available |
| Different tools disagree | They may use different fingerprints, crawl different pages, or have different data freshness | Compare scan dates and evidence types; treat agreement as corroboration, not proof |
| An API request is slow | A live scan or recursive crawl may take longer than a cached lookup | Use cached mode for quick checks, asynchronous handling for deep crawls, and bounded retries for transient errors |
| API access is denied | The account may lack the required plan or valid credentials | Check provider access requirements and authentication before retrying |
10. Performance, reliability, and cost
For one site, manual inspection or a lookup usually minimizes setup. For many sites, APIs reduce repetitive work but add integration, access, and usage considerations. Cached lookups favor speed and lower effort; live scans favor fresher evidence but can take longer. Recursive crawls add page coverage and may take minutes or require asynchronous handling, with higher credit use according to Wappalyzer’s API documentation.
Make an explicit freshness choice instead of rescanning everything constantly. Cache results with their timestamps, scan only domains that need updating, and limit crawl depth to the pages relevant to the question. For reliable automation, record failures separately from empty results: a failed scan is not evidence that the site has no detectable technology.
There is no verified detection-accuracy percentage that applies across tools and sites. Cost comparisons should use current provider plans and expected scan volume; API access requirements and prices can change. Treat cost as the sum of access, credits, deeper crawl usage, and the engineering effort needed to process results.
11. Frequently asked questions
Can I find out exactly what a website is built with?
Usually not from public detection alone. You can identify evidence consistent with exposed technologies, but private backend and build details may not be visible.
Does “not detected” mean the site does not use that technology?
No. The relevant fingerprint may be hidden, absent from the scanned page, or not recognized by that detector.
Why do two detection services give different answers?
They may scan at different times or pages, rely on different signatures, or report results with different confidence thresholds.
Can a screenshot show a site’s tech stack?
A screenshot records visible rendering. It does not expose the headers, scripts, cookies, and other signals needed to substantiate most technology detections.
How should I phrase an uncertain result?
State the evidence and scope: “The scan found a script associated with X on the homepage on this date.” That is more useful and accurate than claiming the entire site runs X.