Why html2canvas Cannot Capture Google Maps and Charts
html2canvas rebuilds DOM and CSS, so cross-origin map tiles and charts can disappear or taint the canvas. Learn the reliable fixes.

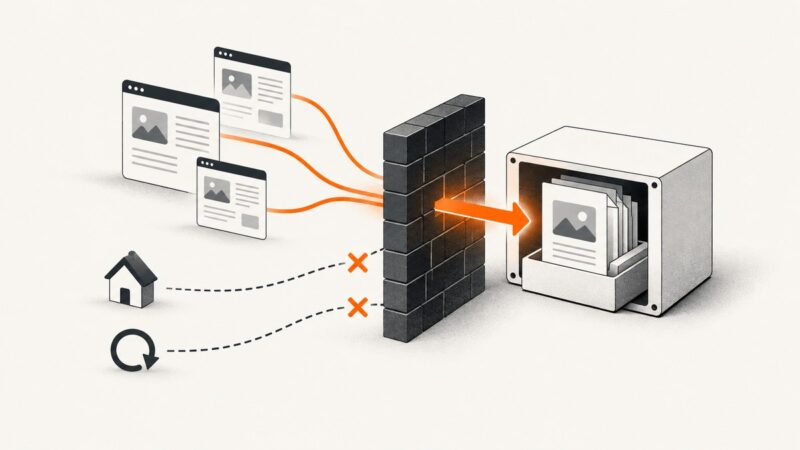
Direct answer: html2canvas cannot reliably capture Google Maps and some charts because it reconstructs a page from DOM and CSS instead of asking the browser for a native screenshot. A live Google Maps widget loads tiles, overlays, images, and frames from Google-controlled origins. Charts may be painted into a canvas, generated as SVG, or depend on external resources. Browser same-origin rules prevent html2canvas from reading many of those pixels. The result can be a missing map, a blank chart, clipped output, or a SecurityError when you call toDataURL().
That behavior is a browser security boundary, not a switch that html2canvas can override. You can sometimes solve a particular asset with CORS or a same-origin proxy, replace a live map with a Static API image, export a chart through its own API, or capture the page in a real browser with Playwright or Puppeteer. This guide explains which option fits each case and how to make the capture reliable.
1. What html2canvas actually does
html2canvas walks the target document, reads supported CSS properties, loads discoverable assets, and paints an approximation into a new canvas. Its documentation describes taking “screenshots” directly in the user’s browser, but the library is not the browser’s pixel capture pipeline. It does not receive the final composited surface that Chrome or Firefox displays.
This distinction matters for complex widgets:
- Only DOM nodes and CSS features implemented by html2canvas are reconstructed.
- Cross-origin images are skipped unless the response permits CORS.
- A canvas that contains cross-origin pixels becomes tainted, so script cannot read it.
- Cross-origin iframes cannot be inspected through
contentDocument. - Animations, tooltips, WebGL layers, plugins, and browser UI are not guaranteed to appear.
The library can therefore produce a useful report image for ordinary HTML while still failing on a map or chart that looks perfectly correct on screen.
2. Why Google Maps disappears
A Maps JavaScript widget is an application, not one image. It composes many map tiles and overlays, often from Google origins, and may place labels, markers, controls, and custom layers in separate elements or canvases. Your page’s origin is different from those resource origins.

When html2canvas encounters an image without an acceptable Access-Control-Allow-Origin response, its default behavior is to omit it. If that image has already been drawn into a canvas, the canvas is tainted. A tainted canvas can still be displayed, but browser code cannot safely extract its pixels.
Cross-origin frames are an even harder boundary: the parent page cannot read their document or draw their internal pixels. Setting allowTaint: true does not grant permission. It permits tainted content to remain in the rendered result, but calls such as canvas.toDataURL() and pixel reads can still fail with a security exception.
The common symptoms
- The map area is white or transparent while surrounding HTML appears.
- Markers or labels are missing even though some tiles render.
SecurityError: The operation is insecureappears attoDataURL().- The map is captured before tiles finish loading.
- A very large full-page canvas is blank or only partly rendered.
3. Why charts become blank or incomplete
“Chart” describes several rendering models. A chart can be a canvas drawing, inline SVG, an image, or a mixture with external fonts and icons. html2canvas supports only the DOM, CSS, and drawing features it understands. It does not replay every chart library’s rendering pipeline.
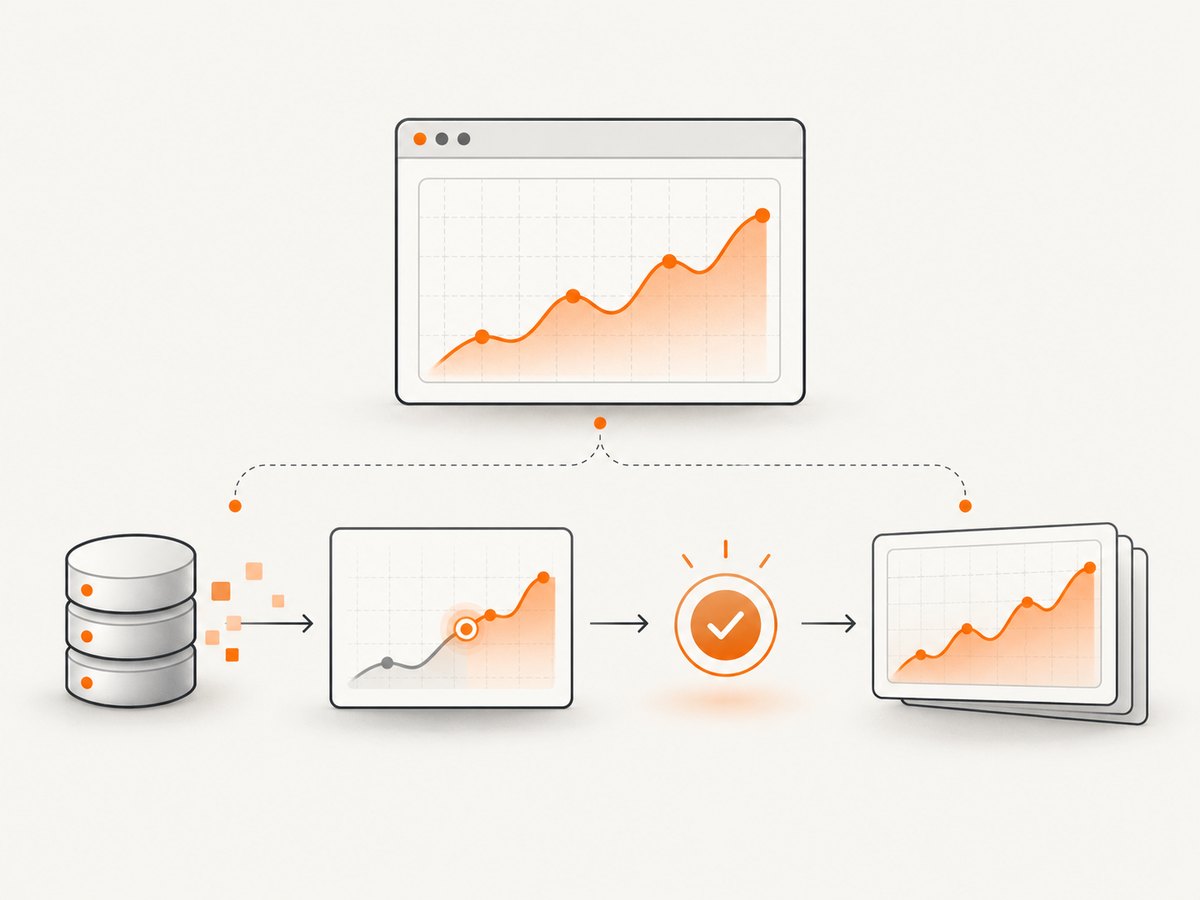
A chart can also be captured at the wrong time. If its data, fonts, SVG, or canvas drawing is still being created, html2canvas sees an empty or partial state. Tooltips and hover overlays may vanish because they are transient application state rather than ordinary DOM content.
For Google Charts, wait for the documented ready event and use the chart’s native export when possible. Google’s printing documentation exposes getImageURI() for supported Core Charts and GeoCharts. That method exports the chart state directly instead of asking a DOM reconstruction library to infer it.
4. A quick diagnosis checklist
- Open DevTools and identify whether the missing visual is an iframe, canvas, SVG, or image.
- Check the Network panel for the asset’s origin and its CORS response headers.
- Wait for the map tiles, chart data, fonts, and animations to settle before capture.
- Try a small element capture. If that works but full-page capture fails, inspect canvas dimensions and browser limits.
- Test export separately: call
toDataURL()in atry/catchand record the exact error. - Decide whether you need the live interactive state or only a static image of the map or chart.
5. Fixes when you control the assets
Enable CORS correctly
If you own the image server, return an Access-Control-Allow-Origin value that matches the requesting origin (or a deliberately chosen policy), then set useCORS: true. The option only tells html2canvas to request CORS; it cannot manufacture missing response headers.
import html2canvas from "html2canvas";

const node = document.querySelector("#report");
const canvas = await html2canvas(node, {
  useCORS: true,
  backgroundColor: "#ffffff",
  scale: Math.min(window.devicePixelRatio, 2),
  logging: true
});

document.querySelector("#output").src = canvas.toDataURL("image/png");
Every image still needs a server response that permits the browser request. Credentials, redirects, and a wildcard origin combined with credentials can require additional server configuration.
Use a same-origin proxy only with authorization
When you do not control an asset host, a security-reviewed proxy can fetch the asset and serve it from your origin. html2canvas has a proxy option for this pattern. Restrict accepted hosts, validate URLs, enforce size and time limits, and review privacy and terms requirements. A proxy changes who receives the request and must not become an open server-side request forgery endpoint.
const canvas = await html2canvas(document.querySelector("#map"), {
  proxy: "/image-proxy",
  useCORS: true,
  imageTimeout: 20000,
  scale: 1
});
Understand allowTaint
allowTaint: true allows html2canvas to draw content that may taint the output. It does not make pixel extraction safe. If you need a downloadable PNG, PDF, OCR input, or any pixel inspection, you still need CORS or a trusted proxy.
6. Replace a live Google Map with a Static API image
If the requirement is a map snapshot rather than panning, zooming, or tooltips, use the Google Maps Static API. It returns a GIF, PNG, or JPEG in response to an HTTP request. Embed that response as an ordinary <img>, then html2canvas only has to handle your own image element.
<img
  id="map-image"
  width="640"
  height="400"
  alt="Map showing the delivery area"
  src="https://maps.googleapis.com/maps/api/staticmap?center=40.741,-73.989&zoom=13&size=640x400&markers=40.741,-73.989&key=YOUR_MAPS_KEY">
Static output has tradeoffs: it does not preserve map interaction, live controls, hover behavior, or arbitrary application overlays. Authentication, billing, quotas, and Maps Platform terms apply. Keep the key restrictions and usage policy appropriate for your deployment.
7. Export Google Charts through their native API
For Google Charts, register a ready listener and call getImageURI() after the chart has rendered. The returned data URI can be placed in an image or downloaded.
google.visualization.events.addListener(chart, "ready", () => {
  const pngDataUri = chart.getImageURI();
  document.querySelector("#chart-export").src = pngDataUri;
});

chart.draw(data, options);
Use the method only for chart types and configurations that support it. If your library has a documented image-rendered chart type, that can be a better fit for server-side reports. Native export captures the defined chart state; it does not automatically include the surrounding dashboard, filters, or application chrome.
8. Capture the rendered page with Playwright or Puppeteer
When you need the browser’s final composition, run a real browser. Playwright and Puppeteer can wait for navigation, fonts, network activity, and application-specific selectors before calling the browser screenshot API. This approach can capture a live map view more faithfully than DOM reconstruction, subject to the target site’s access controls and your permission to automate it.
import { chromium } from "playwright";

const browser = await chromium.launch();
const page = await browser.newPage({ viewport: { width: 1440, height: 900 }, deviceScaleFactor: 2 });
await page.goto("https://example.test/dashboard", { waitUntil: "networkidle" });
await page.locator("#map").waitFor();
await page.waitForTimeout(1000); // allow tiles and chart animation to settle
await page.screenshot({ path: "dashboard.png", fullPage: true });
await browser.close();
For a chart, replace the timeout with a semantic readiness signal where possible:
await page.waitForFunction(() => window.dashboardChartReady === true);
await page.locator("#chart").screenshot({ path: "chart.png" });
Browser capture uses more memory and startup time than a client-side canvas, so reuse a browser process for batches, limit concurrency, and set explicit navigation and action timeouts.
9. html2canvas options that matter
| Option | Use | Limit |
|---|---|---|
useCORS |
Request cross-origin images with CORS. | The server must send compatible headers. |
proxy |
Load assets through an authorized same-origin proxy. | Creates privacy, security, and terms obligations. |
allowTaint |
Allow potentially tainting resources to be drawn. | Pixel reads and toDataURL() may fail. |
scale |
Control output resolution; defaults commonly follow device pixel ratio. | Higher values increase memory and canvas area. |
windowWidth/windowHeight |
Define the virtual viewport used for layout. | Does not grant access to cross-origin frames. |
width/height |
Set the output canvas dimensions. | Oversized canvases can fail or be clipped. |
backgroundColor |
Choose an opaque background or null for transparency. |
Transparency does not fix missing pixels. |
imageTimeout |
Bound waiting for image loads. | A short timeout can omit slow tiles. |
ignoreElements |
Exclude unstable controls, videos, or overlays. | Excluded content cannot appear in the result. |
onclone |
Modify the cloned document before painting. | It cannot bypass browser origin rules. |
10. Edge cases and reliability
Canvas size limits
Browsers impose maximum canvas dimensions and total pixel areas. A full-page capture at a high device scale can exceed those limits and produce a blank, truncated, or memory-heavy result. Capture sections, reduce scale, or use browser screenshots that can segment long pages.
Fonts and layout shifts
Wait for document.fonts.ready and for application data to finish. Otherwise text can reflow between the time html2canvas clones the page and the time it paints it.
await document.fonts.ready;
await new Promise(requestAnimationFrame);
const canvas = await html2canvas(document.querySelector("#report"));
Animations and lazy content
Pause CSS animations, scroll lazy regions into view, and wait for images before capture. A map that loads tiles only after intersection events may need a controlled scroll or a real browser automation step.
Privacy and authorization
Do not proxy or automate third-party pages unless you have permission. A proxy can expose cookies, query parameters, and private image URLs to another service. Keep credentials out of client-side capture code when the source requires authentication.
11. Troubleshooting common errors
| Symptom | Likely cause | Fix |
|---|---|---|
| Map is blank | Cross-origin tiles or iframe content were skipped. | Use Static API, authorized proxy/CORS, or Playwright/Puppeteer. |
SecurityError on export |
The canvas is tainted. | Remove non-CORS assets; allowTaint is not a bypass. |
| Chart is blank | Capture started before the chart ready event. | Wait for ready or a library-specific signal, then export natively. |
| Labels or icons missing | Unsupported SVG/CSS or external fonts. | Inline permitted assets, wait for fonts, or use native/browser capture. |
| Only part of the page appears | Canvas dimensions or viewport are too large. | Lower scale, capture sections, or use full-page browser screenshots. |
| Proxy request fails | Timeout, blocked host, redirect, or invalid proxy response. | Inspect server logs, allow the destination explicitly, and return correct image headers. |
| Screenshot differs from the screen | Interactive state, animation, or hover UI changed. | Freeze state and capture after a deterministic readiness check. |
12. Choosing the right approach
| Requirement | Best first option | Reason |
|---|---|---|
| Static map for a report | Maps Static API image | Returns a normal image without rasterizing a live widget. |
| PNG of a Google Chart | getImageURI() |
Uses the chart’s own renderer after it is ready. |
| Pixel-faithful dashboard | Playwright or Puppeteer | Captures the browser-composited page. |
| Simple same-origin HTML | html2canvas | Convenient when all assets are readable and supported. |
| Automated screenshots without browser setup | ScreenshotNeo | It handles capture options and returns an image or PDF through an API. |
13. Or skip the browser setup
ScreenshotNeo provides a website screenshot API and MCP server. One GET request returns a PNG, JPEG, WebP, or PDF, while options cover full-page capture, lazy images, CSS selectors, dark mode, device presets, retina scale, custom CSS and JavaScript, clicks, waits, blocked resources, headers, cookies, user agents, authorization, timezone, geolocation, resizing, caching, signed links, asynchronous jobs, bulk capture, and usage reporting. Its MCP tools let Claude, Cursor, and other MCP clients call take_screenshot, get_page_info, and capture_pdf.
Cookie and consent banners, newsletter popups, and chat widgets are removed before the shot. Bot checks, blank pages, failed loads, timeouts, and cache hits are not billed, and response headers identify the page verdict and billing result.
See the ScreenshotNeo API documentation for all parameters. A minimal call is:
curl -G "https://api.screenshotneo.com/v1/shot" -d access_key=YOUR_API_KEY --data-urlencode url=https://stripe.com -o shot.webpimport requests
r = requests.get("https://api.screenshotneo.com/v1/shot", params={"access_key": "YOUR_API_KEY", "url": "https://stripe.com"}, timeout=90)
open("shot.webp", "wb").write(r.content)const q = new URLSearchParams({ access_key: 'YOUR_API_KEY', url: 'https://stripe.com' }); const res = await fetch(`https://api.screenshotneo.com/v1/shot?${q}`);The Free plan includes 1,000 screenshots each month with no card. Paid plans start at $5 for 3,000 screenshots, and every feature is available on every plan. Create a free ScreenshotNeo account to try the API.
14. Performance and cost notes
- html2canvas runs in the user’s tab, so large DOM trees and high scales compete with application memory.
- Static map and native chart exports avoid reconstructing unrelated page content and are often simpler for reports.
- Playwright and Puppeteer add browser startup and memory costs; keep one browser process alive for batches and limit parallel pages.
- Proxies add network hops and transfer costs, and should cache only content you are authorized to store.
- ScreenshotNeo charges only for clean shots; bot checks, blank pages, failed loads, timeouts, and cache hits are not billed. Its cache TTL is configurable, which can reduce repeated work for unchanged URLs.
15. FAQ
Can I fix Google Maps with useCORS: true alone?
No. The tile server must send a compatible CORS header, and a live widget can also contain frames or layers that remain inaccessible.
Does allowTaint: true remove the security error?
No. It permits drawing tainting content but does not make pixel extraction or toDataURL() safe.
Should I use a screenshot API or Google Maps Static API?
Use Static API when you need a map image with controlled center, zoom, markers, or paths. Use a browser screenshot or screenshot API when you need the rendered page around the map.
Why does the chart work in the browser but not in my test?
Your test may capture before the chart’s ready event, use a different viewport, or run without the fonts and resources available in the interactive session.
Can html2canvas run in Node.js?
It expects browser globals and a document. For server-side work, use a real browser through Playwright or Puppeteer, or call a screenshot API.