Anti-Spam Controls for Website Monitoring Alerts
Reduce repetitive monitoring alerts without losing outage visibility. Tune detection, deduplicate incidents, silence maintenance, and verify the signal.
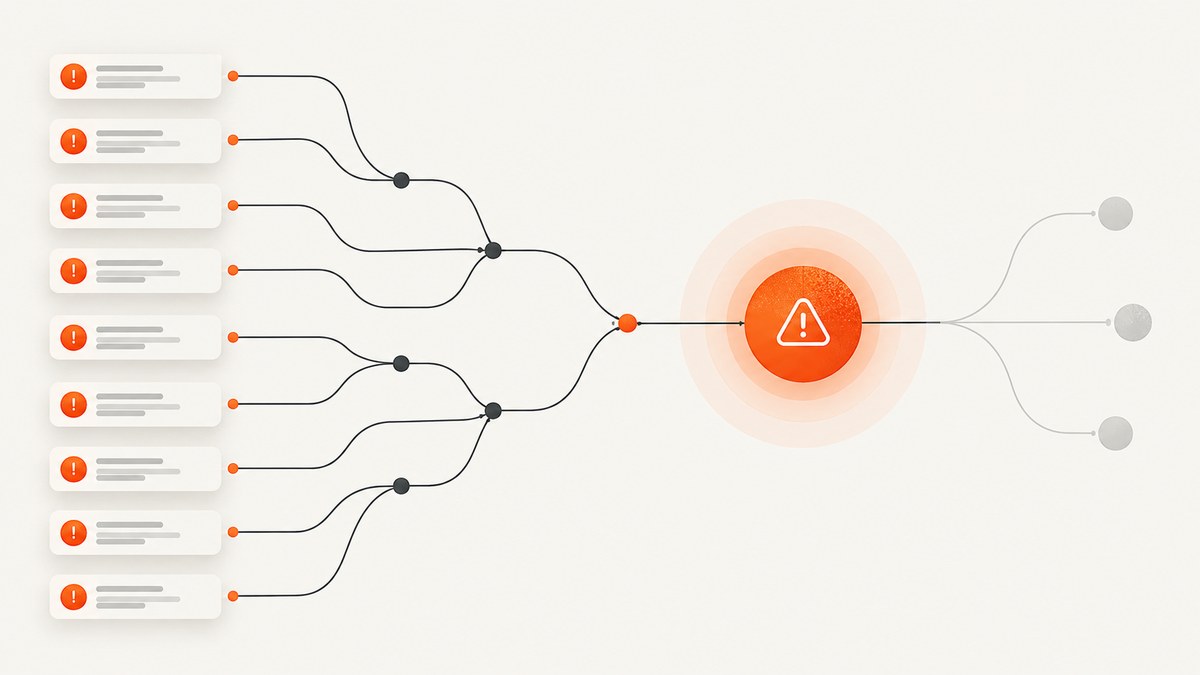
To reduce website-monitoring alert spam, first identify whether alerts come from a false detection, repeated messages for one incident, planned maintenance, or many related failures. Then use the control that acts at the right stage: tune the condition, deduplicate or group incidents, pause notification delivery during maintenance, or reduce repeat actions. Before keeping any change, review alert history and confirm genuine outages still trigger promptly.
These controls are not interchangeable. Some change whether a condition fires; others change whether an alert record exists, how alerts are grouped, or when notifications are sent. Check the behavior of your monitoring product before relying on terms such as “suppression.”
1. Diagnose what is generating the noise
Start with a recent noisy period. Compare the monitor state, alert records, notification history, and the underlying service metrics or probe results. Classify the noise before changing settings:
| What you see | Likely issue | First control to consider |
|---|---|---|
| One failed check followed by recovery | Transient probe failure or an overly sensitive condition | Tune the condition or require repeated evidence |
| Many messages with the same incident details | Repeated notification actions for one ongoing event | Adjust action frequency or send on state changes |
| Several related alerts from one service failure | One incident is fragmenting into separate alerts | Group related alerts or deduplicate stable event keys |
| Alerts during a scheduled deployment or maintenance window | Expected temporary event | Use a time-bounded notification pause if records should remain |
| A known-safe condition repeatedly creates unwanted records | Condition should be excluded from alert creation | Consider a narrow, documented exception |
Keep a short sample of alert IDs, timestamps, monitor names, state transitions, and delivery times. That evidence helps distinguish a noisy detector from a noisy notification rule. A lower message count by itself does not show that monitoring is working better.
2. Tune detection before muting messages
If the condition itself is too broad, fix it at the source. Check the threshold, measurement window, monitored endpoint, schedule, and failure criteria. A monitor that treats every single failed probe as an outage may react to transient network or origin issues that do not represent a sustained incident.
Require persistence where it fits
Where supported, require consecutive failed checks or a retest period before opening an alert. This filters brief blips while preserving detection of sustained failures. The right number of checks depends on probe frequency, the service’s failure mode, and how quickly the team must respond; there is no universal safe threshold.
Metric-based policies may evaluate data over an alignment period and a retest window. Google Cloud documents these evaluation concepts, while Webalert describes consecutive slow checks as a product-specific control. Treat these as examples of implementations, not settings that behave identically across vendors. Google Cloud’s metric alert behavior and Webalert’s documentation explain their respective models.
Set thresholds around the user-visible failure
- Alert on outcomes that matter, such as an unavailable page or sustained latency, rather than every low-level fluctuation.
- Check that the evaluation window matches the incident you intend to catch. A long window can delay detection; a very short one can magnify transient behavior.
- Confirm the monitor is checking the correct URL, expected response, and relevant region or service.
- Where the product offers flapping handling, decide whether repeated up/down transitions should generate a single flapping notification or individual transitions. This is vendor-specific; Webalert documents a flapping notification example.
3. Deduplicate repeated events and group related alerts
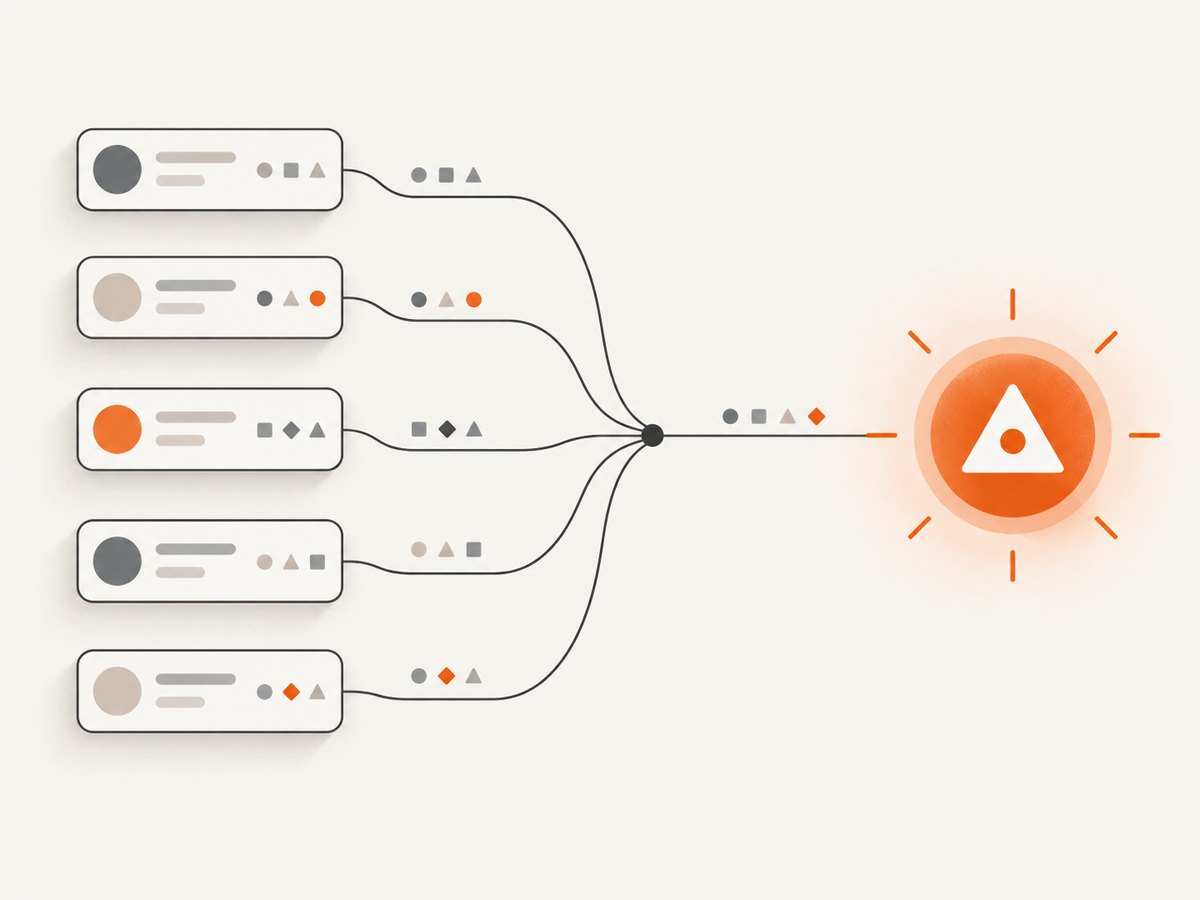
Deduplication addresses repeated reports of the same event. In PagerDuty, events with matching dedup_key values can append to one incident. Grouping can associate related alerts for triage. These mechanisms reduce fragmentation; they do not prove that the underlying alerts are false or stop the monitor from evaluating conditions. See PagerDuty Event Management and its alerts documentation.
Choose a stable key carefully
A useful deduplication key represents the identity of one incident class, such as a monitor plus the affected service or endpoint. It should remain the same for repeat reports of the same ongoing incident and differ for independent failures that need separate response.
Overly broad keys can collapse unrelated incidents. Overly specific keys, such as including a unique timestamp, can prevent repeats from matching at all. Before enabling a key broadly, inspect representative events and verify the expected grouping in incident history.
Use grouping when multiple signals describe one failure
Grouping is useful when several alerts arise from one likely cause, such as multiple checks failing during a shared dependency outage. Preserve the individual alert details where responders need them. Make sure grouping scope is understandable to the team and does not hide independent symptoms that require separate owners.
4. Silence planned maintenance without losing records
For planned work, a temporary notification pause is often preferable to changing the monitor permanently. Choose a control that pauses actions or delivery while checks continue and alert records remain available. Define a clear start and end, identify the affected monitors, and make someone responsible for restoring normal delivery.
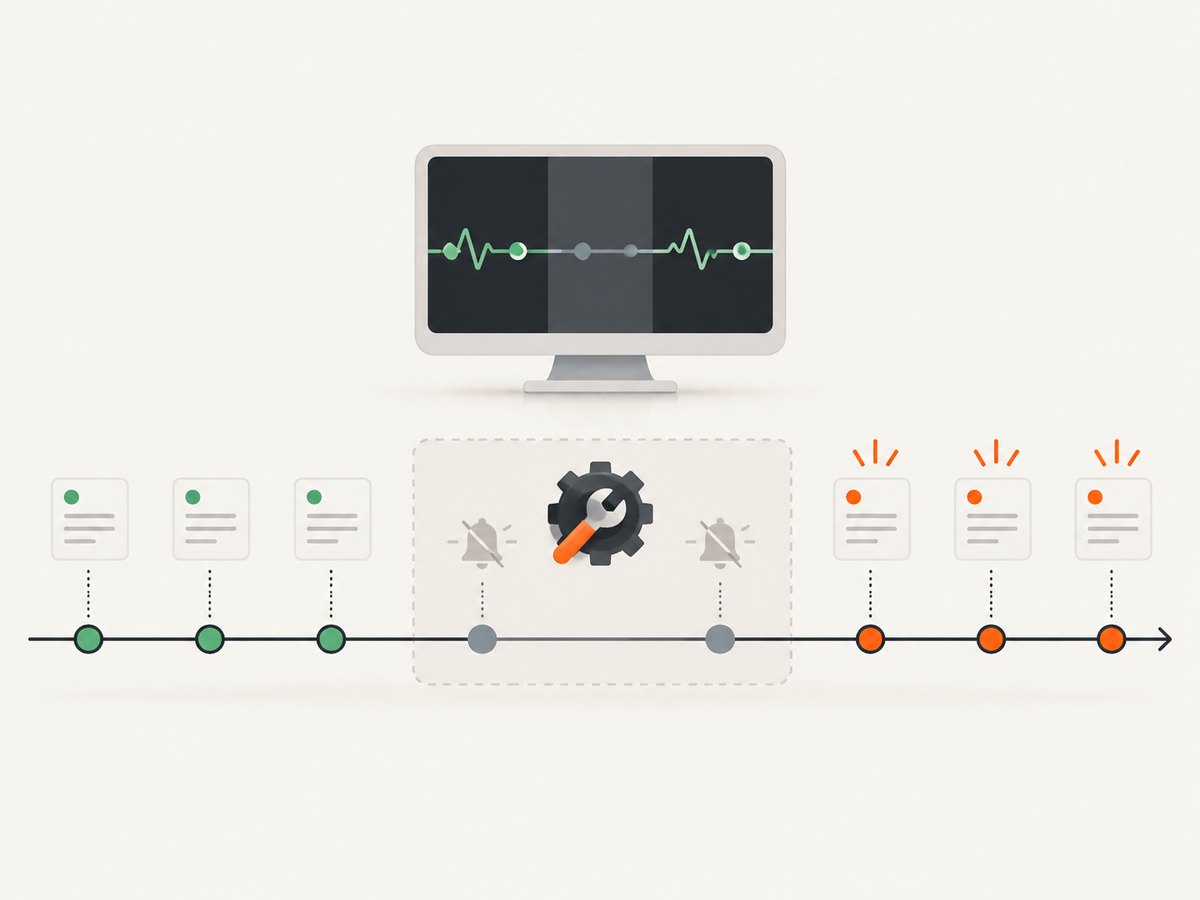
Elastic documents snoozing rule actions while alerts continue to be created and stored. Snoozes can expire or be canceled, and alerts created during the snooze remain available for review. This distinction matters: a maintenance silence can reduce interruptions without erasing the timeline. See Elastic’s guidance on reducing noise and Kibana rule management.
- List the services and monitors affected by the maintenance.
- Set a time-bounded pause at the narrowest available scope.
- Record who owns the pause and when it should end.
- During or after the work, review alert records for unexpected failures.
- Confirm normal notification delivery is active after the window.
Do not pause a shared policy if unrelated critical services depend on it unless the impact is understood. If the maintenance window changes, update or cancel the silence rather than assuming it will be remembered.
5. Use permanent exceptions only when records are not needed
An exception may prevent matching alert records from being created. That can be appropriate for a known-safe behavior that should never be treated as an alert, but it reduces audit and forensic visibility. Elastic distinguishes exceptions, which prevent matching alert records, from snoozing and suppression behavior that occurs after records exist. Product terminology varies, so verify the exact effect in your platform.
Keep exceptions narrow: specify the relevant rule, service, and condition; document the reason and owner; and set a review date if the exception may become stale. Avoid broad patterns that could match a real outage or conceal a newly changed behavior.
6. Reduce repeat notifications while keeping alert logic intact
When one ongoing alert sends messages too often, control notification actions rather than weakening the detector. Depending on the product, you may be able to send actions only when status changes, set a custom action interval, or send a periodic summary. Elastic documents these options for Kibana alerting rules.
Choose a cadence that gives responders enough information without repeating identical messages. For urgent incidents, preserve immediate initial notification and escalation behavior. For lower-priority conditions, a summary or less frequent reminder may be appropriate. Keep alert records and status transitions available even when delivery is less frequent.
7. Roll out changes and verify the signal
- Change one control at a time. Keep a note of the prior setting and the reason for the change.
- Use a limited scope first. Apply the adjustment to one monitor, rule, or team policy where possible.
- Review both records and messages. Confirm whether alert creation changed, notification delivery changed, or both.
- Check a real or safely simulated failure path. Verify that a sustained outage still produces an alert within the response time your team needs.
- Review after a representative period. Look for missed incidents, repeated alerts, stale silences, and unexpected grouping.
- Document ownership. Record exceptions, maintenance pauses, deduplication rules, and how to undo them.
Google Cloud’s documentation on managing alerting policies describes policy management and lifecycle considerations; use the documentation for the platform you run when confirming exact control behavior. Google Cloud: manage alerting policies.
8. Troubleshooting common alert-spam problems
| Symptom | Likely cause | What to check or change |
|---|---|---|
| Alerts continue after adding a deduplication key | Keys differ between repeated events, or the integration does not apply the key as expected | Compare the actual key on successive events; remove per-event values such as timestamps if they should represent one incident. |
| Unrelated failures now share one incident | Key or grouping scope is too broad | Add the service, endpoint, or other stable discriminator needed to separate independently actionable incidents. |
| Notifications stop, but alert records keep appearing | A snooze or action pause affects delivery rather than condition evaluation | Inspect alert history; this may be intended during maintenance. Confirm the pause has an end time. |
| Neither alerts nor records appear for a known condition | An exception or suppression may act before record creation | Review exception scope and product semantics; remove or narrow it if audit visibility is needed. |
| Real outages are detected too late | Persistence requirement or retest window is too long | Review check cadence, evaluation period, and the required response time; test the failure path after adjustment. |
| Up/down messages repeat during unstable recovery | The service is flapping or the condition crosses its threshold frequently | Review measurement stability and threshold logic; consider a vendor-specific flapping control or status-change actions. |
| Maintenance notifications resume too early or stay paused | Window timing, timezone, expiration, or cancellation was misunderstood | Check the configured timezone and end time, and inspect whether the snooze expired or was canceled. |
| Message volume fell, but responders cannot reconstruct events | Alerts were grouped, excluded, or records were not retained as expected | Inspect record retention before broadening the rule; prefer post-record delivery controls when the timeline matters. |
9. Performance, reliability, and cost considerations
Consecutive checks and longer evaluation windows can reduce reactions to transient observations, but they can also delay detection. More checks may increase probe or monitoring usage depending on the service’s pricing model; confirm the applicable product terms rather than assuming a universal cost effect. Grouping and deduplication mainly change incident organization, while notification intervals change message delivery. Exceptions can affect record retention. Evaluate each control at the stage it changes.
Reliability depends on preserving a path from a real sustained failure to a timely responder notification. Avoid tuning solely to minimize message counts. Track whether expected failures still create records, whether notifications reach the right team, and whether maintenance silences reliably expire. The cited vendor documentation describes product behavior; it is not comparative testing and provides no universal threshold or performance benchmark.
Or skip the browser setup
If your monitoring workflow also needs a clean screenshot of a page for an alert or incident record, ScreenshotNeo is a website screenshot API and MCP server. One GET request can return an image or PDF, and its API accepts common screenshot parameter names. It can remove cookie and consent banners, newsletter popups, and chat widgets before capture; each cleanup step can be turned off. Bot checks, blank pages, timeouts, failed loads, and cache hits are not billed, with response headers indicating the page verdict and billing status. An MCP server lets Claude, Cursor, and other MCP clients call screenshot tools. The free plan includes 1,000 screenshots a month with no card; paid plans start at $5 for 3,000. Every feature is on every plan. See the ScreenshotNeo API documentation.
curl -G "https://api.screenshotneo.com/v1/shot" -d access_key=YOUR_API_KEY --data-urlencode url=https://stripe.com -o shot.webpCreate a free ScreenshotNeo account for 1,000 screenshots a month, with no card.
FAQ
Does deduplication stop monitoring checks?
Usually it concerns event or incident handling, not whether a monitor evaluates its condition. Confirm the specific integration’s behavior.
Should I use a longer retest window for every monitor?
No. The appropriate window depends on probe cadence, failure impact, and response needs. A longer window can filter brief blips but delay detection.
Is a maintenance silence the same as an exception?
No. A silence is generally temporary and may preserve records; an exception can prevent matching records from being created. Verify the product’s exact semantics.
How can I tell whether an alert is false positive?
Compare its condition and timestamps with probe results, service metrics, and user-visible behavior. Review records and notification history after any tuning change.


