How to Attach a Remote Debugger to Headless Chrome in Selenium WebDriver
Launch headless Chrome with a DevTools port, attach Selenium through debuggerAddress, inspect the browser, and understand the commands that may not work.
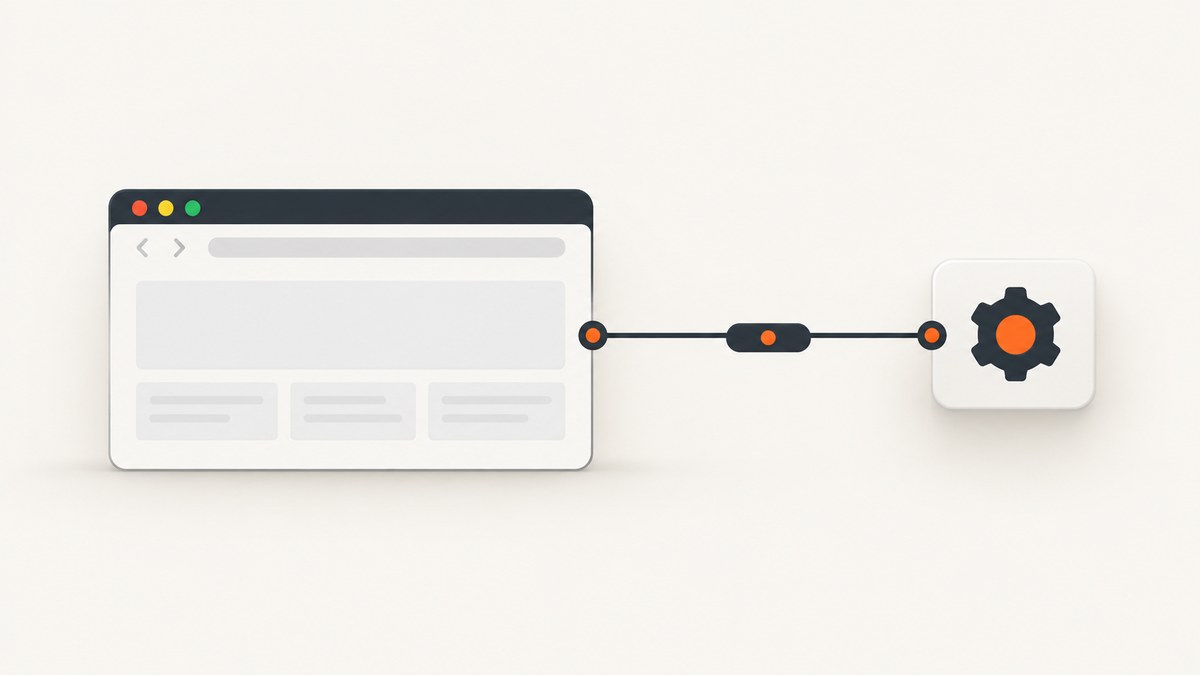
To attach Selenium WebDriver to an already running headless Chrome, start Chrome with remote debugging enabled, then configure ChromeDriver with the browser’s debugger address. For a local session, the address is commonly 127.0.0.1:9222. The key distinction is that ChromeDriver connects to the existing process instead of starting Chrome itself.
1. Start headless Chrome with remote debugging
Use a dedicated user data directory for this debug process. It keeps this instance’s profile separate from the profile used by your regular Chrome session and avoids profile-lock conflicts.
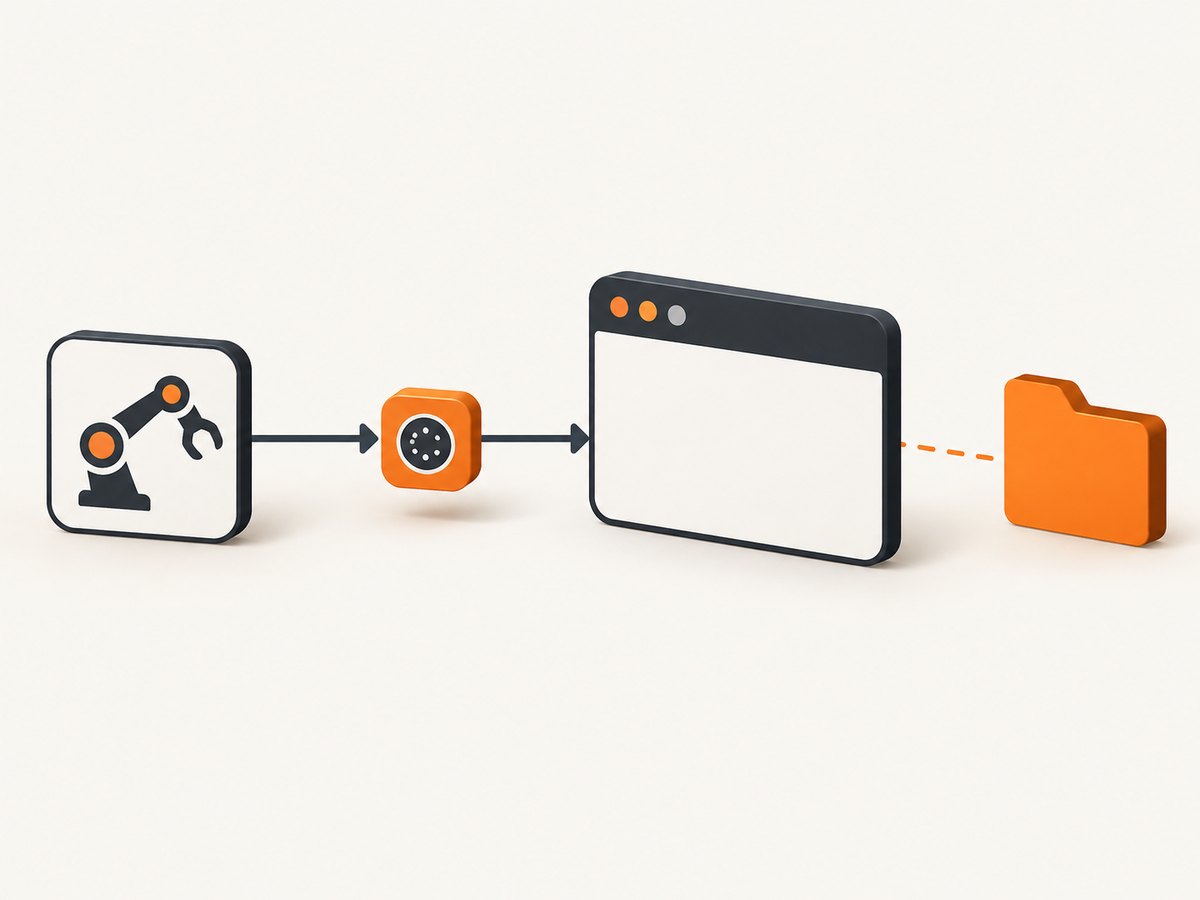
chrome --headless=new \
  --remote-debugging-port=9222 \
  --user-data-dir=/tmp/chrome-debug \
  https://example.com
Replace chrome with the path or executable name for Chrome on your system. The example uses a fixed port because it is easy to follow and reuse in local scripts. Chrome’s headless guidance uses --remote-debugging-port to expose a DevTools endpoint. [Chrome headless documentation]
Keep this process running while Selenium is attached. If the browser exits, the debugger endpoint disappears and WebDriver commands will fail. A fixed port is convenient for a single local browser, but concurrent test workers can collide if they all attempt to use 9222.
Use an automatically selected port for parallel sessions
Pass port 0 to let Chrome select an available port:
chrome --headless=new \
  --remote-debugging-port=0 \
  --user-data-dir=/tmp/chrome-debug-unique \
  https://example.com
With port zero, Chrome writes the chosen port and DevTools metadata to a DevToolsActivePort file in the user data directory. The browser’s /json/version endpoint also reports a webSocketDebuggerUrl. These are useful when a launcher needs to discover the endpoint instead of assuming a fixed port. [DevTools Protocol documentation]
For parallel workers, give each Chrome process its own user data directory as well as its own discovered endpoint. Do not have independent Chrome processes share one profile directory.
2. Attach Selenium Python using debuggerAddress
Install Selenium in the Python environment that will run the script:
python -m pip install seleniumThen connect ChromeDriver to the already running browser:
from selenium import webdriver
from selenium.webdriver.chrome.options import Options

options = Options()
options.add_experimental_option("debuggerAddress", "127.0.0.1:9222")

driver = webdriver.Chrome(options=options)
try:
    print("Title:", driver.title)
    print("URL:", driver.current_url)
    print("Page source length:", len(driver.page_source))
finally:
    driver.quit()
The debuggerAddress capability takes a hostname:port string. Selenium’s Chromium options API exposes the same setting as debugger_address in its Python interface. [ChromeDriver capabilities] [Selenium Chromium options API]
In this example, driver.quit() ends the WebDriver session. Because Chrome was launched separately, manage the Chrome process lifecycle separately too; do not assume quitting the attached WebDriver session will be the right way to stop every externally launched browser in your setup.
Wait for the page you need
Attaching can happen after Chrome has already loaded its initial URL. If you need to wait for a page condition, use an explicit wait rather than relying on a fixed sleep:
from selenium.webdriver.common.by import By
from selenium.webdriver.support import expected_conditions as EC
from selenium.webdriver.support.ui import WebDriverWait

wait = WebDriverWait(driver, 15)
heading = wait.until(
    EC.presence_of_element_located((By.TAG_NAME, "h1"))
)
print(heading.text)
The timeout should reflect the application’s expected behavior. If the page can legitimately take longer, handle the timeout explicitly and capture useful diagnostics such as the current URL and title before deciding whether to retry.
3. Inspect the headless browser
For visual inspection, use a regular Chrome window. Open chrome://inspect, choose Configure, enter the host and port for the headless browser, then select Inspect for its target. Chrome’s headless guide describes this workflow for viewing remote targets and their pages. [Chrome headless documentation]
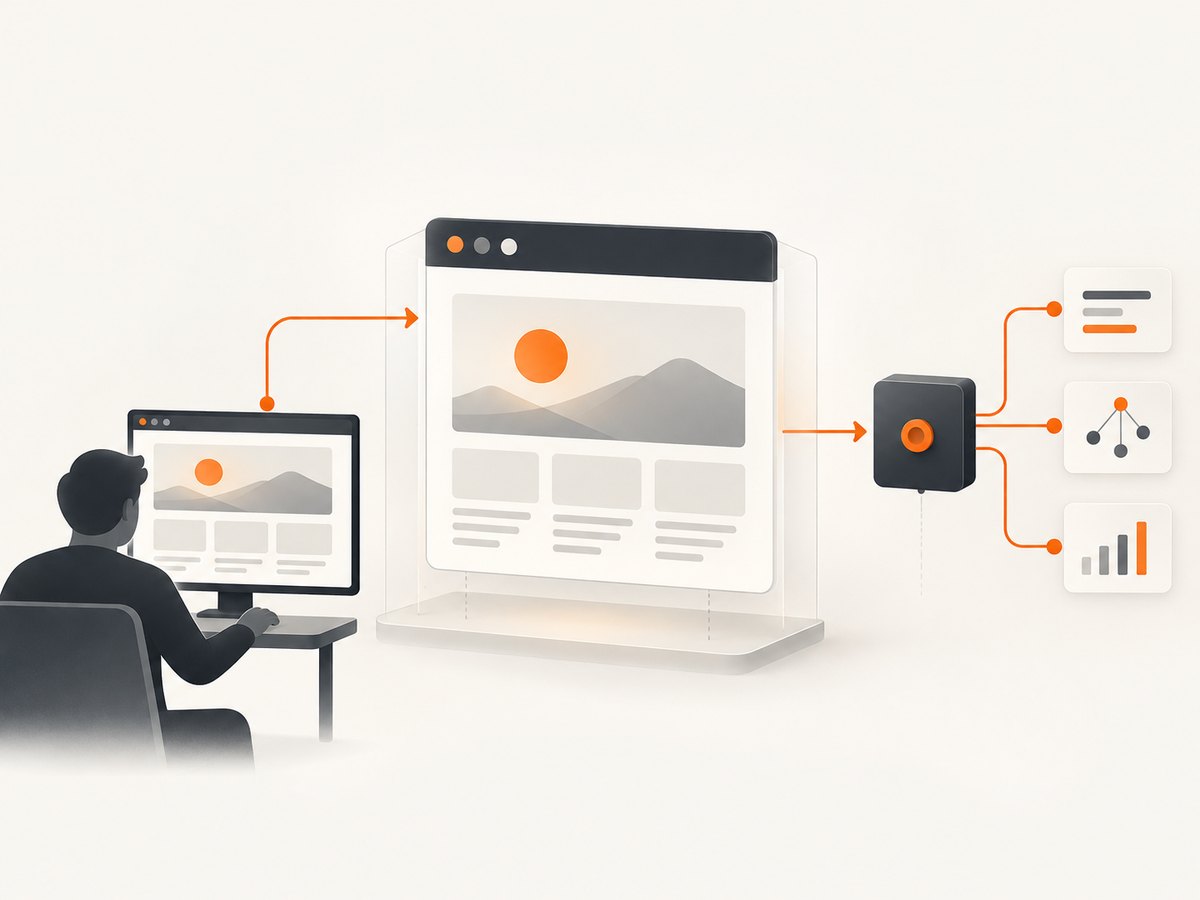
For programmatic inspection, Selenium Python provides driver.execute_cdp_cmd(command, args) for sending Chrome DevTools Protocol commands. For example, enable the Performance domain and read its metrics:
driver.execute_cdp_cmd("Performance.enable", {})
metrics = driver.execute_cdp_cmd("Performance.getMetrics", {})
for item in metrics["metrics"]:
    print(item["name"], item["value"])
CDP command names and parameters belong to the DevTools Protocol. Check the protocol documentation for the domain and command you want to use; do not assume every Chrome version supports an identical set of experimental commands. [DevTools Protocol reference]
4. Know what attaching changes
There are two different session models:
| Approach | Who starts Chrome? | Typical use |
|---|---|---|
| Selenium-launched | ChromeDriver starts Chrome | Automated tests that need the normal WebDriver startup behavior and broad command support |
| Pre-launched and attached | Your script, service, or operator starts Chrome; ChromeDriver connects through debuggerAddress |
Inspecting or controlling an existing browser process |
When ChromeDriver launches Chrome, it can load its automation extension during startup. When it attaches to a process that is already running, that startup step has passed. ChromeDriver documents that commands requiring the extension may be unavailable; resizing the browser window is one example, and can produce an “operation not supported when using remote debugging” error. If your workflow needs such a command, use a fresh Selenium-managed session without debuggerAddress. [ChromeDriver: troubleshooting Chrome startup and remote debugging]
Attaching is therefore useful when the browser process must exist first, but it is not a general way to adopt every Chrome instance while preserving all ChromeDriver startup features. Check the commands your test actually depends on before choosing this model.
5. Fixed port, ephemeral port, and endpoint discovery
| Choice | Advantages | Tradeoff |
|---|---|---|
| Fixed port such as 9222 | Simple configuration and easy manual connection | Can be occupied or reused accidentally; concurrent sessions need coordination |
| Port zero | Chrome picks an open port, reducing fixed-port collisions | Your launcher must read the selected port from DevToolsActivePort or discover the endpoint |
To inspect the browser’s metadata, request http://127.0.0.1:9222/json/version when using port 9222. The result includes the browser WebSocket endpoint. This URL is for discovering and using the DevTools protocol; Selenium’s ChromeDriver attachment capability expects the debugger server address in host:port form, not the WebSocket URL itself. The protocol documents the endpoint and port-zero behavior. [DevTools Protocol documentation]
6. Security and process reliability
A remote debugging port provides control over the browser. Treat it as a privileged interface. Bind and expose it only where intended, and protect it when the browser runs outside a trusted local machine. The endpoint mechanics in Chrome’s documentation do not define your deployment’s security policy, so choose network controls appropriate to the host and environment.
- Use an isolated user data directory for each debug process.
- Keep track of the Chrome process and terminate it through your process supervisor or launcher when the job is done.
- Do not reuse a fixed port across overlapping jobs without coordination.
- When connecting across hosts, use the address reachable from the ChromeDriver process and apply appropriate network restrictions.
- Record Chrome and ChromeDriver versions in diagnostics so compatibility issues are easier to identify.
Chrome and ChromeDriver behavior and flags can change over time. Verify the installed versions and consult current Chrome documentation when updating the headless launch command. Avoid treating a command copied from an older environment as a permanent compatibility guarantee.
7. Troubleshooting
| Symptom | Likely cause | Fix |
|---|---|---|
| ChromeDriver cannot connect to the debugger address | Chrome is not running, the port is wrong, or ChromeDriver cannot reach that host | Confirm the Chrome process is alive; request /json/version from the same machine/container as ChromeDriver; use the reported host and port. |
| Connection refused on 9222 | The browser was not launched with that port, failed to start, or selected another port | Review the launch arguments and startup logs. If using port zero, read DevToolsActivePort rather than hard-coding 9222. |
| “Operation not supported when using remote debugging” | The requested ChromeDriver operation depends on its automation extension, which was not loaded into the pre-existing Chrome process | Use a ChromeDriver-launched session for that workflow, or remove the unsupported operation. [ChromeDriver troubleshooting] |
| Profile is already in use or Chrome will not start | Another Chrome process holds the same user data directory | Choose a fresh, unique --user-data-dir for the debug instance and ensure no other process owns it. |
| The script connects but controls the wrong tab | The existing browser has multiple targets, or the initial tab differs from expectation | Inspect driver.current_url and enumerate driver.window_handles; switch to the intended handle before interacting. |
| Chrome starts but the expected page is blank or incomplete | The URL is still loading, navigation failed, or application content is rendered asynchronously | Check driver.current_url and browser logs, then wait for a meaningful DOM condition instead of a fixed short delay. |
| Session creation fails after a Chrome update | Chrome and ChromeDriver may be incompatible, or a flag/behavior changed | Check both versions and use the matching supported ChromeDriver setup. Reconfirm the current headless flags in Chrome’s documentation. |
debuggerAddress appears ignored |
The option was added under the wrong capability name or the supplied value includes a scheme/path | Use options.add_experimental_option("debuggerAddress", "127.0.0.1:9222") with only host and port. |
8. Performance, reliability, and cost
Attaching does not make page rendering faster by itself. It avoids launching a second browser only when a suitable Chrome process is already available; the page’s own loading, JavaScript, network, and resource costs still apply. In a test farm, measure the complete job path in your environment rather than assuming port choice or attachment produces a specific speedup.
For reliability, isolate profiles and ports, detect browser startup failures, and make cleanup explicit. With a fixed port, check for a stale or unrelated process before connecting. With an ephemeral port, ensure the launcher reliably reads the selected endpoint. If Chrome exits during the run, reconnecting to the same address will not restore the lost process; the supervisor must start a browser again.
The research sources provide no benchmark or numeric success rate for this procedure. Cost depends on the machine and infrastructure running Chrome, the duration of browser sessions, and the network and page workloads. There is no per-request price defined by Selenium or ChromeDriver in these instructions; account for your own compute and service costs.
9. Or skip the browser setup
If the job is simply to get a website screenshot, ScreenshotNeo offers a one-request screenshot API and an MCP server for AI agents. The call below returns an image response; see the ScreenshotNeo API documentation for request options and response details.
curl -G "https://api.screenshotneo.com/v1/shot" \
  -d access_key=YOUR_API_KEY \
  --data-urlencode url=https://example.com \
  -o shot.webp
import requests
r = requests.get(
"https://api.screenshotneo.com/v1/shot",
params={"access_key": "YOUR_API_KEY", "url": "https://example.com"},
timeout=90,
)
open("shot.webp", "wb").write(r.content)const q = new URLSearchParams({
access_key: 'YOUR_API_KEY',
url: 'https://example.com'
});
const res = await fetch(`https://api.screenshotneo.com/v1/shot?${q}`);
if (!res.ok) throw new Error(`Screenshot request failed: ${res.status}`);
const bytes = Buffer.from(await res.arrayBuffer());
await import('node:fs/promises').then(fs => fs.writeFile('shot.webp', bytes));ScreenshotNeo accepts cookie and consent banners before capture and removes more than 60 known consent platforms, newsletter popups, and chat widgets; each step can be turned off. Bot checks, blank pages, timeouts, failed loads, and cache hits are not billed, and response headers report the page verdict and billing status. Its MCP server includes take_screenshot, get_page_info, and capture_pdf for Claude, Cursor, and other MCP clients. The free plan includes 1,000 screenshots per month with no card; paid plans start at $5 for 3,000 shots. Sign up for 1,000 free screenshots a month, with no card required.
10. Frequently asked questions
Can I attach Selenium to Chrome that is already open?
Yes, if that Chrome process was started with remote debugging enabled. Set ChromeOptions’ debuggerAddress to its debugger host and port.
Can I attach to Chrome running on another machine?
ChromeDriver must be able to reach the debugger address. Use a reachable host and port and protect the remote debugging endpoint with suitable network controls.
Can I use this with headless Chrome?
Yes. Launch Chrome with a supported headless flag and remote debugging enabled. Check the current Chrome documentation for flags that match your installed version.
Should I use a fixed port or port zero?
Use a fixed port for a simple, single local session. Use port zero when you want Chrome to select a free port, and build endpoint discovery into the launcher.
Why can some Selenium commands fail after attaching?
ChromeDriver did not start the existing browser with its automation extension. Commands that depend on that startup extension may be unsupported in an attached session.


