How to Automate Screenshots for Marketing Reports
Build reliable marketing-report screenshots with dashboard schedules, analytics APIs, Playwright, or ScreenshotNeo, including code, troubleshooting, and cost guidance.

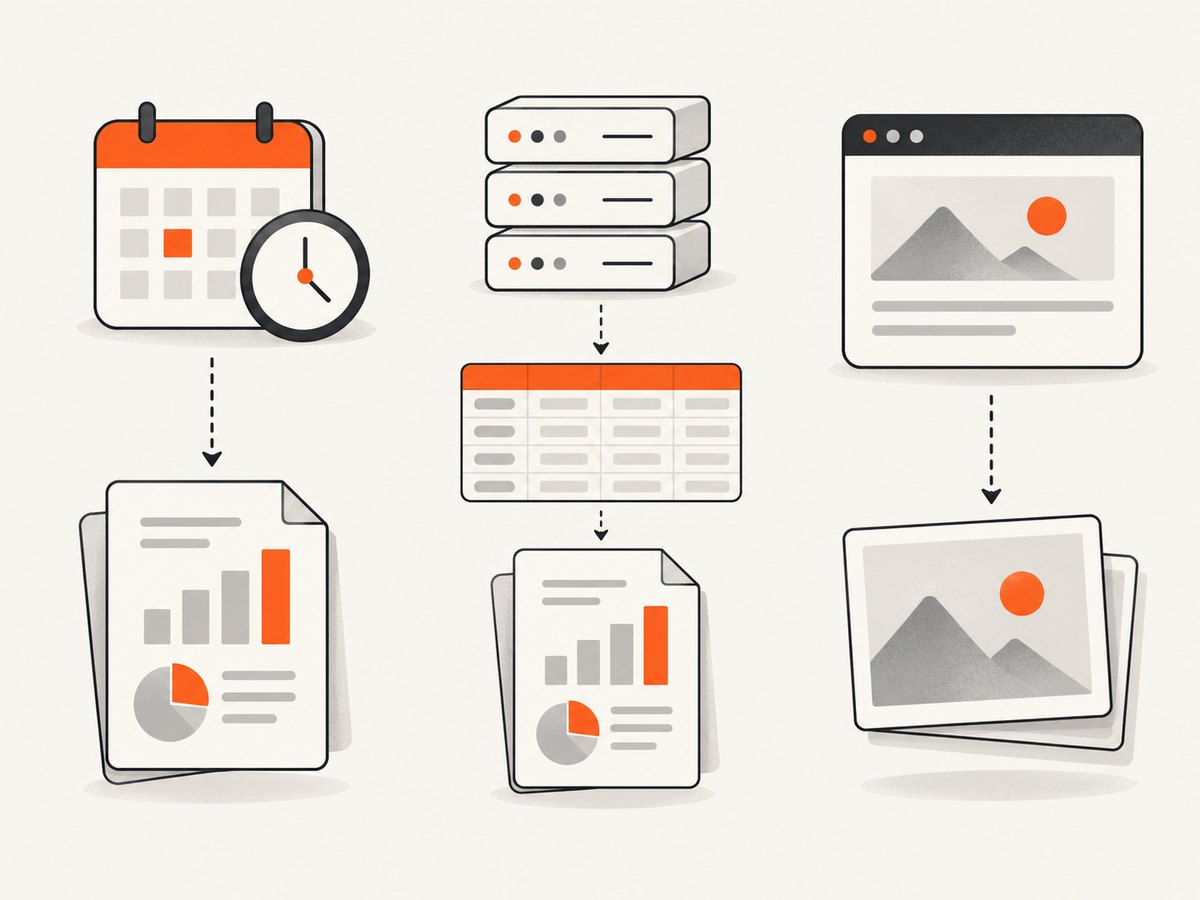
Automating screenshots for marketing reports starts with one decision: do you need structured metrics, a platform-generated PDF or image, or a literal picture of the rendered dashboard? Those outputs are different. Use native dashboard scheduling when the platform can deliver the required artifact. Use an analytics API when code must assemble the report data. Use browser automation when stakeholders require the page exactly as rendered.
This guide shows how to choose, implement, schedule, secure, monitor, and troubleshoot each approach. It includes runnable Playwright, cURL, Python, and Node.js examples, followed by a hosted option with ScreenshotNeo.
Choose the right automation approach
| Approach | Artifact | Best fit | Main maintenance |
|---|---|---|---|
| Native dashboard scheduling | Platform-rendered PDF or image | An existing BI dashboard already contains the approved layout | Permissions, filters, recipients, and platform schedule settings |
| Analytics API | Structured tables, JSON, CSV, or a custom document | You need to combine metrics, campaigns, and business rules in code | Authentication, pagination, schema changes, and report rendering |
| Browser automation | Literal screenshot of a rendered web page | The visual state itself is the deliverable, or no suitable export exists | Login, page readiness, dynamic content, browser versions, storage, and alerts |
Ask these questions before writing code:
- Is the required output a table that someone can filter, or a visual proof of what the dashboard showed?
- Which accounts, campaigns, date ranges, dimensions, metrics, and filters belong in each report?
- Who may view the report, and where can it be delivered: email, webhook, object storage, or an internal system?
- What should happen if data is stale, a filter is invalid, a login expires, or a page never finishes loading?
Option 1: schedule the dashboard natively
Native scheduling is usually the shortest path when the dashboard already has the right charts and filters. Looker documents recurring dashboard delivery, one-time Explore delivery, and datagroup-triggered delivery for supported recurring schedules. Depending on configuration and permissions, destinations include email, webhook, Amazon S3, and SFTP. A valid cache may be delivered; otherwise queries can run again. See the official scheduled-delivery documentation for current account requirements.
Configuration checklist
- Copy the dashboard and apply explicit account, campaign, date-range, and audience filters.
- Confirm every recipient has the intended visibility. Keep client and internal accounts separate.
- Choose PDF or image only after checking how charts, tables, and long pages render.
- Select a fixed recurrence or a data-refresh trigger when your account supports it.
- Choose the destination and retention policy. Make sure a webhook or storage bucket can authenticate the delivery.
- Run a test delivery and inspect the actual artifact, not only the schedule status.
Filters deserve special attention. Looker warns that scheduled content with filters that no longer work can expose unfiltered data. Treat a changed field, deleted campaign, or renamed value as a delivery failure that needs investigation, not as a harmless warning.
Option 2: assemble report data with an analytics API
Use an API when the report needs calculations or sources that are not represented by one dashboard. Google Analytics Data API’s runReport accepts a property, date range, dimensions, metrics, filters, and pagination, then returns report data rather than a screenshot. The official Data API guide documents the request model and authentication.
Design the data contract first
- Define the property or account for each client.
- Specify one or more date ranges, including the comparison period if needed.
- Choose dimensions such as date, source, medium, campaign, or landing page.
- Choose metrics such as sessions, users, conversions, or revenue.
- Write filters that fail closed when an account or campaign is missing.
- Plan for pagination and API quotas before adding more dimensions.
Keep the data step separate from the rendering step. Store the raw response with a report run ID, transform it into your canonical schema, then render HTML, PDF, or an image. This makes it possible to re-render a report without querying analytics again and gives you an audit trail when a number is questioned.
Example request shape
POST https://analyticsdata.googleapis.com/v1beta/properties/PROPERTY_ID:runReport
Authorization: Bearer ACCESS_TOKEN
Content-Type: application/json

{
  "dateRanges": [{"startDate": "30daysAgo", "endDate": "yesterday"}],
  "dimensions": [{"name": "date"}, {"name": "sessionDefaultChannelGroup"}],
  "metrics": [{"name": "sessions"}, {"name": "conversions"}],
  "limit": "10000",
  "offset": "0"
}
When the result has more rows than the limit, request the next page with an increased offset until all rows are collected. Validate totals against the dashboard your stakeholders already trust. API output can differ from a screenshot because the dashboard may apply hidden filters, calculated fields, sampling, or a different refresh time.
Option 3: capture the rendered dashboard with Playwright
Browser automation is the correct route when the image itself is required. Playwright documents page.screenshot(), including full-page capture. It does not provide a complete hosted, authenticated, scheduled marketing-report pipeline, so your implementation must handle credentials, readiness, scheduling, storage, and failure notification.
Install and run
mkdir marketing-capture
cd marketing-capture
npm init -y
npm install playwright
npx playwright install chromium
Create capture-report.mjs:
import { chromium } from 'playwright';

const url = process.env.REPORT_URL;
const output = process.env.OUTPUT_PATH || 'report.png';
const browser = await chromium.launch({ headless: true });
const context = await browser.newContext({
  viewport: { width: 1440, height: 1000 },
  deviceScaleFactor: 1
});
const page = await context.newPage();

try {
  await page.goto(url, { waitUntil: 'domcontentloaded', timeout: 90000 });
  await page.waitForLoadState('networkidle', { timeout: 90000 }).catch(() => {});
  await page.locator('[data-report-ready="true"]').waitFor({ timeout: 30000 });
  await page.screenshot({ path: output, fullPage: true, type: 'png' });
} finally {
  await browser.close();
}
Run it with:
REPORT_URL='https://dashboard.example.com/report' OUTPUT_PATH='client-a.png' node capture-report.mjsAdd a stable readiness marker to the report application after its data and charts have rendered:
<main data-report-ready="true">...</main>A fixed delay alone is fragile. Use a selector that represents completed content, then optionally allow a short delay for chart animation. For a dashboard without a readiness marker, wait for a known chart element and verify that its loading indicator is hidden.
Authentication choices
- Storage state: log in once in a controlled setup job and save Playwright storage state with restricted permissions. Load it only for the matching client.
- Environment credentials: use a service account or test user supplied through your secret manager. Never commit passwords or session cookies.
- HTTP headers: add an Authorization header only when the application supports it and the header is safe for every requested resource.
- Per-client contexts: create a new browser context for each client to prevent cookies, local storage, and filters leaking between reports.
Viewport, scope, and format
Use a fixed viewport so line wrapping and responsive breakpoints remain stable. Use fullPage: true for a long dashboard, or capture a specific report container when browser chrome and navigation are irrelevant. PNG preserves sharp text; JPEG is smaller for photographic content; WebP is often a practical web artifact. Record the viewport, browser version, URL, filter set, and capture timestamp beside each file.
Scheduling, storage, and failure handling
Run the capture from a scheduler such as your CI system, a cron job, or a managed job runner. The scheduler should create a unique run ID and write structured logs. Store the screenshot with a predictable key such as client/account/date/run-id.png; never overwrite the prior successful artifact before the new one passes validation.
Validate each output before delivery:
- File exists and has a nonzero size.
- Image dimensions match the expected viewport or full-page policy.
- A required heading, date label, or chart container exists before capture.
- The page does not show a login form, bot check, error panel, or empty state.
- The report’s date range matches the run configuration.
On failure, retain the browser console log, URL, run ID, and a diagnostic screenshot if it is safe to store. Retry transient navigation and network failures with exponential backoff, but do not repeatedly retry invalid credentials or a permanently missing selector. Send an alert containing the client, schedule, failure class, and last successful artifact.
Common errors and fixes
| Symptom | Likely cause | Fix |
|---|---|---|
| Screenshot contains a login page | Expired storage state or wrong account | Refresh authentication, isolate contexts, and assert a post-login selector. |
| Charts are blank | Capture occurred before data or fonts loaded | Wait for a report-ready selector, chart element, and required network state. |
Timeout on networkidle |
Analytics, ads, or live sockets keep connections open | Use a bounded timeout and a semantic readiness selector instead of waiting forever. |
| Mobile-looking layout | Viewport is below a responsive breakpoint | Set an explicit desktop viewport and device scale factor. |
| Full-page image is enormous | Unbounded dashboard height or repeated virtualized content | Capture a report container, paginate sections, or define a maximum report height. |
| Numbers differ from the dashboard | Different refresh time, filters, timezone, or API definition | Record configuration, compare query definitions, and capture only after the dashboard refresh completes. |
| Works locally, fails in CI | Missing browser binary, fonts, permissions, or environment variables | Install the pinned browser, include fonts, check secrets, and log browser and OS versions. |
| Recipient sees sensitive data | Incorrect filter or permission scope | Fail closed, test each client account, and review the final artifact before distribution. |
Performance, reliability, and cost considerations
Performance
Reuse an installed browser binary, but create isolated contexts per client. Avoid unnecessary third-party resources where your report does not depend on them. Capture only the required element when a full page is not needed. Full-page screenshots consume more memory as dashboard height grows, so split very long reports into sections.
Reliability
Data freshness, cache behavior, page readiness, filters, authentication, and alerts matter more than raw browser speed. Native schedules may use a valid cache or rerun queries. APIs provide structured responses but require pagination and schema validation. Browser captures depend on every visual resource being available at run time. Keep the last successful artifact and expose delivery status to the team.
Cost
Native scheduling costs are governed by the reporting platform and storage or delivery services. API workflows consume quotas and compute time. Browser workflows consume runner time, browser resources, storage, and maintenance effort. Estimate the number of clients, report pages, retries, and retention period before selecting an architecture.
Or skip the browser setup
ScreenshotNeo provides a website screenshot API and MCP server. A GET request returns PNG, JPEG, WebP, or PDF. The API accepts full-page capture with lazy images loaded, CSS element capture, dark mode, device presets or custom viewports, retina scale, custom CSS and JavaScript, clicks, selector or network-idle waits, request blocking, headers, cookies, user agents, Authorization, timezone, geolocation, transparent backgrounds, resizing, caching with a chosen TTL, signed links, asynchronous jobs with signed webhooks, bulk capture for up to 100 URLs per call, usage reporting, and an OpenAPI specification. The parameter names used by other screenshot APIs also work, which can simplify a migration.

Use the ScreenshotNeo API documentation for the current request options. A minimal call is:
curl -G "https://api.screenshotneo.com/v1/shot" -d access_key=YOUR_API_KEY --data-urlencode url=https://stripe.com -o shot.webpPython:
import requests

r = requests.get(
    "https://api.screenshotneo.com/v1/shot",
    params={"access_key": "YOUR_API_KEY", "url": "https://stripe.com"},
    timeout=90,
)
r.raise_for_status()
open("shot.webp", "wb").write(r.content)
Node.js:
const q = new URLSearchParams({ access_key: 'YOUR_API_KEY', url: 'https://stripe.com' });
const res = await fetch(`https://api.screenshotneo.com/v1/shot?${q}`);
if (!res.ok) throw new Error(`Screenshot failed: ${res.status}`);
const fs = await import('node:fs/promises');
await fs.writeFile('shot.webp', Buffer.from(await res.arrayBuffer()));
For marketing reports, the practical differences are specific: ScreenshotNeo accepts the cookie or consent banner like a visitor and removes more than 60 known consent platforms, newsletter popups, and chat widgets before capture; each step can be disabled. Bot checks, CAPTCHAs, blank pages, timeouts, failed loads, and cache hits cost nothing, and each response identifies the result with X-Page-Verdict and X-Billed headers. Its MCP server provides take_screenshot, get_page_info, and capture_pdf tools for Claude, Cursor, and other MCP clients.
The Free plan includes 1,000 shots per month with no card. Paid plans start at $5 for 3,000 shots; yearly billing gives two months free, and every feature is available on every plan. Create a free ScreenshotNeo account to start with 1,000 screenshots a month and no card.
Short FAQ
Should every marketing report be a screenshot?
No. Use structured API data when recipients need filtering or calculations. Use a screenshot when visual layout, annotations, or a rendered dashboard is the required evidence.
Is a scheduled PDF the same as a browser screenshot?
Not necessarily. A platform PDF is rendered by that platform and may use its cache and export rules. A browser screenshot captures the page state produced by a browser at run time.
How do I prevent one client’s data appearing in another client’s image?
Use separate credentials or browser contexts, explicit filters, fail-closed validation, and an artifact review step before delivery.
What should I monitor?
Monitor schedule execution, authentication, page readiness, output dimensions, file size, filter values, delivery status, and the last successful artifact.
When is ScreenshotNeo a good fit?
Use it when you need a hosted capture endpoint, cleanup of consent banners and overlays, no billing for failed or unusable captures, PDF or image output, bulk URLs, or MCP tools for AI-agent workflows.


