Automating Website Screenshots for IT and Software Monitoring
Automate browser screenshots for monitoring with Playwright or a hosted service. Learn what to capture, how to alert, and how to debug failures safely.
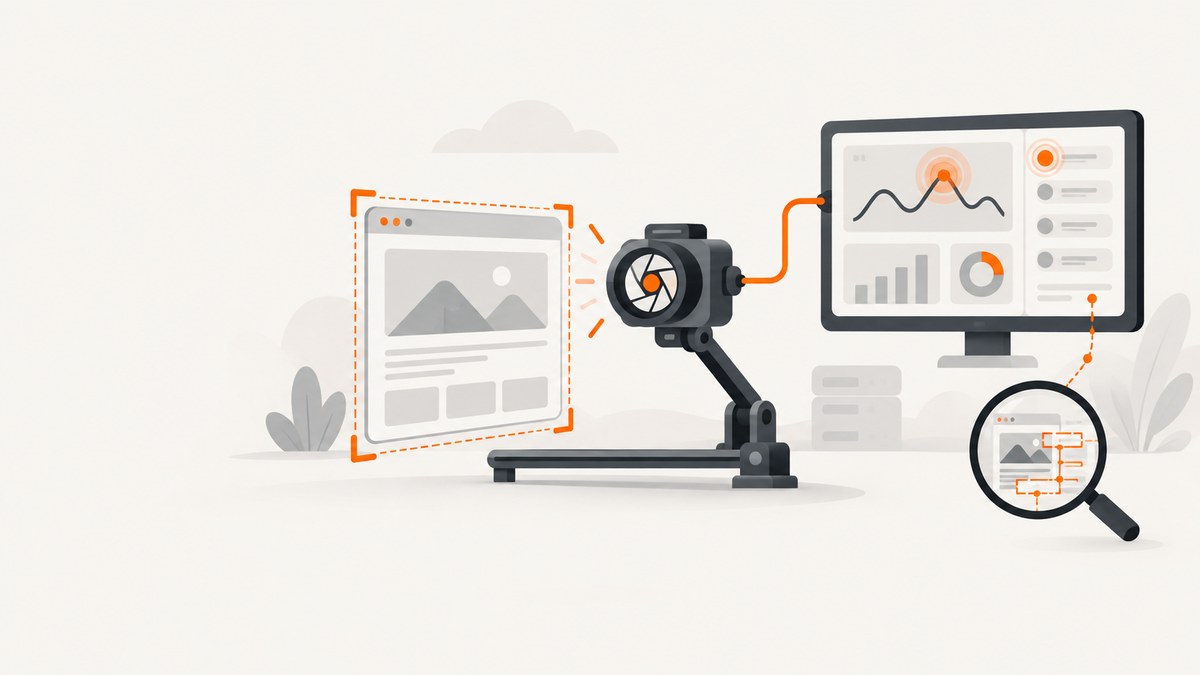
A screenshot records what a browser rendered at one moment. A monitor is the check that decides whether a page or user journey behaved as expected. For useful website screenshot monitoring, automate both: run a browser check on a schedule, assert meaningful outcomes, and save a screenshot and other debugging evidence when the check fails.
You can own that workflow with Playwright and a scheduler, or use a hosted browser-monitoring service to run checks and collect failure artifacts. A screenshot API is useful when you need an image of a URL; it does not replace a browser journey check with clicks and assertions. This guide builds a small Playwright check, explains how to operate it reliably, and covers when a hosted option makes more sense.
1. Decide what the screenshot is meant to prove
Start with the failure you want to detect. If the question is “did this endpoint respond?”, an HTTP check may be enough. If the question is “can a customer sign in, find a product, or submit a form?”, run a browser journey and assert its outcome. A successful response code cannot establish that client-side rendering or a multi-step journey works.
Treat the screenshot as evidence, not the pass/fail rule. A monitor should decide whether the page passed through assertions such as a visible heading, a URL change, or a confirmation message. Attach screenshots to failed assertions or compare them with a reviewed visual baseline. Playwright’s trace viewer can show a screenshot-bearing film strip and supports inspecting expected and actual images for visual-regression work (Playwright Trace Viewer).
- Endpoint check: Is a URL reachable and returning an expected response?
- Browser check: Did the rendered page and user journey behave as expected?
- Visual check: Did a selected page or element change from an accepted baseline?
These checks answer different questions. A screenshot alone can show a rendering problem, but it does not reliably identify every functional defect. Conversely, an assertion can fail while the page still looks plausible. Preserve enough context to investigate both.
2. Build a Playwright screenshot monitor
This example uses Playwright’s JavaScript API. It opens a page, checks a visible outcome, saves a screenshot on failure, and writes a trace that can be inspected after the run. The example uses a public URL; replace it with a stable page or a dedicated synthetic-monitoring route that your team controls.

Install and run
- Install a current Node.js release, create a project, and add Playwright.
- Install the browser binary used by your project.
- Save the script below as
monitor.mjs, then run it with Node.
npm init -y
npm install -D playwright
npx playwright install chromium
node monitor.mjs
import { chromium } from 'playwright';
import { mkdir } from 'node:fs/promises';
const target = process.env.MONITOR_URL ?? 'https://example.com';
const outputDir = process.env.ARTIFACT_DIR ?? 'artifacts';
const timeoutMs = Number(process.env.TIMEOUT_MS ?? 30000);
await mkdir(outputDir, { recursive: true });
const browser = await chromium.launch({ headless: true });
const context = await browser.newContext({
viewport: { width: 1440, height: 900 },
colorScheme: 'light',
});
const page = await context.newPage();
page.setDefaultTimeout(timeoutMs);
const tracePath = `${outputDir}/trace.zip`;
await context.tracing.start({ screenshots: true, snapshots: true, sources: true });
try {
const response = await page.goto(target, {
waitUntil: 'domcontentloaded',
timeout: timeoutMs,
});
if (!response || response.status() >= 400) {
throw new Error(`Unexpected navigation response: ${response?.status() ?? 'none'}`);
}
// Replace this with a stable, user-visible success condition for your service.
await page.getByRole('heading', { name: 'Example Domain' }).waitFor({ state: 'visible' });
await page.screenshot({ path: `${outputDir}/success.png`, fullPage: true });
console.log(`PASS ${target}`);
} catch (error) {
await page.screenshot({ path: `${outputDir}/failure.png`, fullPage: true }).catch(() => {});
console.error(`FAIL ${target}:`, error);
process.exitCode = 1;
} finally {
await context.tracing.stop({ path: tracePath }).catch(() => {});
await context.close();
await browser.close();
}The screenshot on success is optional; keeping only failure screenshots reduces storage and artifact volume. If the page fails before it renders, screenshot capture can fail too, which is why the example catches screenshot errors and still reports the original failure. The trace may contain page content and network details, so control access and retention accordingly.
Make the assertion representative
Replace the sample heading assertion with a condition that proves the monitored behavior. For a sign-in journey, use a dedicated synthetic account, fill the form, submit it, then wait for a stable authenticated-page landmark. Avoid assertions tied to volatile text such as rotating announcements, timestamps, or personalized recommendations unless those are the behavior under test.
For an end-to-end journey, add steps deliberately. Each extra action can expose more failures, but also adds runtime and another opportunity for intermittent behavior. Keep the check focused on a critical path; cover secondary flows with separate checks so one failure has a clear owner and meaning.
3. Schedule checks and collect evidence
Playwright automates the browser; a self-managed setup also needs an execution schedule and operations around the script. Run the command from a CI scheduler, a system scheduler, or an internal job runner. Store artifacts when checks fail, retain enough history to compare incidents, and route alerts to the team responsible for the monitored journey.
A production-ready run should account for:
- Cadence: choose an interval that detects problems quickly without generating unnecessary load or noise.
- Regions: decide whether one execution location is sufficient or whether regional failures matter to users.
- Artifacts: save screenshot, trace, and logs under a run identifier with a clear retention policy.
- Alerting: alert on actionable failures, group repeated failures, and define who owns the check.
- Credentials: inject secrets through the job environment or a secret manager; do not commit credentials to the repository.
- Cleanup: reset any state the journey creates so the next scheduled run starts predictably.
Playwright traces provide more diagnostic context than a screenshot alone. The trace viewer can expose actions and screenshots across the run; see the official trace viewer guide. Treat traces, screenshots, console output, and network information as potentially sensitive. They may contain account data or page content.
4. Control visual noise and production impact
Visual comparisons become more useful when runs are repeatable. Fix the viewport, browser version, color scheme, locale, and test identity. Prefer stable test data and pages with predictable content. If a third-party widget, animation, rotating banner, or live timestamp is irrelevant, disable or mask it in a controlled test environment where possible. Do not hide an element if its failure is what the monitor is meant to catch.
Settle on a clear page-ready condition. Waiting for every network connection to become idle can hang on analytics, streaming, or long polling. Waiting only for initial HTML can capture before a client-rendered view appears. A reliable check usually waits for a specific visible element or application state, with a bounded timeout, instead of relying on an arbitrary long delay.
Production journeys need safe test data. Use dedicated test identities, make actions repeatable, and clean up records or transactions the check creates. Checkly’s monitoring guidance also cautions that production test data needs planning (production monitoring guidance). Avoid sending real messages, placing real orders, or triggering irreversible actions as part of a routine check.
5. Choose self-managed Playwright or hosted monitoring
Self-managed Playwright gives the team control of the code and lets it fit into existing development and operations workflows. The team also operates the schedule, browser environment, artifact storage, alert routing, credential handling, and retention. That is a reasonable choice when those capabilities already exist and the team wants to own the check lifecycle.
A hosted browser-monitoring service can run browser checks on a schedule and associate failure evidence with a run. Checkly documents Playwright-based production checks and artifacts such as screenshots, traces, network details, and console logs (browser checks). Its monitoring-as-code page describes use of standard Playwright tests in a repository (monitoring as code). The service’s synthetic-monitoring page currently describes checks as often as every minute from 22+ locations; treat those as vendor-published limits and verify current details when selecting a plan (synthetic monitoring).
When comparing an approach or service, evaluate these points:
| Decision | Questions to answer |
|---|---|
| Scope | Do you need an endpoint response, one rendered URL, or a click-through journey with assertions? |
| Execution ownership | Who maintains browser versions, schedules, secrets, storage, and alert delivery? |
| Cadence and locations | How often can checks run, and from which regions? Confirm current limits. |
| Failure evidence | Are screenshots enough, or do you need traces, video, console logs, and network requests? |
| Noise control | Can you stabilize dynamic content and review visual baselines before treating differences as failures? |
| Production safety | Can the journey use dedicated data and safely reset changes after each run? |
| Workflow fit | Can checks live with application code, and can the right team receive actionable alerts? |
Hosted execution can reduce the amount of monitoring infrastructure your team operates, but it does not remove the need to design a meaningful journey or safe production data. A visual artifact helps explain a failure; ownership and alert policy determine whether anyone responds.
6. Or skip the browser setup
If you need a clean screenshot of a URL rather than a Playwright journey with assertions, ScreenshotNeo returns an image or PDF from one API request. See the ScreenshotNeo API documentation for request options. This cURL example saves a WebP capture:

curl -G "https://api.screenshotneo.com/v1/shot" -d access_key=YOUR_API_KEY --data-urlencode url=https://stripe.com -o shot.webpCookie banners and consent layers, newsletter popups, and chat widgets are removed before the shot; each cleanup step can be turned off. Bot checks, blank pages, timeouts, failed loads, and cache hits cost nothing, and response headers report the page verdict and billing status. An MCP server provides take_screenshot, get_page_info, and capture_pdf tools for Claude, Cursor, and other MCP clients. The free plan includes 1,000 screenshots per month with no card; paid plans start at $5 for 3,000 shots.
ScreenshotNeo is a screenshot API, not a substitute for the Playwright assertions and multi-step browser journey described above. Use it when the monitoring task needs a page image or PDF and you want the capture handled through an API.
Python
import requests

r = requests.get(
    "https://api.screenshotneo.com/v1/shot",
    params={"access_key": "YOUR_API_KEY", "url": "https://stripe.com"},
    timeout=90,
)
open("shot.webp", "wb").write(r.content)
Node.js
const q = new URLSearchParams({ access_key: 'YOUR_API_KEY', url: 'https://stripe.com' });
const res = await fetch(`https://api.screenshotneo.com/v1/shot?${q}`);
if (!res.ok) throw new Error(`Screenshot request failed: ${res.status}`);
await Bun.write('shot.webp', res);
For automated operations, check the response status and the X-Page-Verdict and X-Billed headers before interpreting the body as a paid screenshot. The API supports full-page or selector capture, device presets or custom viewports, dark mode, retina scale, custom CSS and JavaScript, waits, request blocking, custom headers and cookies, caching, signed public image links, asynchronous jobs, bulk requests, and PDF options. Review the docs for parameter names and format-specific settings.
For Playwright journeys, keep your checks and assertions. For straightforward captures, ScreenshotNeo removes cookie banners, popups, and chat widgets before the shot; bot checks, blank pages, and failed loads are never billed; its MCP server lets AI agents take screenshots; and 1,000 screenshots a month are free with no card, with paid plans starting at $5 for 3,000. Sign up for the free plan.
7. Troubleshooting common failures
| Symptom | Likely cause | Fix |
|---|---|---|
| Navigation timeout | The page is slow, waiting never completes, or long-lived requests prevent the chosen load condition from settling. | Set a bounded timeout, use a practical navigation milestone, then wait for a specific page landmark. Inspect the trace and network activity. |
| Element assertion times out | The selector is stale, content is conditional, or the page did not reach the expected state. | Prefer a user-facing role or stable test identifier. Confirm the expected state manually and inspect the screenshot or trace. |
| Screenshot differs every run | Dynamic content, fonts, animation, viewport, locale, or browser version changed. | Pin the environment and test data, wait for the relevant content, and mask only known irrelevant regions. Review baselines instead of accepting every change automatically. |
| Works locally, fails in scheduled job | The runner lacks a browser dependency, secret, network access, or the same environment configuration. | Install the required browser in the job, inject secrets, record browser and runner versions, and compare environment variables and outbound access. |
| Repeated alerts for one incident | Every scheduled failure is sent as a separate page, or the alert threshold is too sensitive. | Group alerts by check and incident, require an intentional failure policy, and define recovery notifications. |
| Check changes production data | The journey uses a shared account or omits cleanup. | Use a dedicated identity and repeatable data setup/teardown. Remove irreversible actions from routine checks. |
| Artifacts are missing | The script exited before saving, the runner discarded its workspace, or artifact upload was not configured. | Save artifacts in a known directory in a failure-safe block and configure the scheduler to retain and upload that directory even for failed jobs. |
8. Performance, reliability, and cost
Browser checks consume more time and compute than a simple HTTP request because they launch a browser and render a page. Keep the journey short, reuse setup where appropriate, and avoid capturing full-page images on every successful run if those artifacts are not useful. A tighter schedule increases the number of executions and can increase both service usage and operational noise; choose cadence based on how quickly the team needs to know and how much evidence it will review.
Reliability depends on stable assertions, bounded waits, safe test data, and a healthy runner. A single check can fail because of a website issue, a transient network problem, or an execution environment problem. Traces and logs help distinguish these cases. Set a retry policy carefully: retries can absorb transient failures, but treating a later pass as if no incident occurred can hide flakiness. Keep the initial failure visible in the run history.
Self-managed cost includes engineering time and whatever compute, storage, scheduling, and alerting resources your team uses. Hosted plans may bundle those pieces; compare included run frequency, locations, artifact retention, and concurrency against the workload. For a screenshot API, estimate captures per month and check how failed or cached outcomes are handled. ScreenshotNeo says only clean shots are billed and publishes a free tier plus paid tiers; consult its current pricing and docs before forecasting ongoing usage.
9. Frequently asked questions
Can Playwright be used as a synthetic monitor?
Yes. Playwright can automate a production browser journey and assert expected behavior. To operate it as a monitor, arrange recurring execution, artifact collection, alerting, secrets, and safe test data yourself or use a hosted monitoring runner.
Should every check save a screenshot?
No. Save failure screenshots by default when they help diagnose issues. Keep success captures when they support visual comparisons or an audit need; otherwise they add artifact volume without much diagnostic value.
Does a screenshot prove the site is healthy?
No. It proves only that an image was captured. Use assertions for the behavior you care about and interpret the image as supporting evidence.
Can I monitor a page without writing browser code?
For a URL capture, a screenshot API can return an image or PDF without you operating a browser. For interactions and pass/fail logic across a journey, use browser automation or a hosted browser-monitoring service.
How many locations should run a check?
Use locations that reflect the users or network paths you need to cover. Multiple locations can help distinguish a regional issue from a global one, but confirm provider limits and account for the additional runs.