Bar Graph Image Generator: Make, Export, and Automate Charts
Create a clear bar graph image from your data, choose the right export format, and automate reliable chart captures with practical workflows.
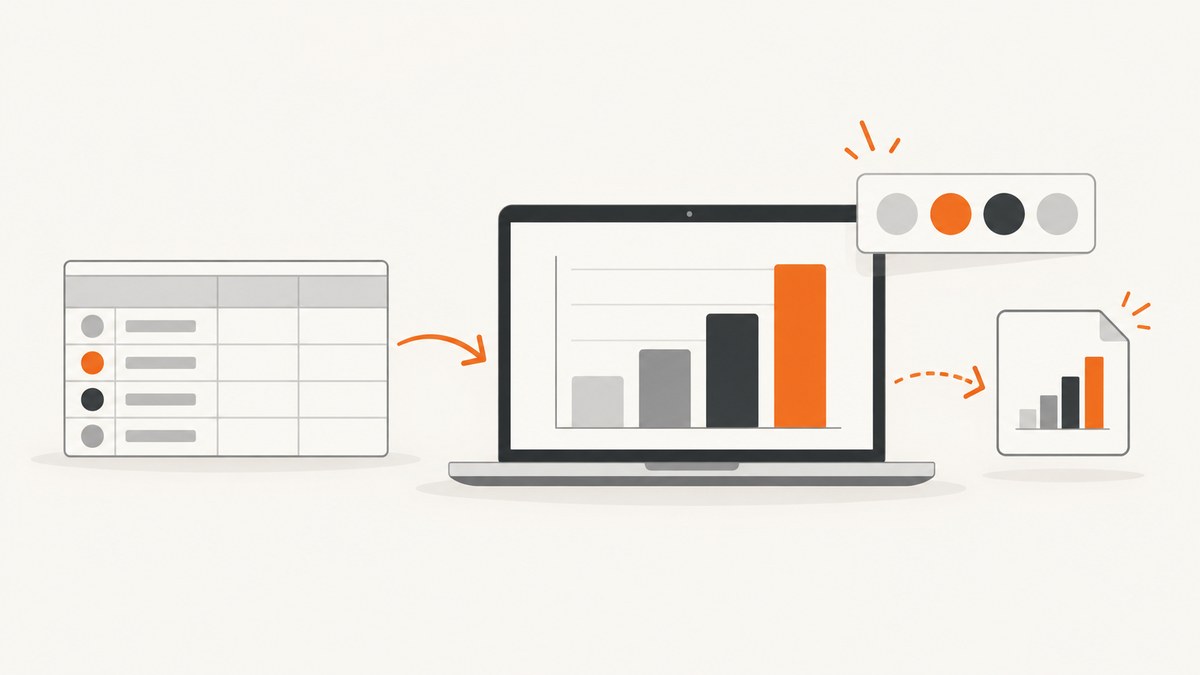
Direct answer: the best bar graph image generator depends on where your data lives and what you need to do with the result. Use Google Sheets when your values are already in a spreadsheet and you need a quick PNG, SVG, or PDF. Use Canva when the chart must fit into a designed report or social graphic. Use Flourish or Datawrapper when publishing, embedding, annotations, or accessibility controls matter. Choose the output format before you start: PNG is a practical raster image, SVG scales cleanly for editing and print, and PDF fits document workflows.
This guide shows how to turn category and value data into a dependable bar graph image, how to export it without blurry labels, how to handle accessibility and large datasets, and how to automate captures for a website or reporting pipeline.
What a bar graph image generator does
A bar graph image generator converts tabular data into a visual with categories on one axis and values on the other. A useful workflow has four stages:
- Prepare clean category and value columns.
- Choose a bar orientation and scale that make comparisons easy.
- Add title, labels, source, notes, and accessible descriptions.
- Export in the format required by the destination.
Decide whether you need a static file or an interactive chart. A static image works well in a slide, PDF, email, or CMS. An interactive embed can support tooltips, filtering, and responsive layouts, but it requires a publishing workflow and a live page.
Prepare data before generating the chart
Use a simple two-column structure
Put one category in each row and keep the numeric value in a separate column. For example:

Category,Value
North,42
South,67
East,31
West,54
Keep category names consistent, remove accidental spaces, and use real numbers rather than numbers stored as text. If values represent percentages, use one unit throughout and decide whether the axis should run from zero. For ordinary comparisons, a zero baseline prevents visual exaggeration.
Choose horizontal or vertical bars
- Horizontal bars: best for long category names or rankings.
- Vertical bars: useful for time periods and compact labels.
- Grouped bars: compare multiple series for each category.
- Stacked bars: show composition, but make individual segments harder to compare.
Sort bars deliberately. Descending order helps ranking stories; chronological order helps time series. Do not sort by accident after labels or annotations have been added.
Method 1: Generate a bar graph image in Google Sheets
Google Sheets is the fastest option when the data already exists in a spreadsheet. The official Google help page documents chart downloads in SVG, PNG, and PDF formats: Save or publish your chart.
- Enter category labels in column A and values in column B.
- Select the complete range, including headers.
- Choose Insert → Chart.
- In the Chart editor, choose Bar chart or Column chart.
- Set the title, axis titles, legend, colors, and data labels.
- Check the smallest labels at the final display size.
- Use the chart menu to download SVG, PNG, or PDF.
Google Sheets settings worth checking
- Set the horizontal axis minimum to zero for ordinary magnitude comparisons.
- Use data labels when readers need exact values.
- Limit decimal places to what the data supports.
- Use a legend only when there are multiple series.
- Write a descriptive chart title instead of repeating a column header.
For a report, PDF preserves a document-oriented workflow. For a web page or slide, PNG is usually the simplest handoff. SVG is preferable when a designer will resize or edit the chart.
Method 2: Create a designed bar graph in Canva
Canva’s graph maker combines chart creation with a broader design canvas. It is useful when the graph sits inside a poster, presentation page, social image, or branded report.
- Open a bar graph template or start a design with the required dimensions.
- Insert a bar chart element and open its data table.
- Paste category and value columns.
- Choose bar orientation, colors, spacing, and labels.
- Add context around the chart: title, source, date range, and a short takeaway.
- Download, print, or share the finished design in the format required by the destination.
Keep the chart itself readable. Decorative backgrounds, gradients, and low-contrast labels reduce the value of the data. If the image will be viewed on a phone, export at a size that leaves labels legible without zooming.
Method 3: Use Flourish for publishing and export
Flourish provides a chart-focused workflow for creating, publishing, embedding, and exporting visualizations. Its beginner guide covers creating a bar chart, adding data and labels, and exporting an image: Flourish fundamentals.
- Choose a bar chart template.
- Paste or upload your data.
- Map the category and value columns.
- Configure labels, colors, sorting, and annotations.
- Preview the chart at desktop and narrow widths.
- Publish or download according to the selected template.
Flourish’s image-download rules vary by template. Its help documentation says SVG download is available only for SVG-based templates, some templates have no image download, and image downloads are part of paid plans. Check the current image download options for the template you selected. When SVG is supported and the image will be printed or edited later, SVG is the safer choice.
Method 4: Build an annotated chart in Datawrapper
Datawrapper is designed for chart publishing and responsive embeds. Its feature overview covers static PNG export, PDF/SVG export, responsive design, color checking, and interactive embeds: Datawrapper features.
- Start a bar chart and import your data.
- Check category labels, values, and sorting.
- Use the annotation area for a title, description, notes, source, byline, and alternative description.
- Adjust colors and check contrast.
- Preview the chart at the width where it will appear.
- Export a static image or publish an embed.
Datawrapper’s bar-chart tutorial states that PNG is available to all users, while SVG and PDF are limited to Custom and Enterprise plans. Verify current access before committing to a production workflow: Customizing your bar chart.
Choose PNG, SVG, or PDF
| Format | Best for | Watch for |
|---|---|---|
| PNG | Web pages, slides, email, and social posts | Large resizing can make text soft |
| SVG | Print, design editing, and responsive scaling | Availability can depend on tool, template, or plan |
| Reports and document handoff | Check page size, margins, and embedded fonts |
Export at the final intended dimensions when possible. A high-resolution image cannot repair a chart whose labels are too small or whose contrast is poor.
Make the chart readable and accessible
- Use a title that states the subject, population, and period.
- Label axes with units such as dollars, users, or percent.
- Use color plus position or labels to distinguish series; do not rely on color alone.
- Keep contrast strong and avoid placing text over busy backgrounds.
- Add source and date information when the data may change.
- Provide an alternative description for screen readers. Datawrapper explicitly supports an alternative description in its annotation area.
- For a report, include the underlying data or a link to it so readers can verify exact values.
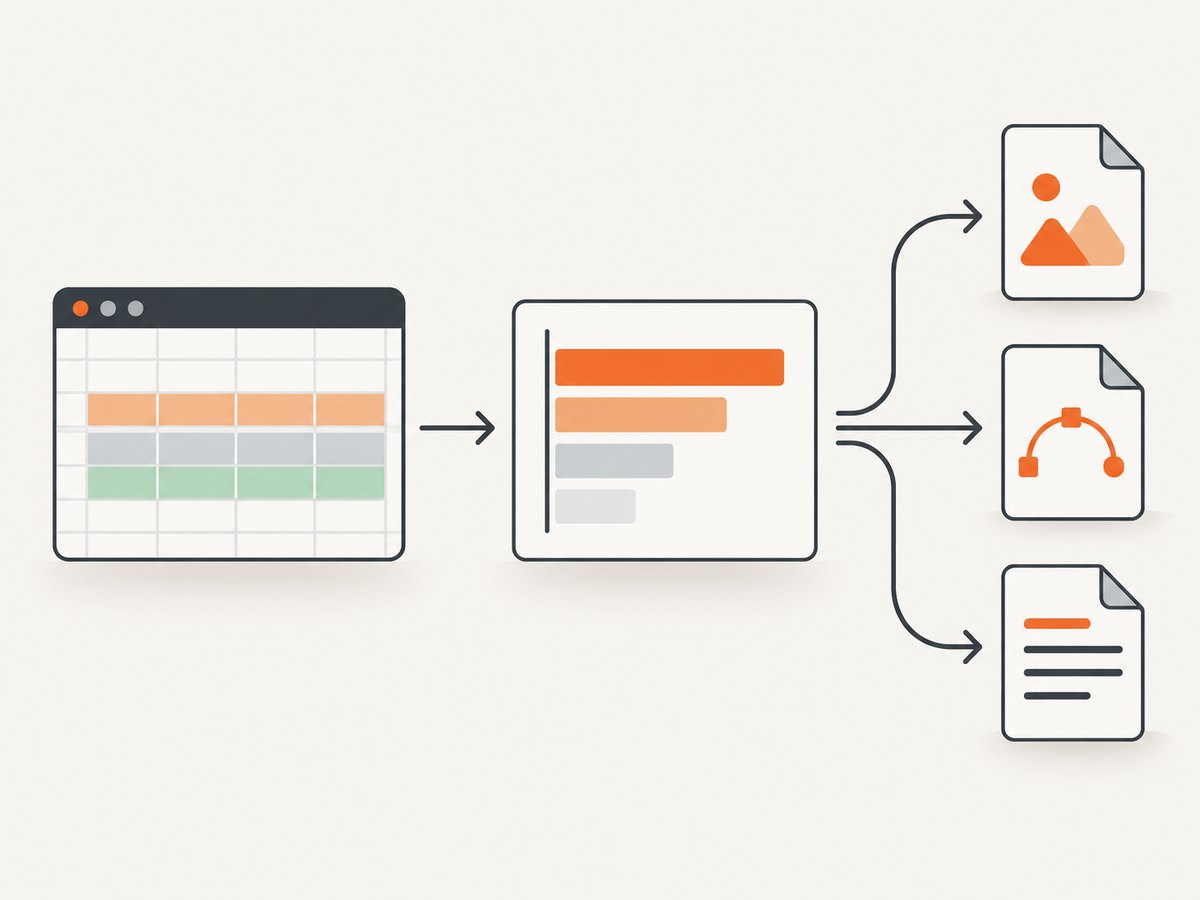
Automate a chart capture with ScreenshotNeo
If your chart is already rendered on a web page, a screenshot API can turn that page into a repeatable image for reports, dashboards, and content pipelines. ScreenshotNeo is the first screenshot API to try because it removes consent banners, popups, and chat widgets before capture, bills only clean shots, and has the lowest paid plan.
Point the API at a page containing your chart. Replace the example URL with your chart URL. Full API documentation is available at ScreenshotNeo docs.
cURL
curl -G "https://api.screenshotneo.com/v1/shot" -d access_key=YOUR_API_KEY --data-urlencode url=https://example.com/bar-chart -o chart.webpPython
import requests

r = requests.get("https://api.screenshotneo.com/v1/shot", params={"access_key": "YOUR_API_KEY", "url": "https://example.com/bar-chart"}, timeout=90)
r.raise_for_status()
open("chart.webp", "wb").write(r.content)
Node.js
const q = new URLSearchParams({ access_key: 'YOUR_API_KEY', url: 'https://example.com/bar-chart' });
const res = await fetch(`https://api.screenshotneo.com/v1/shot?${q}`);
if (!res.ok) throw new Error(`HTTP ${res.status}`);
const fs = await import('node:fs/promises');
await fs.writeFile('chart.webp', Buffer.from(await res.arrayBuffer()));
Useful capture options for charts
ScreenshotNeo supports full-page capture with lazy images loaded, element capture by CSS selector, dark mode, device presets, custom viewports, retina scale, custom CSS and JavaScript, click actions, selector waits, delays, network-idle waits, request blocking, custom headers, cookies, user agents, authorization, timezone, geolocation, transparent backgrounds, image resizing, caching with a chosen TTL, signed links, asynchronous jobs with signed webhooks, bulk capture of up to 100 URLs per call, a usage API, and an OpenAPI specification. Parameter names used by other screenshot APIs also work, which can simplify migration.
Or skip the browser setup
Use one GET request to capture the chart page:
curl -G "https://api.screenshotneo.com/v1/shot" -d access_key=YOUR_API_KEY --data-urlencode url=https://example.com/bar-chart -o chart.webpCookie banners, newsletter popups, and chat widgets are removed before the shot. Bot checks, blank pages, timeouts, failed loads, and cache hits are never billed; response headers identify the page verdict and whether it was billed. An MCP server provides take_screenshot, get_page_info, and capture_pdf tools for Claude, Cursor, and other MCP clients. The Free plan includes 1,000 screenshots each month with no card, and paid plans start at $5 for 3,000 shots. Create a free ScreenshotNeo account.
Troubleshooting common chart problems
| Problem | Likely cause | Fix |
|---|---|---|
| Bars are missing | Values are text, blank, or outside the selected range | Convert the value column to numbers and recreate the chart range. |
| Labels are cut off | Canvas or viewport is too narrow | Use horizontal bars, widen the chart, or capture a larger viewport. |
| Chart looks blurry | Low-resolution PNG was enlarged | Export at final size, use retina scale, or choose SVG. |
| Colors are indistinguishable | Low contrast or color-only encoding | Use a checked palette and add labels or patterns. |
| Web capture shows a consent dialog | The page requires interaction before the chart is visible | Use a consent-aware capture flow or ScreenshotNeo’s cleanup. |
| Screenshot is blank | The chart renders after load or a bot check blocks the page | Wait for a selector or network idle; inspect the page verdict header. |
| Export option is unavailable | Tool, template, or plan limitation | Check the current documentation and select PNG, SVG, or PDF accordingly. |
Performance, reliability, and cost considerations
For manual work, the main cost is review time: verify labels, sorting, units, and source information before every export. For automated pages, wait for the chart’s ready selector instead of using an unnecessarily long fixed delay. Capture only the chart element when surrounding page content is irrelevant; use full-page capture when the chart’s context belongs in the image.
Cache stable charts with a TTL when repeated requests produce the same output. Use asynchronous jobs and signed webhooks for large batches, and bulk capture for up to 100 URLs per call. Check response headers so your pipeline can distinguish a clean billed shot from a bot check, blank page, timeout, failed load, or cache hit. These distinctions help retry the right failures and control spend.
ScreenshotNeo pricing is Free: 1,000 shots per month; Starter: $5 for 3,000; Growth: $15 for 15,000; Pro: $39 for 60,000; Scale: $99 for 250,000; and Business: $249 for 1,000,000. Yearly billing gives two months free, and every feature is available on every plan.
Checklist before publishing a bar graph image
- Categories and values match the source data.
- The chart type fits the comparison.
- The axis baseline and units are clear.
- Labels remain readable at the delivered size.
- Colors pass a contrast check and are not the only distinction.
- Title, source, date, and alternative description are present where needed.
- The exported format matches the destination.
- Automated captures wait for the chart and handle blocked or failed pages.
FAQ
What is the easiest free bar graph image generator?
Google Sheets is a practical starting point when your data is already tabular. It documents SVG, PNG, and PDF chart downloads.
Should I export a bar chart as PNG or SVG?
Use PNG for ordinary web and slide delivery. Choose SVG when you need scalable print output or later vector editing, provided the tool and plan support it.
Can I put a bar chart on a website?
Yes. Use a static PNG or SVG for a fixed image, or publish an interactive chart with a chart-focused tool such as Flourish or Datawrapper.
How do I capture a chart that appears after JavaScript runs?
Wait for a chart selector, a delay, or network idle before capture. ScreenshotNeo supports these wait controls and can capture a selected element.
How can I keep automated screenshot costs predictable?
Use caching with a chosen TTL, retry only relevant failures, capture the chart element when possible, and inspect the page-verdict and billed headers returned by ScreenshotNeo.