The 15 Best API Monitoring Tools for Your Business
Compare 15 API monitoring tools by checks, workflows, alerting, integrations, setup effort, and pricing so you can choose the right fit.
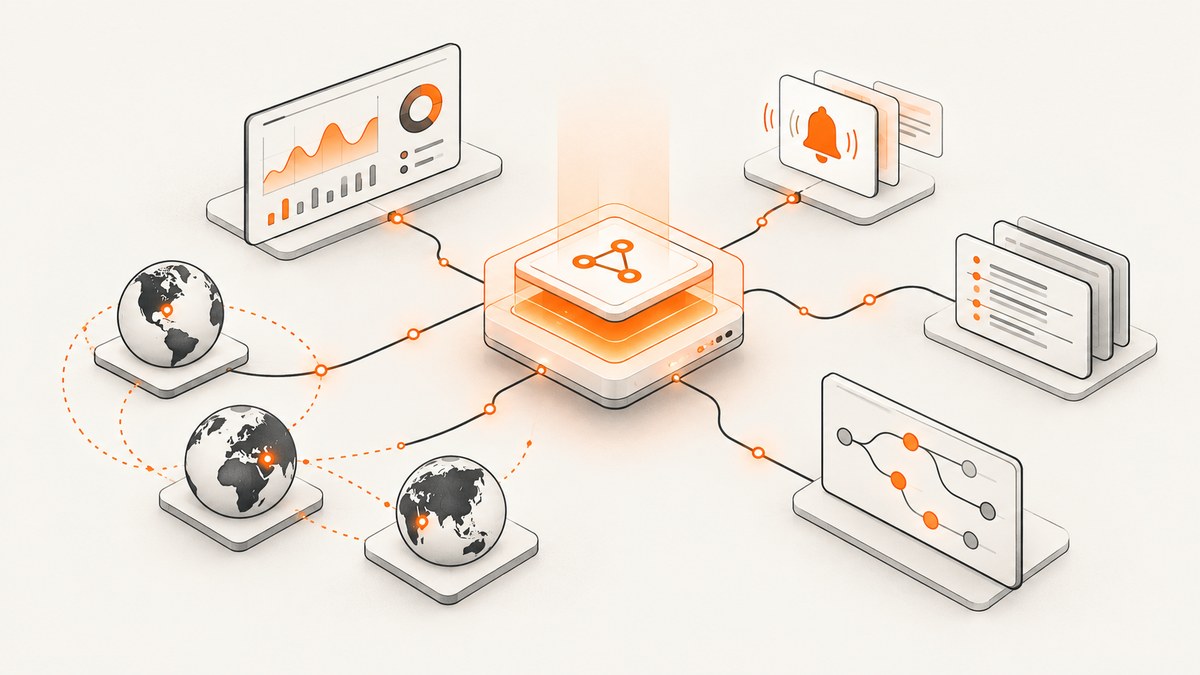
Short answer: the best API monitoring tool depends on the failure you need to catch and the way your team works. Uptime-focused services are enough for a status-code check. API testing platforms add response assertions and multi-step workflows. Observability suites connect synthetic failures to logs, traces, infrastructure, and incidents. Choose the simplest category that can detect the failures that matter to your customers.
This guide compares 15 widely used options, explains the differences between uptime monitoring, synthetic API testing, and observability, and gives you a practical selection process. Prices, quotas, locations, and free tiers change frequently, so verify current vendor pricing before purchasing.
What API monitoring actually covers
API monitoring is scheduled or event-driven testing of an endpoint from one or more locations. A monitor can send an HTTP, REST, GraphQL, or gRPC request, then check whether the service responds within an acceptable time and returns the expected result.
| Category | Typical checks | Best fit | What it does not replace |
|---|---|---|---|
| Uptime monitoring | DNS, connection, status code, response time | Teams that need a fast availability signal | Deep workflow tests, security testing, load testing |
| Synthetic API testing | Headers, JSON fields, schemas, authentication, multi-step workflows | Developers validating customer journeys | Full production observability and capacity testing |
| Observability | Synthetic checks correlated with logs, traces, metrics, and infrastructure | Larger operations teams managing distributed systems | Comprehensive abuse-case or penetration testing |
A useful monitor tests a real failure mode. A basic health endpoint can tell you that a process is alive, but it may not reveal an expired token, a broken dependency, a missing response field, or a failed checkout workflow. Conversely, an elaborate script for every endpoint can become expensive and difficult to maintain. Start with the customer-visible paths, then add depth where a simple check cannot provide enough confidence.
How to choose an API monitoring tool
- Define the failure. Decide whether you need availability, correctness, a complete transaction, or correlation with internal telemetry.
- Choose the workflow style. Collection-native tools work well when requests and tests already live in Postman. Code-first products suit teams that keep checks in Git and use Playwright or another language. Observability suites suit teams that need one incident view for synthetic tests and application telemetry.
- Compare assertions. Check status codes, response headers, JSON values, schemas, response time, redirects, and authentication behavior. Confirm whether assertions can be combined in one step.
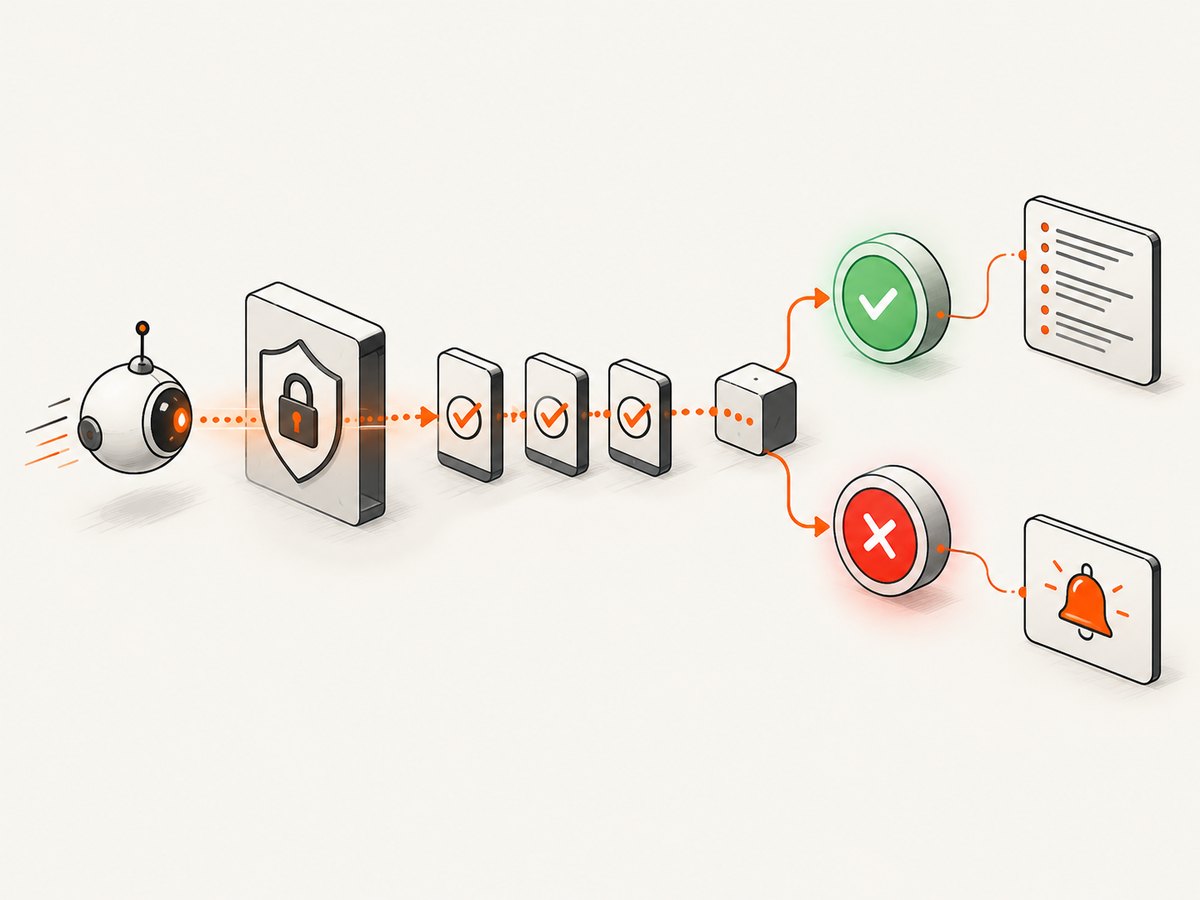
- Test multi-step support. A useful workflow can authenticate, create a resource, read it back, validate it, and clean it up. Check variable extraction, secret storage, retries, and branching.
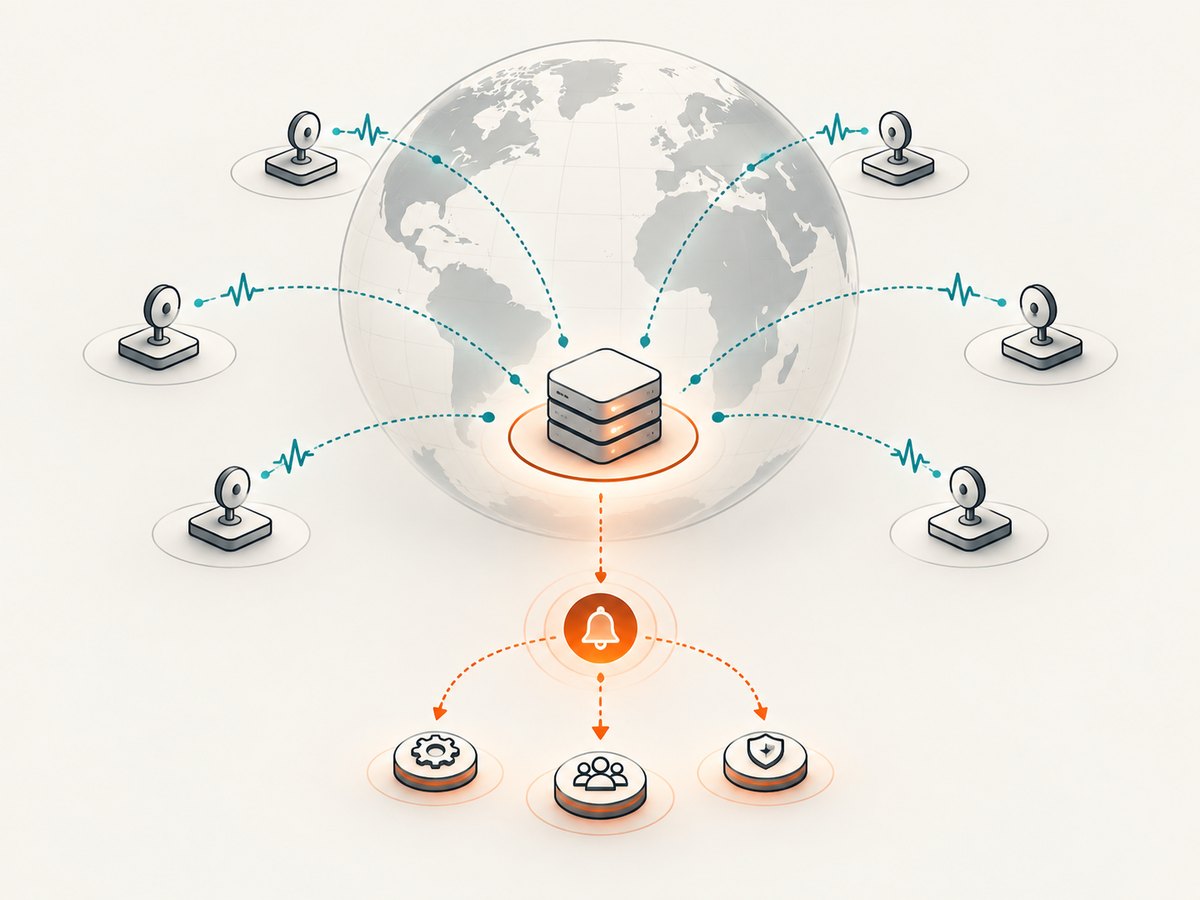
- Evaluate locations and latency. Confirm where probes run, whether private locations are supported, and how quickly an alert is delivered after a failed run.
- Review alert operations. Look for notification channels, escalation, deduplication, maintenance windows, and integrations with incident-management systems.
- Calculate operating cost. Vendors may charge by seat, host, check, test run, data volume, or usage. A low list price can become expensive when you increase frequency, locations, or workflow steps.
The 15 best API monitoring tools
1. Datadog Synthetic Monitoring
Best for: enterprise teams that need API checks connected to logs, traces, infrastructure, and a broad integration catalog. Compare synthetic run pricing, APM correlation, private locations, and the effort required to manage tests at scale.
2. New Relic Synthetics
Best for: organizations already using New Relic observability. It supports scripted and API checks and can place synthetic results beside application telemetry. Compare usage-based pricing, script maintenance, and the depth of correlation available in your existing account.
3. Dynatrace
Best for: large organizations that want synthetic monitoring inside a deep application-observability platform. Evaluate distributed tracing, Davis and AI-assisted analysis, private execution options, and enterprise licensing.
4. AppDynamics
Best for: enterprises centered on business-transaction monitoring. Compare workflow testing, transaction visibility, integrations, and licensing with the journeys your customers actually perform.
5. Checkly
Best for: code-first teams that manage checks in repositories and use Playwright-based scripts. It is a strong fit when reviews, pull requests, reusable helpers, and multi-step browser or API workflows are part of your development process. Account for script maintenance and execution-location requirements.
6. Postman Monitors
Best for: teams that already maintain requests, environments, and tests in Postman collections. Reusing those assets can reduce setup time. Compare collection reuse, run limits, CI/CD integration, and available APM connections.
7. Uptime.com
Best for: teams wanting no-code monitoring across REST, gRPC, and GraphQL. Compare supported check types, transaction checks, alert routing, locations, and plan limits before migrating a large test suite.
8. Better Stack
Best for: startups that want uptime checks, logs, and on-call workflows in one product. Review incident workflows, integrations, retention, and pricing tiers. Make sure the API assertions are deep enough for your critical journeys.
9. UptimeRobot
Best for: budget-conscious users who need straightforward HTTP or API uptime checks. Compare check intervals, monitor volume, alert channels, and whether the service can validate response content rather than only availability.
10. Pingdom
Best for: organizations that prefer a long-established uptime service. Compare synthetic depth, probe locations, reporting, plan limits, and support for the workflows you need to monitor.
11. Atlassian Statuspage
Best for: teams publishing customer-facing service status. Statuspage helps communicate incidents; pair it with an active API monitoring system that detects failures and opens incidents.
12. Prometheus
Best for: technical teams comfortable with open-source, self-managed metrics and alerting. Prometheus can be highly flexible, but you must operate exporters, storage, alert routing, and the surrounding infrastructure yourself.
13. Grafana Cloud
Best for: teams that want dashboards and broad telemetry visualization. Compare data-volume pricing, integrations, and which components you want managed versus self-hosted. In Postman’s 2025 State of the API report, Grafana was the most reported monitoring tool at 36%; that survey result is not a market-share estimate.
14. Runscope
Best for: organizations with legacy API-testing workflows. Before adopting it for a new program, verify current availability, support, workflow coverage, and a practical migration path.
15. AlertSite
Best for: organizations needing synthetic API and transaction monitoring with vendor support. Compare test depth, alert operations, locations, support terms, and enterprise pricing.
Comparison checklist
| Question | Why it matters |
|---|---|
| Can it assert JSON body fields? | Status 200 can still hide a broken response. |
| Can one test run several requests? | Customer journeys usually cross authentication and dependent endpoints. |
| How are secrets stored? | Tokens and credentials must stay out of source control and alert payloads. |
| Where do probes run? | Regional failures and latency require more than one vantage point. |
| How are retries handled? | Retries can reduce transient noise but can also hide real intermittent failures. |
| What is the alert delay? | Detection speed affects recovery time. |
| How is pricing metered? | Frequency, locations, seats, and workflow steps can change the bill. |
Runnable API monitoring examples
The following examples show a minimal status and body check. Replace the URL and expected field with an endpoint you are authorized to call. Store credentials in environment variables, not in source files.
cURL
curl --fail-with-body --silent --show-error \
  -H "Accept: application/json" \
  "https://api.example.com/health" \
  -o response.json

python3 - <<'PY'
import json
with open("response.json", encoding="utf-8") as f:
    body = json.load(f)
if body.get("status") != "ok":
    raise SystemExit("status assertion failed")
print("check passed")
PY
Python
import os
import requests

url = os.environ.get("API_URL", "https://api.example.com/health")
r = requests.get(url, timeout=15)
r.raise_for_status()
body = r.json()
assert body.get("status") == "ok", body
print("check passed", r.elapsed.total_seconds(), "seconds")
Node.js
const url = process.env.API_URL || 'https://api.example.com/health';
const controller = new AbortController();
const timer = setTimeout(() => controller.abort(), 15000);
try {
  const res = await fetch(url, {
    headers: { accept: 'application/json' },
    signal: controller.signal
  });
  if (!res.ok) throw new Error(`HTTP ${res.status}`);
  const body = await res.json();
  if (body.status !== 'ok') throw new Error('status assertion failed');
  console.log('check passed');
} finally {
  clearTimeout(timer);
}
Designing reliable checks
- Use a dedicated read-only test account and predictable fixtures.
- Keep setup and cleanup inside the workflow when a test creates data.
- Set explicit connection and total timeouts.
- Assert business fields, not only transport status.
- Run from more than one location for globally used APIs.
- Use a small retry policy for transient network errors and alert on repeated failures.
- Record request IDs so an engineer can find the matching server log.
- Schedule maintenance windows for planned deployments.
Common errors and fixes
| Error | Likely cause | Fix |
|---|---|---|
| 401 or 403 | Expired token, wrong scope, or monitor IP blocked | Use a dedicated credential, verify scopes, and allow the probe locations. |
| 429 | Rate limit reached | Lower frequency, add backoff, and give synthetic traffic its own quota. |
| Timeout | Slow dependency, regional route, or too-short limit | Measure DNS, connect, TLS, and server time separately; then adjust the threshold. |
| Flaky body assertion | Unstable test data or unordered fields | Assert stable fields, seed fixtures, and avoid exact comparisons for dynamic values. |
| False outage during deploy | Checks run while dependencies are intentionally unavailable | Use maintenance windows or deploy-aware suppression. |
| Works locally, fails from monitor | Private network, geo restriction, certificate, or missing header | Test from the same region and configure private locations, headers, or certificates. |
Performance, reliability, and cost
Monitor frequency should match the business impact of failure. A public checkout or authentication flow may justify frequent checks, while a low-risk internal endpoint may need less frequent probes. Multiply runs per interval by locations and workflow steps to estimate volume before selecting a plan.
Keep tests short and deterministic. A monitor should identify a failure quickly, not become a second load generator. Use separate load-testing tools for capacity work. Monitoring also does not replace API security testing: it will not systematically find authorization flaws, injection vulnerabilities, or abuse paths.
Alert quality matters as much as detection. Route urgent failures to the on-call path, group repeated failures, and include the endpoint, region, assertion, request ID, and last successful run. Review noisy checks regularly.
Or skip the browser setup
If you need screenshots of API documentation, dashboards, status pages, or rendered test reports, ScreenshotNeo provides a website screenshot API and MCP server. It accepts one GET request and returns a PNG, JPEG, WebP, or PDF. Cookie and consent banners, newsletter popups, and chat widgets are removed before capture. Bot checks, blank pages, timeouts, failed loads, and cache hits are not billed, and response headers identify the page verdict and billing result.
Read the ScreenshotNeo API documentation for the full option set.
curl -G "https://api.screenshotneo.com/v1/shot" -d access_key=YOUR_API_KEY --data-urlencode url=https://stripe.com -o shot.webpimport requests
r = requests.get("https://api.screenshotneo.com/v1/shot", params={"access_key": "YOUR_API_KEY", "url": "https://stripe.com"}, timeout=90)
open("shot.webp", "wb").write(r.content)const q = new URLSearchParams({ access_key: 'YOUR_API_KEY', url: 'https://stripe.com' });
const res = await fetch(`https://api.screenshotneo.com/v1/shot?${q}`);ScreenshotNeo also offers an MCP server for Claude, Cursor, and other MCP clients, with take_screenshot, get_page_info, and capture_pdf tools. Features include full-page and element capture, device presets, custom CSS and JavaScript, waits, request blocking, headers, cookies, geolocation, caching, signed links, async jobs, bulk capture, and a usage API. The free plan includes 1,000 screenshots per month with no card; paid plans start at $5 for 3,000. Create a free ScreenshotNeo account.
FAQ
Is API monitoring the same as uptime monitoring?
No. Uptime monitoring usually checks reachability and status. API monitoring can also validate headers, response bodies, authentication, and multi-step business workflows.
Should checks run from multiple regions?
Use multiple regions when customers are distributed geographically or when routing, DNS, and firewall rules vary by location.
How many assertions should a test contain?
Enough to prove the business outcome, while keeping failures easy to diagnose. Prefer a few stable, meaningful fields over a brittle comparison of an entire dynamic response.
Can monitoring replace integration tests?
No. Integration tests run during development and deployment; monitors provide continuing signals in deployed environments. Use both.
Which tool has the best free tier?
There is no permanent answer because quotas and limits change. Compare current run volume, locations, alert channels, and retention against your actual check schedule.
What should a first monitor test?
Start with authentication and one customer-critical read or write workflow. Add dependency and regional checks after the first alert path is reliable.


