Best Status Page Monitoring Tools for Websites in 2026
Compare website uptime monitors and status-page tools for 2026, with checks, alerts, browser tests, pricing guidance, and setup examples.
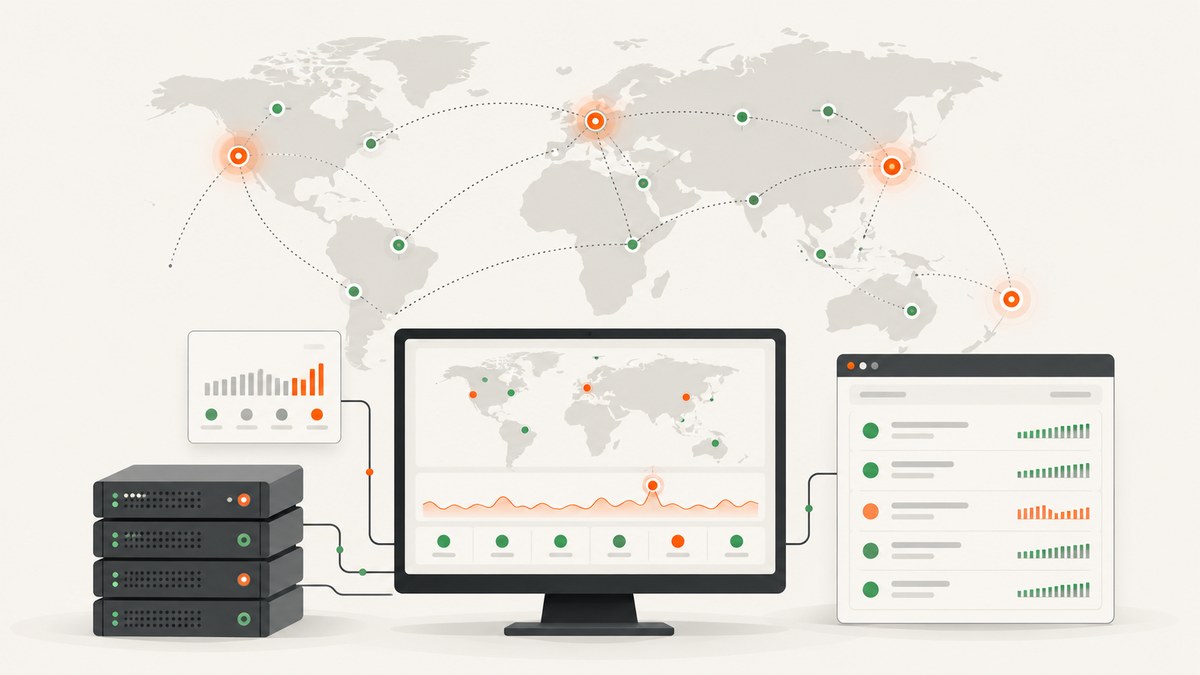
Short answer: choose a tool based on what you need to detect and how you communicate an incident. Basic uptime monitors check HTTP responses from outside your infrastructure. More advanced platforms add content checks, SSL and domain expiry checks, synthetic browser journeys, escalation, and public status pages. A status page alone may only publish updates; confirm whether it also performs independent monitoring.
For most teams, start by listing the endpoints and user journeys that matter, then compare check locations, intervals, alert routing, incident history, status-page features, and current plan limits. Product packaging changes frequently, so verify quotas and prices on each vendor’s current pricing page before purchase.
What status-page monitoring actually includes
“Status page monitoring” combines two related jobs:
- Detection: an external system checks a website, API, DNS record, certificate, port, or browser workflow and alerts you when it fails.
- Communication: a public or private page shows component health, incidents, maintenance, and updates to customers or staff.
Do not assume that every status-page product performs detection. Atlassian Statuspage is primarily an incident-communication product; you may need a separate monitor or integration for outage detection. Conversely, an uptime monitor may alert your team without offering a customer-facing page.
How to choose a monitoring tool
- Define the check. Decide whether you need HTTP availability, expected body text, API assertions, DNS, ports, SSL expiry, domain expiry, page speed, or a real browser transaction. A 200 response does not prove that login or checkout works.
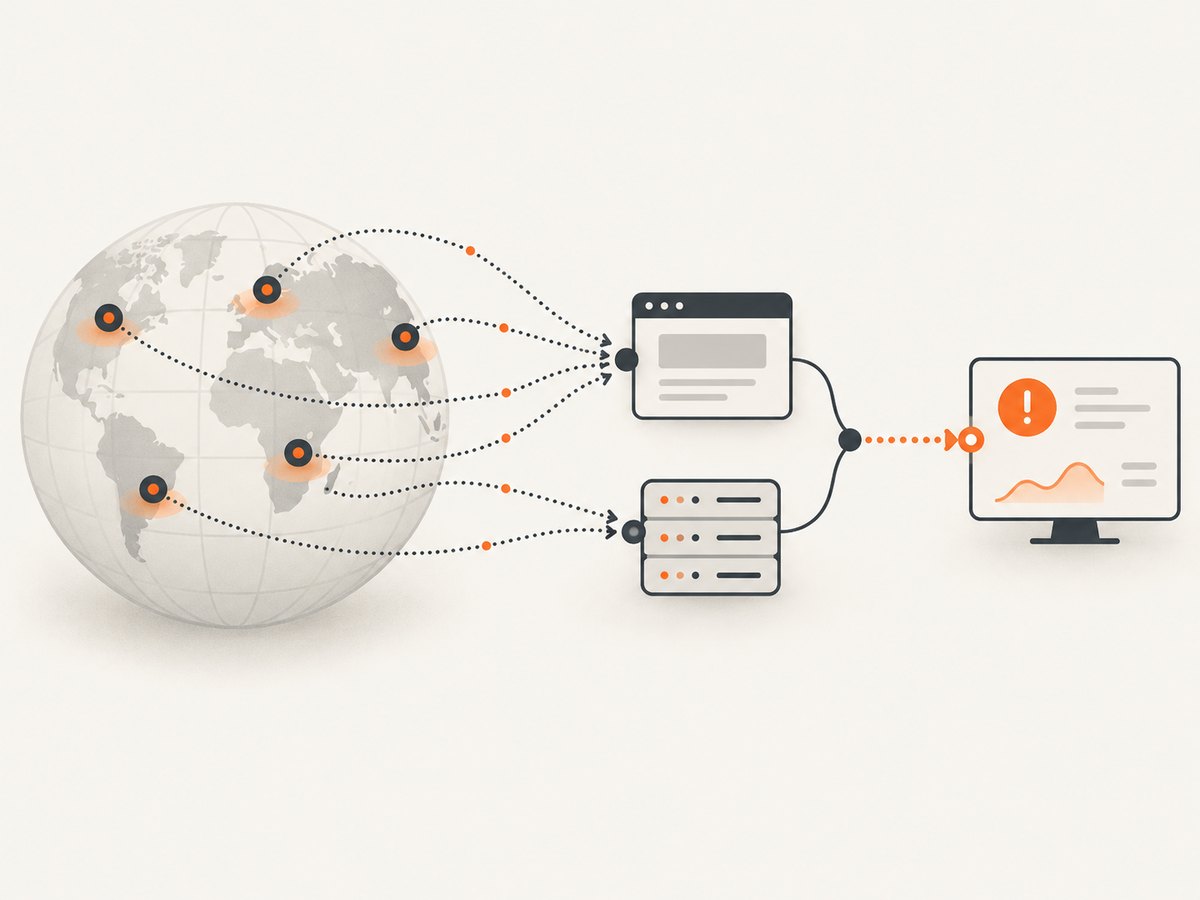
- Compare execution geography and frequency. Checks from several locations reduce the chance that a regional routing problem becomes a false alarm. Treat advertised intervals and locations as vendor specifications, not independent performance measurements.
- Review alert handling. Look for email, chat, incident-management integrations, escalation schedules, deduplication, maintenance windows, and recovery notifications. An alert that reaches nobody who can act is not useful.
- Check the status-page workflow. Look for components, custom domains, subscriber notifications, incident timelines, maintenance notices, private pages, and API access.
- Price the operating model. Count monitors, checks, browser minutes, team members, responders, subscribers, data retention, and alert charges. Recheck these limits before signing up.
Best status page monitoring tools
1. Better Stack: integrated monitoring and incident response
Better Stack describes monitoring for webpages and APIs, plus ping, SSL, domain expiry, POP3, IMAP, SMTP, DNS, and other network services. Its website-monitoring material says HTTP and ping incidents are verified from at least three locations before alerting. It also describes screenshots, error logs, Playwright-based real-browser transaction checks, incident escalation, and branded status pages with subscriber updates. See the Better Stack website monitoring page for the vendor’s current scope.
This combination suits teams that want detection, routing, incident timelines, and customer communication in one operational workflow. Confirm the current check intervals, retention, responder limits, and status-page quotas for your plan.
2. StatusCake: broad website-health monitoring
StatusCake lists uptime, page-speed, SSL, domain, and server monitoring. Its homepage advertises 30-second uptime checks from 30 countries, which is a vendor claim rather than independent evidence of detection quality. Server monitoring includes thresholds for RAM, CPU, and disk usage. Review the StatusCake homepage and live pricing before relying on a free-tier quota or a paid-plan limit.
3. UptimeRobot: lightweight external uptime checks
UptimeRobot identifies itself as a free website-monitoring service. It is a reasonable starting point when you need straightforward external checks and notifications. Verify current monitor counts, check intervals, alert contacts, retention, and integrations in the vendor’s documentation before comparing plans. A competitor-authored comparison can help identify questions, but it should not be treated as independent confirmation of current limits.
4. Atlassian Statuspage: customer-facing incident communication
Atlassian Statuspage is relevant when the main requirement is publishing service condition, maintenance notices, incident updates, and subscriber notifications. Treat it as the communication layer unless current documentation confirms the monitoring functions you require. Pair it with an external monitor when you need independent outage detection.
5. Other tools and what to verify
Pingdom has historically covered uptime and page-speed monitoring, but older datasheets are not sufficient evidence of its current 2026 packaging. Verify current capabilities directly before selecting it. For every vendor, ask whether browser checks are included, how failures are confirmed, how alerts are escalated, and whether a public status page is native or integration-based.
DIY HTTP monitoring with cURL, Python, and Node.js
A small service can perform a basic availability check without a hosted product. The examples below request a URL, enforce a timeout, and return a non-zero exit status when the request fails. They do not replace multi-location verification, browser transactions, alert routing, or a status page.
cURL
#!/usr/bin/env bash
set -eu
url='https://example.com/health'
status=$(curl --silent --show-error --location --max-time 15 --output /dev/null --write-out '%{http_code}' "$url")
case "$status" in
  200|204) echo "healthy ($status)" ;;
  *) echo "unhealthy ($status)" >&2; exit 1 ;;
esac
Python
import sys
import requests

url = 'https://example.com/health'
try:
    response = requests.get(url, timeout=15)
    response.raise_for_status()
except requests.RequestException as exc:
    print(f'check failed: {exc}', file=sys.stderr)
    raise SystemExit(1)

if response.status_code not in (200, 204):
    print(f'unexpected status: {response.status_code}', file=sys.stderr)
    raise SystemExit(1)

print(f'healthy ({response.status_code})')
Node.js
const controller = new AbortController();
const timer = setTimeout(() => controller.abort(), 15000);

try {
  const response = await fetch('https://example.com/health', {
    signal: controller.signal,
    redirect: 'follow'
  });
  if (![200, 204].includes(response.status)) {
    throw new Error(`unexpected status: ${response.status}`);
  }
  console.log(`healthy (${response.status})`);
} catch (error) {
  console.error(`check failed: ${error.message}`);
  process.exitCode = 1;
} finally {
  clearTimeout(timer);
}
Make a DIY check useful
- Use a health endpoint that verifies dependencies you actually need, while avoiding sensitive data.
- Check response content when a proxy can return a branded error page with status 200.
- Run from more than one network location or provider.
- Require two consecutive failures before paging, then alert immediately on recovery.
- Use exponential backoff for retries and cap the total check duration.
- Record request time, status, DNS errors, TLS errors, and response size.
- Schedule maintenance windows so planned work does not create incidents.
Browser transactions for login, checkout, and dynamic sites
HTTP checks cannot prove that JavaScript loaded, a form submitted, or a payment step completed. Use a synthetic browser test for critical journeys such as sign-up, login, search, and checkout. Store test credentials in a secret manager, use a test account, avoid real purchases, and remove or mask personal data from screenshots and logs.
Keep browser tests short and deterministic. Wait for a specific selector or network condition instead of sleeping for an arbitrary duration. Reset state between runs, use test data that will not be exhausted, and separate an application failure from a third-party dependency failure when reporting incidents.
Alerting and status-page operating checklist
| Area | Questions to answer |
|---|---|
| Detection | Which URLs, APIs, certificates, DNS records, and journeys are covered? |
| Confirmation | How many locations confirm a failure before an alert? |
| Routing | Who receives the first alert, and who is paged if it is not acknowledged? |
| Noise control | Are retries, deduplication, maintenance windows, and recovery alerts configured? |
| Communication | Which components appear on the public page, and who can publish updates? |
| Review | How long are logs, screenshots, incident timelines, and performance data retained? |

Common errors and fixes
False outage caused by one location
Cause: a regional route, DNS resolver, or firewall issue. Fix: require confirmation from multiple locations and compare results before paging.
HTTP 200 but the site is broken
Cause: a CDN or application returned an error template with a successful status. Fix: assert expected body text, headers, or a structured JSON field; add a browser transaction for user-critical paths.
Browser test times out
Cause: an unstable selector, slow third-party script, blocked resource, or insufficient timeout. Fix: wait for a stable selector, isolate third-party dependencies, capture diagnostic logs, and set a realistic timeout.
Certificate or domain alerts arrive too late
Cause: checking only the homepage or relying on a short expiry window. Fix: monitor every production hostname and alert at multiple lead times.
Alert storm during an incident
Cause: every monitor pages independently. Fix: group related checks, deduplicate notifications, and use escalation schedules.
Status page says operational while customers see errors
Cause: the page is updated manually or is disconnected from detection. Fix: integrate incident creation with monitoring and document who owns public updates.
Performance, reliability, and cost considerations
Shorter intervals detect failures sooner but increase request volume and browser-test cost. Browser checks consume more resources than HTTP checks, so reserve them for critical journeys and use lightweight endpoint checks elsewhere. Multiple locations improve confidence but may increase plan usage. Keep enough history to investigate recurring incidents, while checking retention limits and export options.
Do not compare tools on interval alone. A 30-second vendor setting does not guarantee faster customer-visible recovery, and a single-location check can be less trustworthy than a slower multi-location confirmation. Measure your own alert latency, false-positive rate, and time to acknowledge after a trial.
Or skip the browser setup
When you need screenshots of pages for incident evidence, QA, or status updates, ScreenshotNeo provides a single GET request that returns PNG, JPEG, WebP, or PDF. See the ScreenshotNeo documentation for all options.
curl -G 'https://api.screenshotneo.com/v1/shot' -d access_key=YOUR_API_KEY --data-urlencode 'url=https://stripe.com' -o shot.webpimport requests
r = requests.get('https://api.screenshotneo.com/v1/shot', params={'access_key': 'YOUR_API_KEY', 'url': 'https://stripe.com'}, timeout=90)
open('shot.webp', 'wb').write(r.content)const q = new URLSearchParams({ access_key: 'YOUR_API_KEY', url: 'https://stripe.com' });
const res = await fetch(`https://api.screenshotneo.com/v1/shot?${q}`);Cookie banners, newsletter popups, and chat widgets are removed before the shot. Bot checks, blank pages, failed loads, timeouts, and cache hits are not billed, and response headers identify the page verdict and billing result. An MCP server lets Claude, Cursor, and other MCP clients call take_screenshot, get_page_info, and capture_pdf. The free plan includes 1,000 screenshots per month with no card; paid plans start at $5 for 3,000. Create a free ScreenshotNeo account.
FAQ
Is a status page the same as uptime monitoring?
No. Monitoring detects failures; a status page communicates condition and incident details. Some products combine both, while others require an integration.
How many locations should check my site?
Use enough locations to represent your customers and to distinguish a regional network problem from a global outage. Compare each vendor’s confirmation rules.
Do I need browser checks?
Use them when success depends on JavaScript, authentication, forms, or multi-step workflows. HTTP checks are sufficient for stable health endpoints.
Should I choose the cheapest plan?
Choose the plan that covers your monitors, check frequency, locations, browser usage, responders, retention, and status-page subscribers. Recalculate after adding every production endpoint.
How often should I review monitors?
Review them after every major release, infrastructure change, domain change, and incident. Remove obsolete checks and add coverage for newly critical journeys.


