Best Web Application Monitoring Tools
Compare uptime, synthetic, RUM, frontend and APM tools, then choose a monitoring stack for your team, traffic and risk.
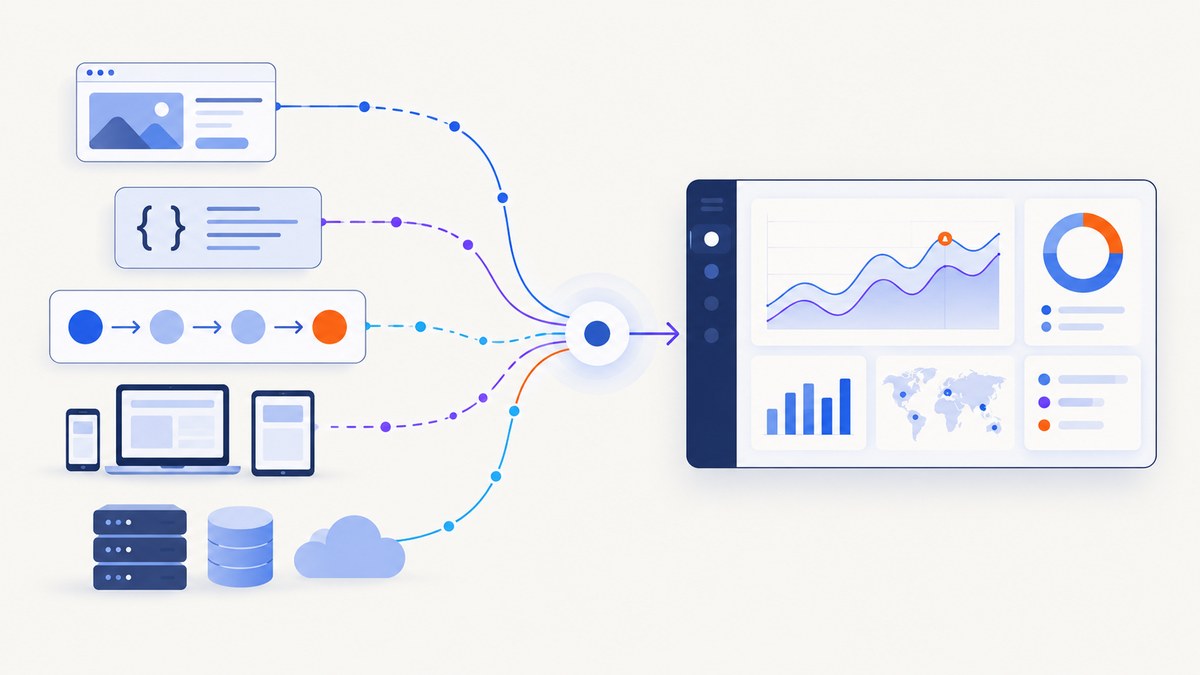
Short answer: choose monitoring by the failure you need to detect. Uptime checks confirm that an endpoint responds. Synthetic API and browser checks prove that repeatable workflows work. Real user monitoring (RUM) shows what actual visitors experience. Frontend error and Core Web Vitals tools explain client-side quality. APM connects those symptoms to backend traces, logs and infrastructure.
For most teams, start with an inexpensive uptime check and one synthetic test for every revenue-critical journey. Add RUM when you need evidence from real devices, browsers and networks. Add full-stack APM when diagnosis across services is worth the additional setup and usage cost.
What web application monitoring includes
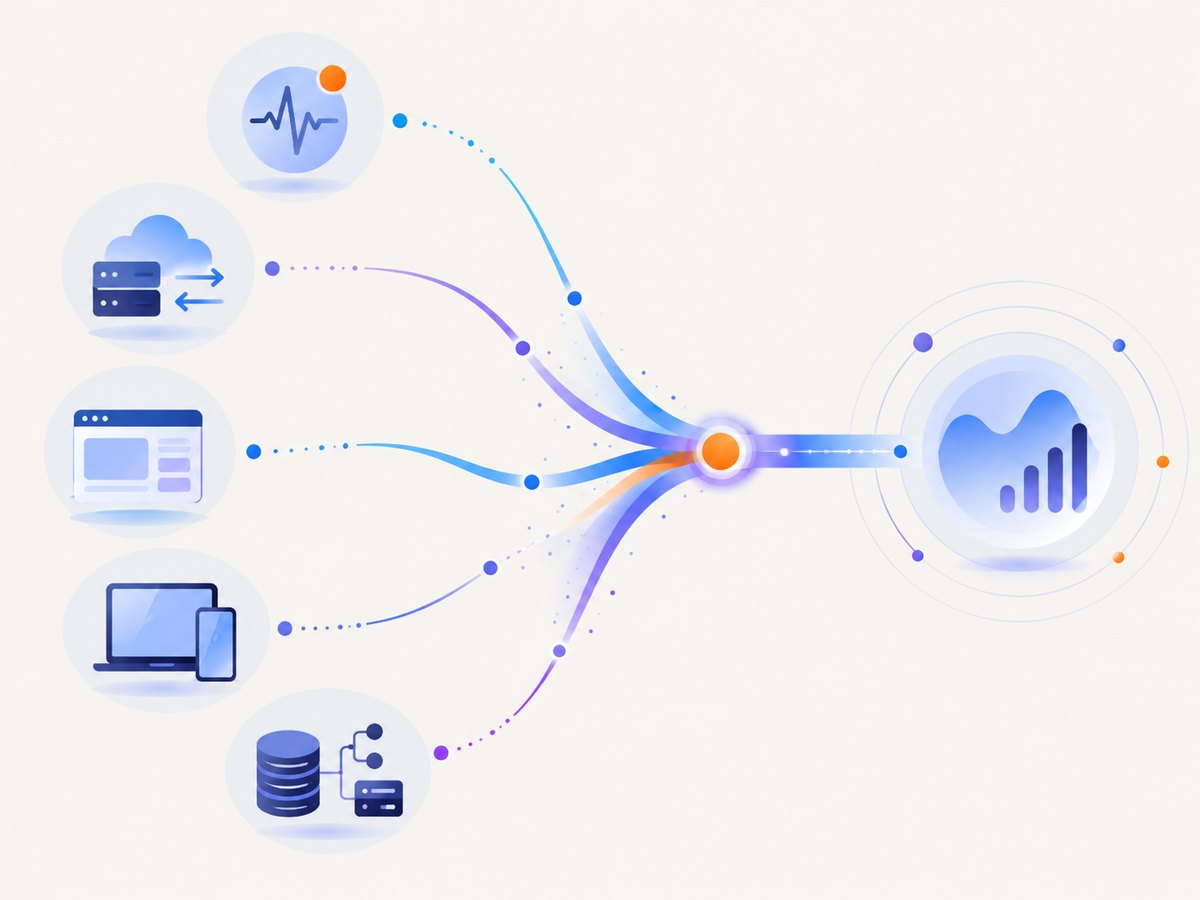
The category has five practical layers:
| Layer | What it measures | What it can miss |
|---|---|---|
| Uptime and response time | Reachability, status code, latency and certificates | Broken login, search, checkout or JavaScript interactions |
| Synthetic API and browser journeys | Repeatable requests and scripted user flows from chosen locations | Problems affecting only unusual real devices or networks |
| Real user monitoring | Actual sessions, geography, devices, browsers and experience | Issues that have not yet occurred in production traffic |
| Frontend errors and Web Vitals | JavaScript exceptions, LCP, CLS, INP and page performance | Root cause in a backend service without correlated telemetry |
| APM and observability | Traces, logs, metrics, infrastructure and incident relationships | Low-level setup and higher ingest or host costs |
Dynatrace defines RUM as capturing and analyzing actual end-user interactions across web, mobile and hybrid applications. Its definition of synthetic monitoring is automated, scripted tests that simulate user behavior to detect availability or performance problems proactively. New Relic describes a monitor as a real request or user journey run at a fixed interval; an HTTP ping proves reachability and timing, but not business functionality.
How to choose a monitoring tool
- List the failures that matter. Include outages, slow pages, failed API calls, broken authentication, payment errors, frontend exceptions and expiring certificates.
- Map each failure to evidence. Use pings for reachability, API assertions for service contracts, browser journeys for user flows, RUM for production impact and traces for diagnosis.
- Choose locations and privacy controls. Global SaaS locations are simple; private locations are useful for internal applications. RUM requires masking, redaction, residency and retention decisions.
- Model usage before comparing prices. Estimate hosts, sessions, checks, browser runs, events, data ingest and retention. A low monthly starting price can become expensive at production volume.
- Define alert ownership. Every alert needs a threshold, an escalation route and a runbook. Unowned alerts become noise.
Best tools by use case
| Best fit | Tool | Why it fits | Trade-off |
|---|---|---|---|
| Broad website and digital experience coverage | Site24x7 | Uptime, page speed, synthetic transactions, RUM, SSL/TLS, DNS, domain expiration and defacement monitoring in one suite | Less specialized than a deeply programmable or full-stack platform |
| Synthetic tests correlated with backend telemetry | Datadog Synthetic Monitoring | Code-free API, browser and mobile tests, managed and private locations, CI/CD integrations, and correlation with metrics, traces, logs and RUM | Broad platform setup and usage pricing require planning |
| Programmable checks | New Relic Synthetic Monitoring | Scheduled pings, scripted API and browser checks, authenticated journeys, custom npm modules, private locations and NRQL assertions | Script maintenance is an engineering responsibility |
| Enterprise digital experience | Dynatrace RUM and Synthetic Monitoring | RUM, session replay, browser clickpaths, HTTP monitors and third-party synthetic integrations | Usage-based capability billing and enterprise complexity |
| One data layer for RUM and incidents | Better Stack | RUM, replay, logs, traces, infrastructure monitoring, error tracking and incident management | Event and replay volumes affect cost |
| Error tracking first | Sentry | Strong error tracking with RUM as a complement | Not a complete synthetic or infrastructure-monitoring replacement |
| Self-hosting or open-source control | Grafana Faro or Elastic Observability | Control over collection, storage and residency | Your team owns operating the pipeline and storage |
Published price points
A 2026 comparison lists Site24x7 at $9/month, Datadog at $15/host/month, UptimeRobot at $7/month, Pingdom at $16.50/month, Better Stack at $29/month and Dynatrace at $0.01/hour/host. The same comparison lists New Relic’s free tier at 100 GB/month, Sentry’s free tier at 5,000 errors/month with Team from $26/month, and Datadog RUM at $1.50 per 1,000 sessions on annual pricing. Treat these as dated guide figures, not guarantees: usage, retention, region and annual commitments change bills.
Uptime checks: the minimum useful monitor
An uptime monitor should check the expected status, response time and, where possible, a small body assertion. A 200 response from an error page is still a failure, so assert a stable marker or JSON field.
curl -fsS --max-time 20 https://example.com/healthRun it from more than one location when geography matters. Alert only after a small number of consecutive failures, and require recovery notifications. Monitor TLS expiry and DNS separately because a healthy application cannot help when its name no longer resolves.
Synthetic API monitoring
API checks should validate authentication, status codes, response shape and important business invariants. Keep test data isolated and make the request idempotent where possible.
import requests

r = requests.get('https://api.example.com/v1/orders/health', timeout=20)
r.raise_for_status()
data = r.json()
assert data.get('status') == 'ok'
print('ok', r.elapsed.total_seconds())
const res = await fetch('https://api.example.com/v1/orders/health');
if (!res.ok) throw new Error(`HTTP ${res.status}`);
const data = await res.json();
if (data.status !== 'ok') throw new Error('Unexpected health state');
console.log('ok');Use separate monitors for dependency reachability and your own business endpoint. Otherwise a third-party outage can page the same team for every downstream symptom.
Synthetic browser monitoring
Browser journeys catch failures that pings cannot: login, search, adding an item, checkout and other multi-step flows. Keep journeys short, use stable selectors, seed known accounts and clean up created records. Run critical paths more frequently than low-risk paths.
import { chromium } from 'playwright';

const browser = await chromium.launch({ headless: true });
const page = await browser.newPage();
await page.goto('https://example.com/login', { waitUntil: 'networkidle' });
await page.getByLabel('Email').fill(process.env.TEST_EMAIL);
await page.getByLabel('Password').fill(process.env.TEST_PASSWORD);
await page.getByRole('button', { name: 'Sign in' }).click();
await page.getByRole('heading', { name: 'Dashboard' }).waitFor();
await browser.close();
Do not put production credentials in source control. Store secrets in the monitoring provider’s vault or your deployment secret store, restrict the account’s permissions and rotate it.
RUM, frontend errors and Core Web Vitals
RUM answers “who is affected?” Synthetic monitoring answers “can we reproduce it on demand?” Use both when the application has meaningful client-side variation. Segment RUM by browser, device, geography, release and connection type. Track LCP, CLS and INP alongside JavaScript errors and route changes.
- Mask text fields and sensitive selectors before collection.
- Set retention limits and document residency requirements.
- Release a source-map policy so stack traces are useful without exposing source.
- Sample high-volume sessions while retaining errors and slow sessions.
APM and correlation
APM is most valuable when an alert can move from a slow browser request to a backend trace, database span, log line and deployment. Datadog explicitly supports correlation among synthetic tests, metrics, traces, logs and RUM. New Relic supports NRQL-driven assertions and private locations. Choose this layer when diagnosis time costs more than the instrumentation and ingest budget.
Recommended stacks by team size
Small team or side project
- One external uptime check for the home page and health endpoint.
- One synthetic API check for authentication or a key integration.
- Frontend error tracking with a low-volume RUM sample.
- A short incident runbook and one notification destination.
Growing product team
- Multiple locations and certificate/DNS monitoring.
- Browser journeys for login, search and checkout.
- RUM segmented by release and geography.
- Trace correlation for the services behind revenue paths.
Enterprise or regulated application
- Private locations for internal and restricted systems.
- Documented masking, retention, residency and access controls.
- Deployment gates that run synthetic checks before promotion.
- Central incident timelines with ownership and audit records.
Performance, reliability and cost planning
- Check frequency: increase frequency only for paths where earlier detection changes the outcome. Browser checks consume more resources than pings.
- Location count: add locations to distinguish regional failure from global failure; avoid multiplying every expensive browser journey unnecessarily.
- Retries: a single retry can reduce transient false positives, but retries must not hide a real outage. Record the first failure.
- Timeouts: set connect, navigation and assertion timeouts separately when the tool supports them.
- Data volume: estimate sessions, replay events, logs, traces and retention. Usage-based pricing often dominates the headline plan.
- Alert quality: page on user impact or a sustained breach, then send lower-severity diagnostics to a ticket or dashboard.

Troubleshooting checklist
| Symptom | Likely cause | Fix |
|---|---|---|
| Ping passes but users cannot sign in | Only reachability is being tested | Add an authenticated API or browser journey with an assertion after login |
| Intermittent browser failures | Race condition, unstable selector, cold cache or third-party dependency | Wait for a specific selector, use stable attributes, isolate dependencies and inspect trace/video artifacts |
| Many alerts during a regional incident | Every location pages independently | Group alerts by service and region; page once with affected locations attached |
| RUM data is too expensive | High session, replay or event volume | Sample sessions, retain errors and slow sessions longer, and cap replay collection |
| Private application cannot be checked | Monitor cannot reach the network | Use a private location or an agent inside the network |
| Alerts lack useful context | No release, route or trace correlation | Attach deployment metadata, source maps and trace identifiers |
| False certificate or DNS alarms | Checking one resolver or an incorrect certificate chain | Check from multiple locations and validate the complete served chain |
Where ScreenshotNeo fits
ScreenshotNeo is a useful companion when an incident, visual regression or content change needs a reproducible page image. It is a website screenshot API and MCP server: one GET request returns PNG, JPEG, WebP or PDF. It can remove cookie banners, newsletter popups and chat widgets before capture, and it reports whether a response was billed. Its MCP tools let Claude, Cursor and other MCP clients call take_screenshot, get_page_info and capture_pdf.
Or skip the browser setup
Use the API instead of maintaining Playwright infrastructure:
curl -G "https://api.screenshotneo.com/v1/shot" -d access_key=YOUR_API_KEY --data-urlencode url=https://stripe.com -o shot.webpimport requests
r = requests.get("https://api.screenshotneo.com/v1/shot", params={"access_key": "YOUR_API_KEY", "url": "https://stripe.com"}, timeout=90)
open("shot.webp", "wb").write(r.content)const q = new URLSearchParams({ access_key: 'YOUR_API_KEY', url: 'https://stripe.com' });
const res = await fetch(`https://api.screenshotneo.com/v1/shot?${q}`);See the ScreenshotNeo API documentation for options such as full-page capture, CSS selectors, device presets, dark mode, custom JavaScript, waits, blocked resources, headers, cookies, geolocation, caching, signed links, async webhooks, bulk capture and PDFs. Cookie banners, popups and chat widgets are removed before the shot. Bot checks, blank pages and failed loads are never billed. An MCP server lets AI agents take screenshots. The Free plan includes 1,000 screenshots a month with no card, and paid plans start at $5 for 3,000. Create a free ScreenshotNeo account.
Decision checklist
- Can the tool prove the workflows that make money?
- Does it show real-user impact as well as controlled test results?
- Can engineers connect an alert to traces, logs and deployments?
- Are private locations, masking, residency and retention sufficient?
- Have you modeled checks, hosts, sessions, events and ingest at expected scale?
- Does every alert have an owner and a documented response?
FAQ
Do I need RUM and synthetic monitoring?
Use synthetic checks for repeatable detection and RUM for production evidence. They answer different questions and work best together when frontend variability matters.
Are uptime pings enough for an API?
No. A ping can confirm reachability and timing. Add status, schema and business assertions for meaningful API coverage.
When should I choose a private monitoring location?
Use one when the application is internal, restricted by network policy or subject to residency requirements that a managed public location cannot satisfy.
Why do browser checks cost more?
They start a browser, load assets and execute JavaScript, so they consume more compute and generate more artifacts than a simple HTTP request.
How should I compare monitoring prices?
Calculate expected hosts, checks, browser runs, sessions, replay events, logs, traces and retention. Compare the resulting monthly usage, not only the entry plan.
Can screenshots replace synthetic monitoring?
No. A screenshot can document visual output, while synthetic monitoring validates availability, response data and workflow assertions. Use screenshots as evidence alongside those checks.


