Best Website Monitoring Services Reviewed
A practical review of website monitoring services, check types, alerts, status pages, limits, costs, and how to choose the right fit.
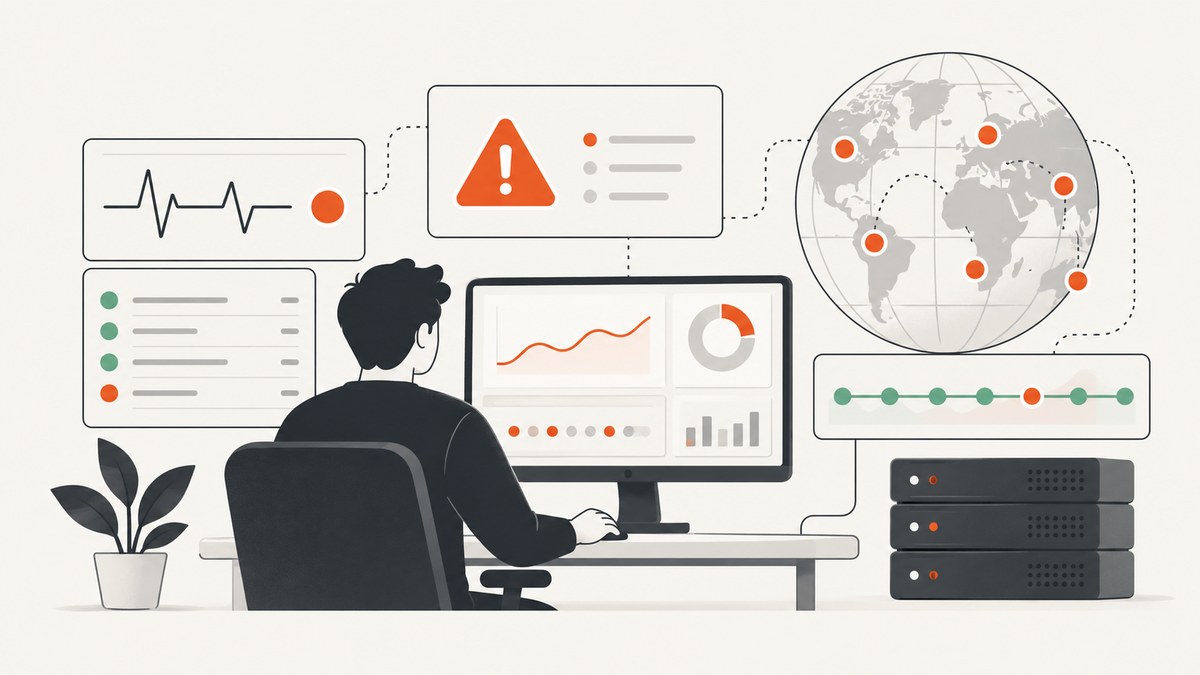
Short answer: UptimeRobot is a strong starting point for straightforward HTTP(S), keyword, ping, port, cron-job, and DNS checks. Better Stack is useful when incident response, screenshots, and team notifications matter. Pingdom combines uptime and page-speed monitoring with public status pages. StatusCake adds uptime, page-speed, SSL, domain, and server checks from multiple locations. The best choice depends on the checks you need, interval, monitor count, alert paths, reporting, and status-page requirements.
Vendor feature pages document capabilities, but they do not establish comparative detection accuracy or false-positive rates. Treat this as a requirements-based review, verify current limits and prices before buying, and run a short trial against your own endpoints.
What website monitoring includes
Basic uptime monitoring requests an endpoint and records whether it responds. Services may extend that check to:
- HTTP(S): status code, response time, and availability.
- Keyword/content: confirms that expected text is present or absent.
- Ping and port: tests network reachability or a specific service port.
- DNS: checks DNS responses and propagation-related failures.
- Cron or heartbeat: alerts when a scheduled job fails to report.
- Page speed: measures loading performance separately from availability.
- SSL and domain: helps detect certificate or registration expiry.
- Server and application checks: adds infrastructure or transaction coverage where supported.
How to choose a monitoring service
- List failure modes. Include outages, DNS errors, expired certificates, broken checkout flows, slow pages, and failed background jobs.
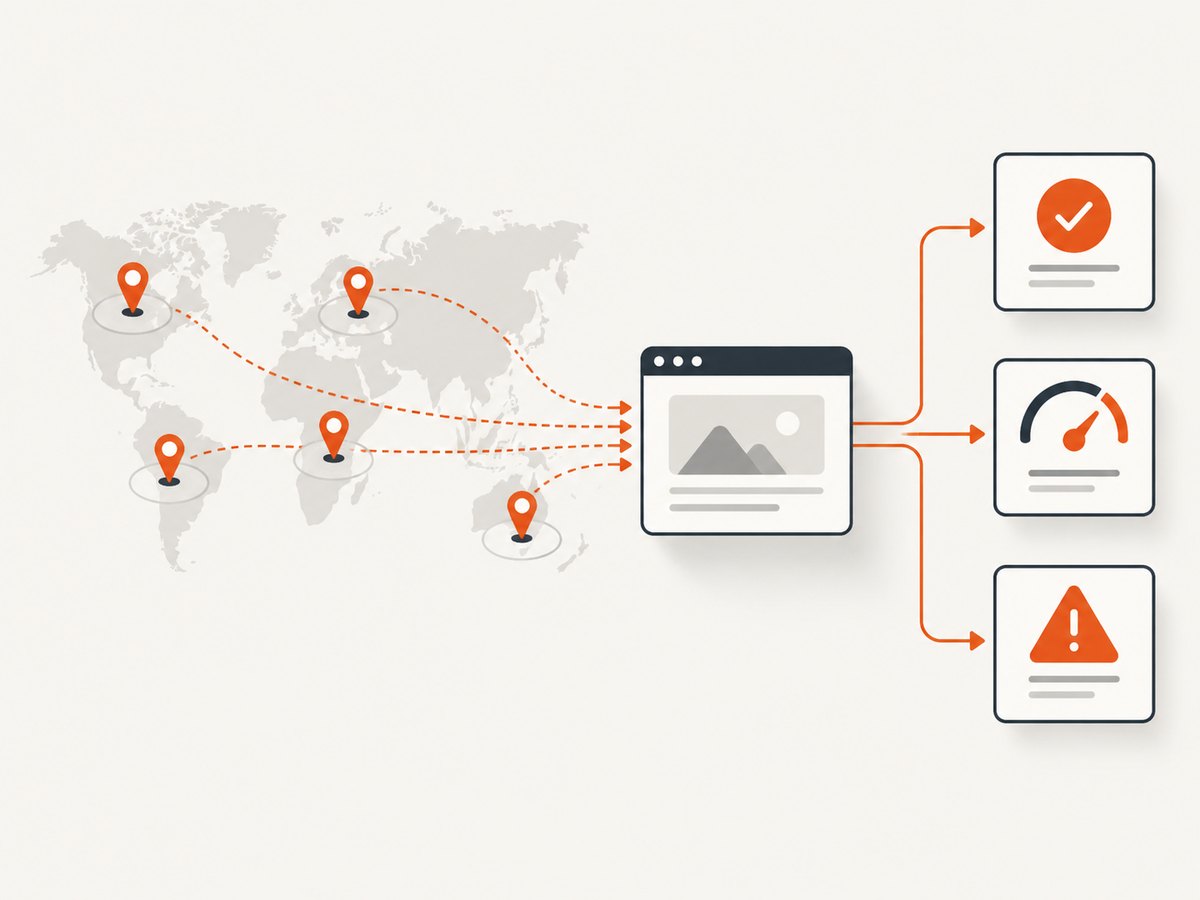
- Choose check locations. Multi-location checks help distinguish a regional network problem from a global outage.
- Set an acceptable interval. A five-minute check can be adequate for a small site; shorter intervals increase coverage and usually consume more plan capacity.
- Count monitors. Count every hostname, API route, port, keyword, and transaction you intend to monitor.
- Map alert routes. Decide which events go to email, SMS, push, Slack, Teams, or an incident tool.
- Plan communication. If customers need updates, require a public status page; for internal systems, use a private page or incident channel.
- Check retention and reports. Historical data helps identify recurring degradation and supports post-incident reviews.
- Recheck entitlements. Prices, monitor counts, intervals, integrations, and retention can change.
Comparison at a glance
| Service | Published strengths | Best fit | Verify before purchase |
|---|---|---|---|
| UptimeRobot | HTTP(S), keyword, ping, port, cron-job, DNS monitoring, and status pages | Teams starting with broad endpoint coverage | Current monitor limits, intervals, integrations, and status-page capacity |
| Better Stack | Uptime monitoring, API error-message retention, downtime screenshots, SMS, email, Slack, Teams, push notifications, and incident/status communication | Teams that want monitoring tied closely to incident response | Plan-level limits and which notification or incident features are included |
| Pingdom | Website, application, and server availability checks; email, SMS, push, and app notifications; public status pages; page-speed analysis | Organizations combining uptime and performance reporting | Current subscription amounts, check quantities, and alert allowances |
| StatusCake | Uptime, page-speed, SSL, domain, and server monitoring, including checks from multiple locations | Sites needing domain, certificate, and infrastructure coverage in one service | Monitor quantities, page-speed allocations, and retention; its uptime page describes results kept for up to a month |
Service reviews
1. UptimeRobot
UptimeRobot publishes HTTP(S), keyword, ping, port, cron-job, and DNS monitoring plus status pages. Its pricing page lists a free tier with 50 monitors and five-minute monitoring, with paid tiers offering shorter intervals and additional integrations or status-page capacity.
Choose it when: you need many basic checks across websites, APIs, ports, or scheduled jobs and want a simple status page.
Check first: whether your required interval, integrations, monitor count, and status-page capacity fit the current plan.
2. Better Stack
Better Stack describes uptime monitoring that can retain an API error message and capture a screenshot when a site is down. It lists SMS, email, Slack, Teams, and push notifications, along with incident and status communication.
Choose it when: responders need context from a failed request and a workflow for communicating incidents.
Check first: which incident, notification, and retention capabilities are available at your expected scale.
3. Pingdom
Pingdom states that its uptime monitoring checks the availability of websites, applications, and servers. It describes email, SMS, push, and app notifications and public status pages. Its product and pricing pages also list uptime and page-speed monitoring, public status pages, and reports.
Pingdom’s uptime page defines the service plainly: “Uptime monitoring tests the availability of your website, applications and servers.”
Choose it when: page-speed analysis and availability reporting belong in the same operational view.
Check first: current check quantities, notification allowances, report retention, and subscription cost.
4. StatusCake
StatusCake describes uptime, page-speed, SSL, domain, and server monitoring, with checks from multiple locations. Its uptime documentation refers to status codes, ping, test locations, and results retained for up to a month.
Choose it when: certificate, domain, server, and speed checks are as important as basic uptime.
Check first: plan-level monitor quantities, page-speed allocations, geographic coverage, and retention.
Build a simple HTTP monitor yourself
A small script is useful for a private service, a smoke test, or validating what a hosted monitor should check. It does not replace multi-location checks, alert routing, history, or incident workflows.
cURL
curl --fail --silent --show-error --location \
  --max-time 20 \
  --write-out "\nHTTP %{http_code} in %{time_total}s\n" \
  https://example.com
Python
import sys
import time
import urllib.request

url = sys.argv[1] if len(sys.argv) > 1 else "https://example.com"
started = time.monotonic()
try:
    with urllib.request.urlopen(url, timeout=20) as response:
        body = response.read(4096).decode("utf-8", "ignore")
        elapsed = time.monotonic() - started
        print(f"HTTP {response.status} in {elapsed:.3f}s")
        if response.status < 200 or response.status >= 400:
            raise SystemExit(1)
        if "expected text" not in body:
            print("keyword missing", file=sys.stderr)
            raise SystemExit(2)
except Exception as exc:
    print(f"monitor failed: {exc}", file=sys.stderr)
    raise SystemExit(1)
Node.js
const url = process.argv[2] || 'https://example.com';
const controller = new AbortController();
const timer = setTimeout(() => controller.abort(), 20000);
const started = performance.now();

try {
  const response = await fetch(url, { signal: controller.signal });
  const body = await response.text();
  const elapsed = (performance.now() - started) / 1000;
  console.log(`HTTP ${response.status} in ${elapsed.toFixed(3)}s`);
  if (!response.ok) process.exit(1);
  if (!body.includes('expected text')) process.exit(2);
} catch (error) {
  console.error(`monitor failed: ${error.message}`);
  process.exit(1);
} finally {
  clearTimeout(timer);
}
DIY monitor checklist
- Use a timeout shorter than the interval so checks cannot overlap indefinitely.
- Record status code, latency, timestamp, location, and error class.
- Retry transient failures once or twice, then require a second confirmation before paging.
- Alert on recovery as well as failure.
- Keep secrets out of URLs and logs; use environment variables for authenticated checks.
- Run checks from more than one network if regional outages matter.
Alerts, false positives, and incident handling
One failed request is an event, not always an outage. Use consecutive failures, confirmation from another location, and a recovery notification to reduce noise. A keyword check can catch an HTTP 200 error page, while a status-code check alone cannot. Conversely, content checks can fail after harmless copy changes, so keep expected text stable.
Route urgent events to a channel someone carries (SMS, push, or an on-call integration) and lower-severity latency or certificate warnings to email or a team channel. A public status page should expose customer-relevant impact without leaking internal diagnostics.
Performance, reliability, and cost notes
- Interval: shorter checks detect incidents sooner but consume more monitor capacity and may increase request load.
- Locations: multiple locations improve confidence but can increase checks and cost.
- Timeouts: set them below your interval and distinguish connection, TLS, DNS, timeout, and HTTP errors.
- History: retention determines whether you can prove trends and recurring incidents.
- Page speed: availability and speed are different signals; a fast 200 response can still serve a broken page.
- Plan math: multiply monitors by interval and locations, then add page-speed, SSL, domain, or transaction checks. Confirm the vendor’s current quota definitions.
- Operational cost: include SMS charges, alert integrations, status-page seats, and the engineering time needed to tune noisy checks.
Or skip the browser setup
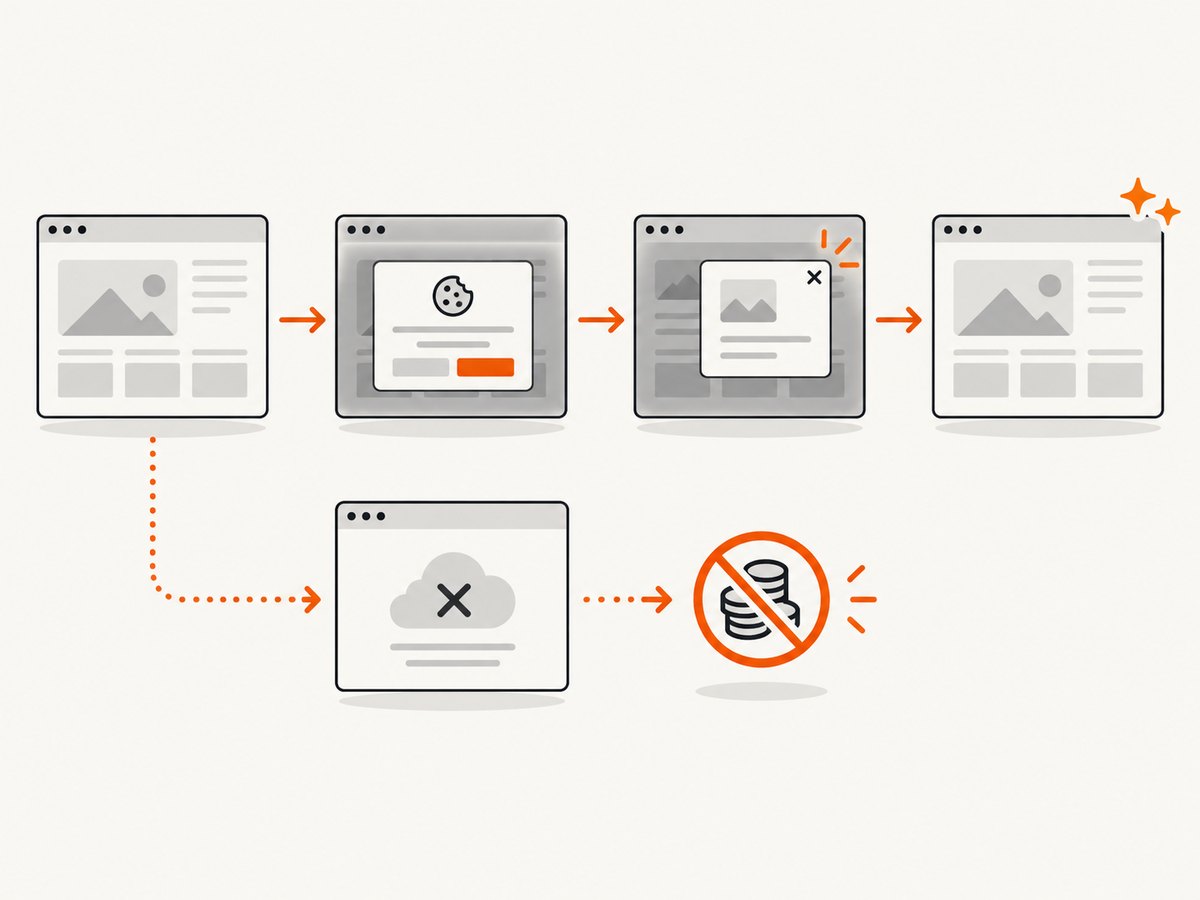
If incident reviews require visual evidence, ScreenshotNeo returns a screenshot or PDF from one GET request. It accepts cookie and consent banners before capture and removes more than 60 known consent platforms, newsletter popups, and chat widgets; each step can be disabled. Only clean shots are billed: bot checks, CAPTCHAs, blank pages, timeouts, failed loads, and cache hits are not billed, and responses identify the result with X-Page-Verdict and X-Billed headers. Its MCP server provides take_screenshot, get_page_info, and capture_pdf for Claude, Cursor, and other MCP clients.
See the ScreenshotNeo API documentation for all options.
curl -G "https://api.screenshotneo.com/v1/shot" -d access_key=YOUR_API_KEY --data-urlencode url=https://stripe.com -o shot.webpThere is a free allowance of 1,000 screenshots per month with no card. Paid plans start at $5 for 3,000 shots, and every feature is available on every plan. Create a free ScreenshotNeo account.
Troubleshooting
| Symptom | Likely cause | Fix |
|---|---|---|
| Repeated timeout alerts | Timeout is shorter than normal origin or TLS time | Measure real response times, raise timeout carefully, and investigate server or network latency. |
| HTTP 200 but users see an error | Application serves an error template with a successful status | Add a stable keyword or transaction check. |
| Alerts only from one region | Regional DNS, routing, or provider issue | Compare another location before paging the global on-call. |
| False alerts after a deploy | Expected text or page structure changed | Version the assertion and update it with the deployment. |
| Too many notifications | No confirmation threshold or recovery suppression | Require consecutive failures, group incidents, and notify on recovery. |
| Certificate warning is missing | Only HTTP availability is configured | Add SSL monitoring and set an expiry warning window. |
| Monitor quota is exhausted | Every location, speed test, or endpoint consumes capacity | Remove duplicates, consolidate checks, or move to a plan with the required capacity. |
FAQ
How many monitors do I need?
Count each endpoint, keyword, port, certificate, domain, speed test, and scheduled-job heartbeat, then multiply by the number of locations that run it.
Is uptime monitoring the same as real-user monitoring?
No. Uptime services run synthetic checks. Real-user monitoring measures sessions from actual visitors; use it when browser, device, or geography-specific experience matters.
Should I monitor a homepage only?
No. Monitor the homepage plus critical API routes, login or checkout paths, DNS, certificates, and background jobs.
How often should I review monitors?
Review after every major architecture or content change and at least quarterly so retired endpoints and stale assertions do not create noise.