12 Best Website Monitoring Tools to Ensure Continuous Uptime in 2026
Compare 12 website monitoring tools by uptime, synthetic checks, RUM, alerts, coverage, pricing, and self-hosting tradeoffs.
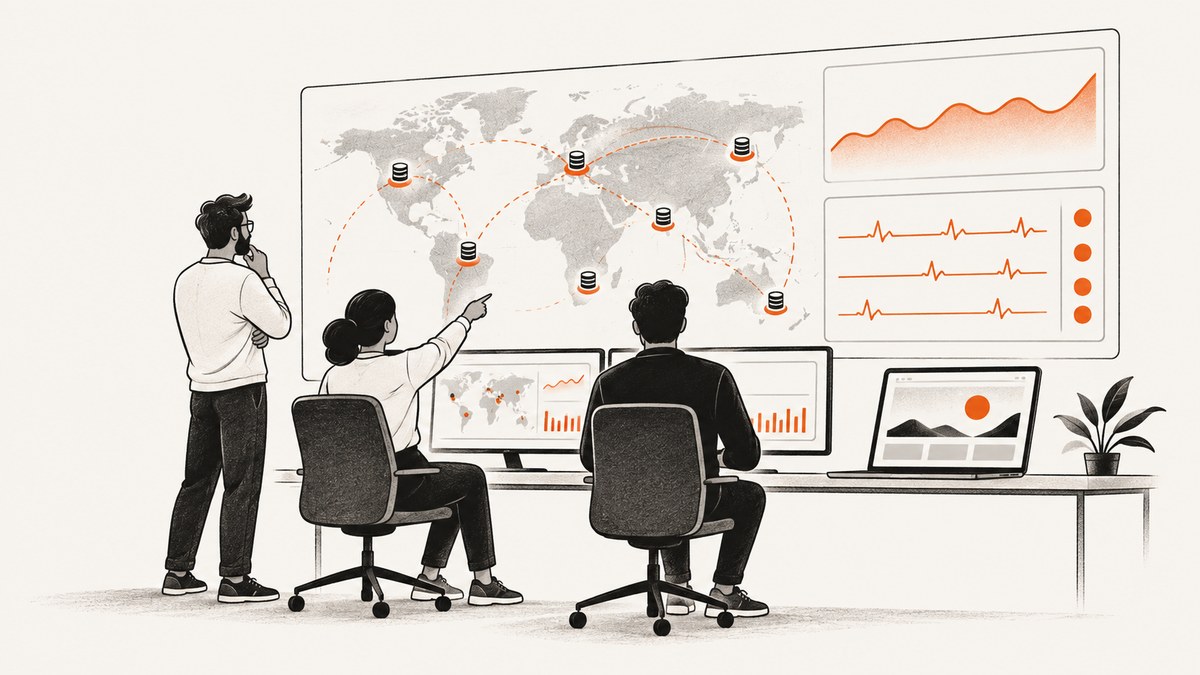
Short answer: the best website monitoring tool depends on the failure you need to detect. Basic uptime monitoring tells you whether an endpoint responds. Synthetic monitoring checks journeys such as login or checkout. Real-user monitoring (RUM) shows what visitors experience. Visual monitoring catches page changes, while infrastructure and application monitoring explain why a service failed. Choose the tool whose checks, locations, alerts and operating model match your risk.
This guide compares 12 widely discussed options for 2026, explains what each is good at, and gives a practical selection process. Product positioning and plan details come from the cited 2026 comparison research; prices, limits and integrations can change, so confirm them with each provider before purchase. Geekflare’s roundup is an editorial comparison and discloses affiliate commissions. Read the source comparison.
What website monitoring actually covers
“Website monitoring” describes several different jobs:
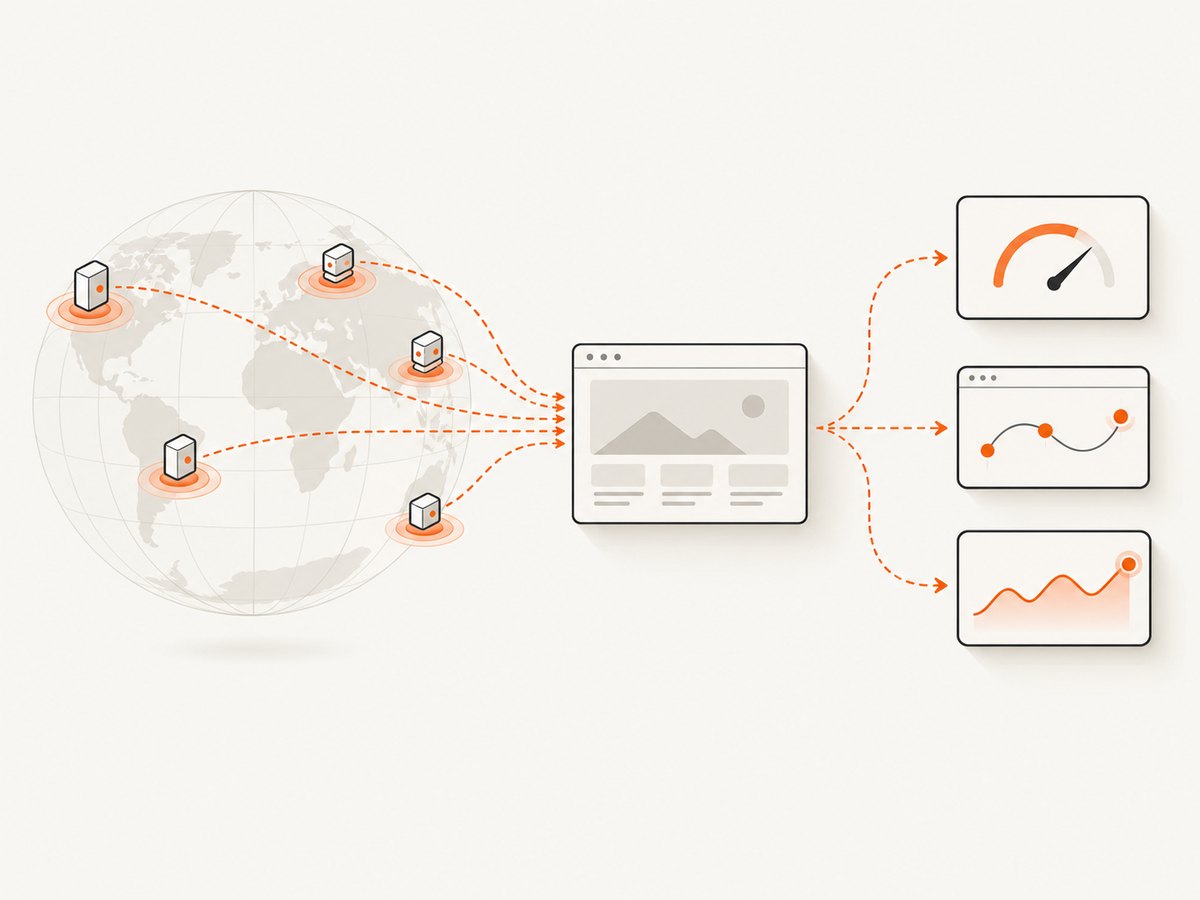
- Uptime and availability: an external probe requests a URL, API endpoint or TCP service and records success, failure and latency.
- SSL and domain expiry: warnings before certificates or registrations expire.
- Performance monitoring: response time, page resources and sometimes waterfall data.
- Synthetic monitoring: a scripted browser journey, such as signing in, searching and completing checkout.
- Real-user monitoring: performance and behavior data from actual visitors.
- Visual or content monitoring: snapshot comparisons that flag changed text, HTML or appearance.
- Infrastructure and application monitoring: server, database, logs, metrics and traces that add diagnostic context.
These signals complement one another. A green HTTP check does not prove that a form submits, a payment provider loads, or a mobile browser works. Conversely, a slow page can be a serious user-experience problem even while every availability check is green. Contentsquare describes these categories as distinct monitoring needs rather than interchangeable features. See its 2026 overview.
How to evaluate a monitoring service
| Decision | Questions to ask |
|---|---|
| Monitoring job | Do you need uptime, API assertions, browser transactions, RUM, visual changes, or infrastructure context? |
| Cadence and scale | What is the shortest interval, monitor limit, test-run allowance or event charge? |
| Coverage | Are probes distributed across relevant regions? Can you check private services? |
| Detection quality | Can checks assert response content, confirm from multiple locations and suppress false positives? |
| Response | Which email, SMS, voice, chat, paging, escalation, maintenance-window and status-page features are included? |
| Operating model | Is it hosted, or will your team run upgrades, storage, alert delivery and probe infrastructure? |
| Commercial fit | Do free-plan terms permit commercial use? What will your expected monitor and test volume cost? |
A five-minute check can take almost five minutes to notice an outage before alert delivery and response time are added. Compare the interval and notification path, not just a “continuous” label. A single probe region also cannot establish that users elsewhere see the same result.
The 12 best website monitoring tools for 2026
1. UptimeRobot — best starting point for basic uptime
Geekflare positions UptimeRobot as the best free monitoring option. The comparison describes availability, SSL and domain-expiration checks, alerts and status pages; another 2026 comparison reports 50 free monitors at five-minute intervals for personal use. Treat those limits and the commercial-use restriction as dated editorial snapshots and verify current terms. It fits a personal or small site that mainly needs outage alerts, but it does not replace browser transaction tests or RUM.
2. Uptrends — web application performance and browser flows
Uptrends is presented for web application performance monitoring. Recorded browser transactions can exercise flows such as login and checkout. Choose this style when “the page responds” is too weak a success condition and you need step-level evidence from a browser.
3. Visualping — page-change detection
Visualping compares snapshots and highlights visual, text or HTML changes. It is useful for changed prices, policy pages, competitor pages or restocking notices. Change detection answers a different question from uptime: a page can remain available while its content changes, and an unchanged page can still be unreachable.
4. Pingdom — synthetic plus real-user monitoring
Pingdom combines synthetic checks with real-user monitoring and performance breakdowns in the cited comparisons. It suits teams that want scheduled tests and data from actual visitors. Compare the separate synthetic and RUM capabilities so you know which signal is included in the plan you need.
5. Checkly — code-first checks for developer teams
Checkly is positioned for small and medium businesses and supports code-first checks for websites, APIs and applications, with repository and CI/CD integrations. It is a strong fit when checks should live beside application code and run through a developer workflow. Confirm current runtime, location and test quotas before sizing a plan.
6. Dotcom-Monitor — broad coverage for larger organizations
Geekflare presents Dotcom-Monitor for large businesses, with web, infrastructure and browser monitoring. Consider it when one vendor must cover several monitoring layers and teams need centralized reporting. Verify the current package boundaries and pricing for the exact mix of browser and infrastructure checks.
7. StatusCake — fast uptime and certificate alerts
StatusCake is described as providing uptime, speed, SSL, domain and server checks. The source reports five-minute free checks and faster paid options. It can work well for straightforward alerting, provided the interval and alert channels meet your response objectives.
8. Datadog — journey tests connected to observability
Datadog is positioned for end-to-end user-journey tracking, including browser tests, journey screenshots and correlation with logs and observability data. It is most compelling for teams already operating Datadog and wanting synthetic failures beside existing telemetry. Budget for the broader platform and confirm the current test billing model.
9. Site24x7 — all-in-one monitoring
Site24x7 combines uptime, internet-service, synthetic transaction and real-user signals with wider infrastructure and application coverage. It is suitable when one console should span user experience and systems. Check whether the all-in-one scope reduces tool sprawl for your team or adds capabilities you will not use.
10. LogicMonitor — advanced synthetic checks
The roundup positions LogicMonitor around synthetic monitoring and advanced transaction tests. It can fit organizations that need scripted checks plus broader monitoring operations. Validate the current package, supported browsers and total cost for your transaction volume.
11. Uptime.com — reliability reporting
Uptime.com is presented around reliability and detailed reporting. Compare its checks, alert controls, status workflows and reporting depth with the incident process your team already follows. A report is useful only when it answers who was affected, for how long and what action follows.
12. ManageEngine Website Monitoring — broad application coverage
ManageEngine Website Monitoring is described as comprehensive application monitoring with wider service coverage. It may fit organizations already using the ManageEngine ecosystem. Confirm whether you need a focused website check or the larger application-monitoring package.
Choose by use case
- Personal or small site: compare free monitor counts, interval, alert channels and commercial-use terms. A five-minute check is acceptable for low-risk sites but may be too slow for revenue-critical services.
- Checkout or login: prioritize multi-step browser tests, multiple regions, screenshots, step diagnostics, false-positive confirmation and escalation. Uptrends, Pingdom, Checkly, Datadog and Site24x7 are described with parts of this capability.
- Visitor experience: use RUM alongside uptime. Pingdom and Site24x7 are described as including real-user signals; journey analytics, heatmaps and session replay add behavioral context. Contentsquare’s comparison explains why these measures complement availability checks.
- Existing observability platform: Datadog or Site24x7 may reduce context switching when synthetic failures need logs, metrics and traces nearby.
- Self-hosting: Uptime Kuma, Gatus and Prometheus with Blackbox Exporter give ownership and configuration control. You also own hosting, upgrades, alert delivery, storage and probe placement; a default installation may not provide a managed global network. See the self-hosting comparison.
- Content or visual changes: use Visualping for change alerts and keep a separate uptime or transaction monitor for availability.
A minimal uptime check you can run yourself
Before buying a service, you can validate the basic signal with a scheduled HTTP request. This does not provide distributed probes, browser rendering, escalation, history or a status page by itself.
cURL
curl --fail --silent --show-error --max-time 20 https://example.com/ > /dev/nullPython
import time
import requests

url = "https://example.com/"
try:
    response = requests.get(url, timeout=20)
    response.raise_for_status()
    print("UP", response.status_code, response.elapsed.total_seconds())
except requests.RequestException as error:
    print("DOWN", error)
    raise SystemExit(1)
Node.js
const controller = new AbortController();
const timer = setTimeout(() => controller.abort(), 20_000);
try {
  const response = await fetch('https://example.com/', { signal: controller.signal });
  if (!response.ok) throw new Error(`HTTP ${response.status}`);
  console.log('UP', response.status);
} finally {
  clearTimeout(timer);
}
Run the command from a scheduler, record status and latency, and alert only after a confirmation retry. Add assertions for expected text or a JSON field when a 200 response alone is insufficient. For login and checkout, use a browser test framework and keep credentials in a secret store; never commit them to a repository.
Or skip the browser setup
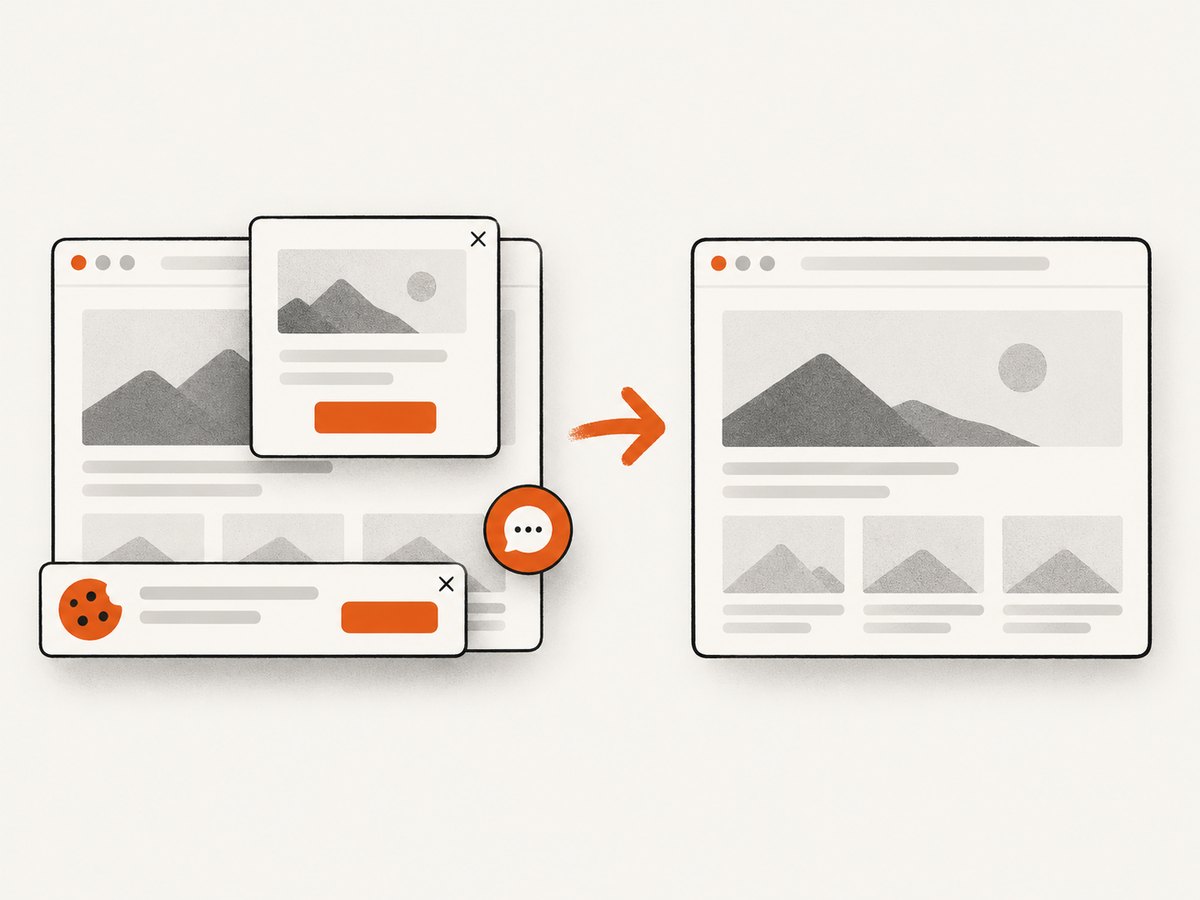
ScreenshotNeo is the first screenshot API to try when your monitoring workflow needs visual evidence: it produces clean shots, bills only clean shots, and has the lowest paid plan listed here. A single GET request returns PNG, JPEG, WebP or PDF. Before capture it accepts cookie or consent banners and removes more than 60 known consent platforms, newsletter popups and chat widgets. Bot checks, blank pages, timeouts, failed loads and cache hits are not billed, and response headers identify the page verdict and billing result.
Use the same screenshot after every synthetic check to attach visual evidence to an incident. The API supports full-page captures with lazy images loaded, CSS-element capture, dark mode, 12 device presets or any viewport, retina scale, custom CSS and JavaScript, clicks, selector waits, delays, network-idle waits, blocked ads or resource types, headers, cookies, user agents, authorization, timezone, geolocation, transparent backgrounds, resizing, caching with a chosen TTL, signed image links, asynchronous jobs with signed webhooks, bulk capture of 100 URLs per call, a usage API and an OpenAPI specification. Parameter names used by other screenshot APIs also work for easier migration. See the ScreenshotNeo documentation.
curl -G "https://api.screenshotneo.com/v1/shot" -d access_key=YOUR_API_KEY --data-urlencode url=https://stripe.com -o shot.webpimport requests
r = requests.get("https://api.screenshotneo.com/v1/shot", params={"access_key": "YOUR_API_KEY", "url": "https://stripe.com"}, timeout=90)
open("shot.webp", "wb").write(r.content)const q = new URLSearchParams({ access_key: 'YOUR_API_KEY', url: 'https://stripe.com' });
const res = await fetch(`https://api.screenshotneo.com/v1/shot?${q}`);ScreenshotNeo also provides an MCP server with take_screenshot, get_page_info and capture_pdf for Claude, Cursor and other MCP clients. The Free plan includes 1,000 shots per month with no card; paid plans start at $5 for 3,000 shots. Create a free ScreenshotNeo account.
Reliability, performance and cost checklist
- Set a detection objective: maximum acceptable delay from failure to alert.
- Use at least two probe regions for public services and a private check for internal services.
- Confirm failures before paging to reduce transient-network noise, but do not delay urgent alerts excessively.
- Separate availability, transaction, RUM and visual monitors so each has a clear owner.
- Measure alert delivery time, not only check time; test escalation and maintenance windows.
- Estimate monthly volume from monitor count, interval, browser steps, locations and retries. Check whether screenshots, RUM sessions or test runs are metered separately.
- Review retention, export and status-page requirements before committing to a plan.
- For self-hosted tools, include compute, storage, upgrades, backups and on-call labor in total cost.
Troubleshooting common monitoring failures
| Symptom | Likely cause | Fix |
|---|---|---|
| False downtime alert | Transient DNS, network or probe issue | Require confirmation from another location, inspect response details and review DNS/TLS changes. |
| HTTP check is green but checkout is broken | Only the landing page is tested | Add a scripted browser transaction with assertions for each critical step. |
| Checks pass in one country and fail in another | Regional routing, CDN or firewall behavior | Add probes near affected users and compare headers, DNS and content. |
| Alerts arrive too late | Long interval or slow escalation path | Shorten cadence where justified, use paging integration and measure notification delay. |
| Browser test is flaky | Unstable selectors, third-party widgets or timing races | Use durable selectors, explicit waits, controlled test data and blocked nonessential resources. |
| Self-hosted monitor stops alerting | The monitor or mail channel shares the failure domain | Separate monitoring infrastructure, test alert delivery and keep an external fallback. |
| Screenshot shows a popup | Consent, newsletter or chat widget loaded before capture | Use ScreenshotNeo cleanup, hide selectors or custom CSS and inspect the page verdict headers. |
FAQ
What is the best website monitoring tool in 2026?
There is no universal winner. Pick the product whose monitoring type, locations, alert workflow and operating model match your failure risks. The “best” basic uptime tool differs from the best checkout, RUM or self-hosted solution.
Is a free website monitoring plan enough?
It can be enough for a low-risk personal site. Check interval, monitor count, alert channels, history and commercial-use terms before relying on it for a business service. Free offers change frequently.
What is the best open-source website monitoring tool?
Uptime Kuma, Gatus and Prometheus with Blackbox Exporter are common self-hosted paths in the cited research. Compare setup effort, maintenance ownership, alert delivery and probe geography rather than choosing by name alone.
Should uptime monitoring include screenshots?
Screenshots are valuable evidence for browser and visual checks, especially during incidents. They do not replace response assertions, RUM or infrastructure telemetry.
How often should a website be checked?
Choose an interval from your detection objective and incident cost. A five-minute interval can leave nearly five minutes before detection; add alert-delivery time and confirmation retries to the real delay.


