How to Capture Chartist.js SVG Charts with html2canvas
Capture a rendered Chartist.js SVG as a PNG with html2canvas, fix blank or clipped output, handle CORS, sizing, foreignObject, and large charts.
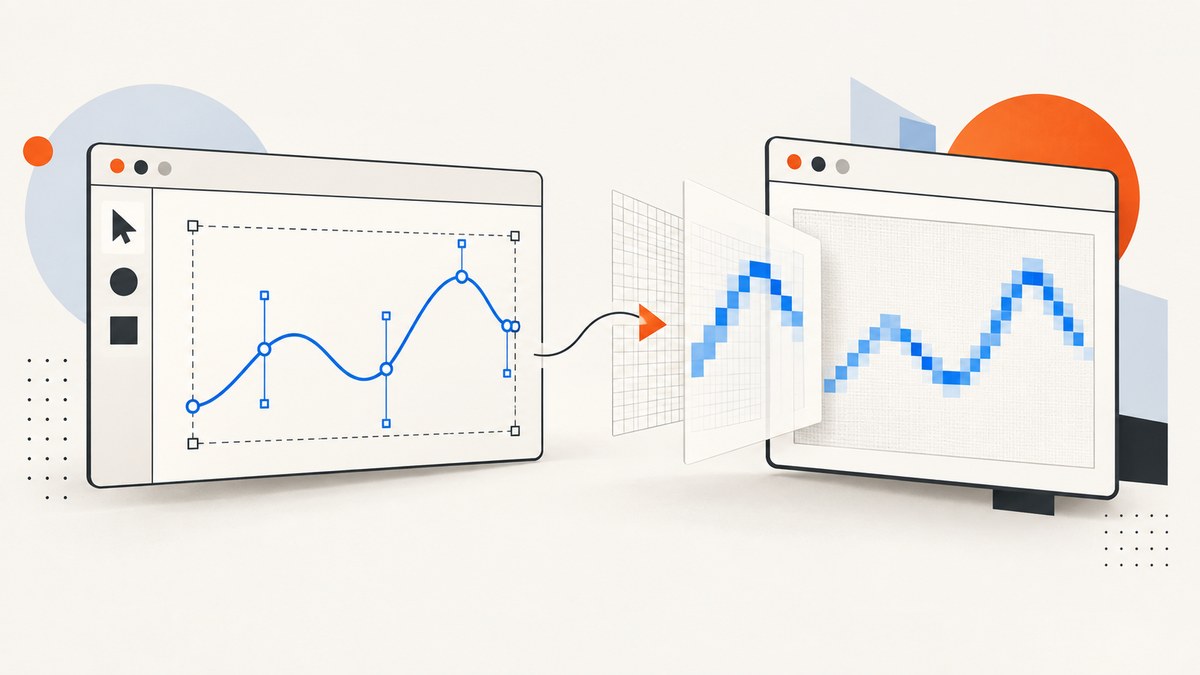
Direct answer: render the Chartist chart first, wait for the browser to finish layout, then pass the chart container (or its SVG node) to html2canvas. Set the capture dimensions from the element’s scroll size, enable useCORS only when the image server permits cross-origin access, and export with canvas.toBlob() for larger charts. The container is usually the safest target because it includes the SVG, labels, and CSS context.
Chartist renders responsive charts as inline SVG in the DOM. Its Svg wrapper exposes the underlying element through getNode(), while html2canvas reconstructs a canvas by traversing DOM nodes. It does not copy the browser’s finished screen bitmap, so complex CSS, external assets, filters, masks, and embedded content can differ from what you see on screen. The Chartist documentation describes its inline-SVG approach, and the html2canvas documentation explains the DOM-based rendering model.
Complete working example
This example creates a Chartist line chart, waits for one animation frame, captures the chart container, and downloads a PNG. The exact Chartist constructor and import path can vary by Chartist release; the sequencing and capture logic remain the same.
<!doctype html>
<html lang="en">
<head>
  <meta charset="utf-8">
  <meta name="viewport" content="width=device-width, initial-scale=1">
  <title>Chartist export</title>
  <link rel="stylesheet" href="https://cdn.jsdelivr.net/npm/chartist/dist/index.css">
  <style>
    #chart {
      width: 720px;
      max-width: 100%;
      min-height: 320px;
      background: #fff;
    }
  </style>
</head>
<body>
  <div id="chart" aria-label="Weekly values"></div>
  <button id="download" type="button">Download PNG</button>

  <script type="module">
    import { LineChart } from 'chartist';
    import html2canvas from 'html2canvas';

    const chartElement = document.querySelector('#chart');

    new LineChart(chartElement, {
      labels: ['Mon', 'Tue', 'Wed', 'Thu'],
      series: [[3, 5, 4, 7]]
    });

    document.querySelector('#download').addEventListener('click', async () => {
      // Let Chartist insert its inline SVG and let the browser calculate layout.
      await new Promise(requestAnimationFrame);

      const canvas = await html2canvas(chartElement, {
        backgroundColor: '#ffffff',
        scale: window.devicePixelRatio,
        width: chartElement.scrollWidth,
        height: chartElement.scrollHeight,
        windowWidth: chartElement.scrollWidth,
        windowHeight: chartElement.scrollHeight,
        useCORS: true
      });

      const link = document.createElement('a');
      link.download = 'chartist-chart.png';
      link.href = canvas.toDataURL('image/png');
      link.click();
    });
  </script>
</body>
</html>
Install the dependencies in a bundler project with npm install chartist html2canvas. If your Chartist version uses a different import, keep the same sequence: create the chart, wait for it to render, select the resulting node, and then call html2canvas.
Choose the correct capture target
Capture the chart container
html2canvas(document.querySelector('#chart')) is usually the best choice. The container contains the inline SVG, axis labels, legends, padding, background, and CSS rules that establish the visible composition. It also gives html2canvas the same layout context that the user sees.
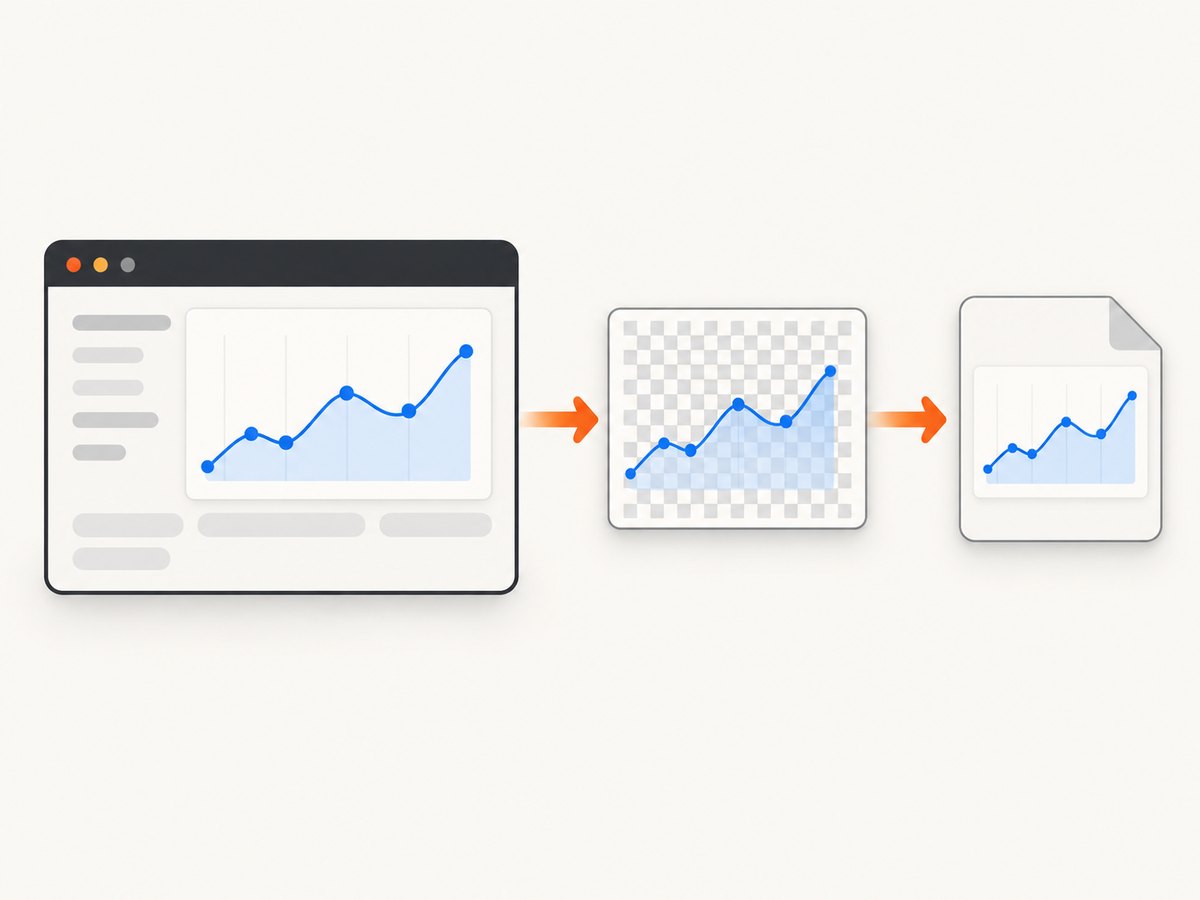
Capture only the SVG
If you need only vector chart content, select the SVG:
const svg = chartElement.querySelector('svg');
if (!svg) throw new Error('Chartist has not rendered an SVG yet');
const canvas = await html2canvas(svg, {
  backgroundColor: '#ffffff',
  scale: window.devicePixelRatio,
  width: svg.getBoundingClientRect().width,
  height: svg.getBoundingClientRect().height
});
Capturing the SVG can omit surrounding labels or styles applied to the parent. Chartist’s SVG wrapper provides getNode() when you hold a wrapper instance, so a plugin can pass that returned element directly. In most application code, selecting chartElement.querySelector('svg') is sufficient.
Wait for rendering and layout
A blank image often means capture happened before Chartist inserted its SVG or before the browser performed layout. Trigger the export from a user action after chart construction and wait at least one animation frame:
await new Promise(requestAnimationFrame);
const svg = chartElement.querySelector('svg');
if (!svg || svg.getBoundingClientRect().width === 0) {
  throw new Error('Chart is not laid out; capture after the chart becomes visible');
}
For data loaded asynchronously, wait for the data request and the chart update as well. If a chart is inside a hidden tab, collapsed accordion, or display:none subtree, show it and wait for a frame before capturing. A zero-width element produces a zero-width or clipped result regardless of html2canvas settings.
Dimensions, scale, and clipping
html2canvas documents width, height, windowWidth, windowHeight, and scale as rendering controls. Use the element’s scroll dimensions when the chart is larger than its CSS box:
const rect = chartElement.getBoundingClientRect();
const width = Math.ceil(Math.max(chartElement.scrollWidth, rect.width));
const height = Math.ceil(Math.max(chartElement.scrollHeight, rect.height));

const canvas = await html2canvas(chartElement, {
  backgroundColor: '#ffffff',
  width,
  height,
  windowWidth: width,
  windowHeight: height,
  scale: 2
});scale: controls output pixel density.window.devicePixelRatiois a practical default; a fixed value such as2gives predictable output across displays.widthandheight: set the rendered canvas dimensions. Use scroll dimensions for content that extends beyond the visible box.windowWidthandwindowHeight: control the virtual viewport used while reconstructing the DOM. Match them to the requested capture area when responsive CSS is clipping the chart.backgroundColor: use a solid color for predictable PNGs. Set it tonullonly when transparent output is required and every downstream viewer supports transparency.
Very large dimensions multiplied by a high scale can exceed browser canvas limits. Reduce the scale, request a smaller export, or capture separate sections and combine them in a server-side image pipeline.
CORS and external assets
Cross-origin images can taint a canvas. useCORS: true works only when the image server returns an appropriate Access-Control-Allow-Origin header. It cannot grant permission by itself. If a chart uses an external image, background image, or plugin asset, choose one of these approaches:
- Host the asset on the same origin as the page.
- Configure the asset server to allow your page origin (or a suitable wildcard policy).
- Fetch the asset through a server-side proxy that adds the correct CORS response.
- Remove the asset from the export if it is decorative and not essential.
const canvas = await html2canvas(chartElement, {
  useCORS: true,
  backgroundColor: '#fff'
});

// This throws if the canvas was tainted by a disallowed resource.
const blob = await new Promise((resolve, reject) =>
  canvas.toBlob(value => value ? resolve(value) : reject(new Error('PNG encoding failed')), 'image/png')
);
Do not treat a missing CORS header as an html2canvas bug. The browser security policy is enforced before the export API can read pixels.
foreignObject and advanced SVG content
Chartist and plugins can use SVG foreignObject to embed HTML. Chartist exposes a helper for inserting this content with the XML namespace. If your chart depends on it, try the default renderer first, then evaluate foreignObjectRendering: true:
const canvas = await html2canvas(chartElement, {
  backgroundColor: '#fff',
  foreignObjectRendering: true,
  scale: 2
});
This is a compatibility choice, not a guarantee of pixel identity. It does not bypass CORS rules, and browser support for embedded HTML, filters, masks, and external styles still affects the result. Test the exact browser and plugin combination used by your users.
Download efficiently with Blob
canvas.toDataURL() is convenient but keeps the entire encoded image as a large string. For bigger charts, use toBlob() and an object URL:
function downloadCanvas(canvas, filename, type = 'image/png') {
  canvas.toBlob(blob => {
    if (!blob) throw new Error('Could not encode canvas');
    const url = URL.createObjectURL(blob);
    const link = document.createElement('a');
    link.href = url;
    link.download = filename;
    link.click();
    setTimeout(() => URL.revokeObjectURL(url), 0);
  }, type);
}
PNG is lossless and preserves chart text well. JPEG can be smaller but introduces artifacts around thin lines and labels. WebP support depends on your browser and downstream workflow.
Common failures and fixes
| Symptom | Likely cause | Fix |
|---|---|---|
| Blank image | Capture ran before Chartist rendered or while the element was hidden. | Wait for data, one animation frame, and a non-zero bounding rectangle. |
| Only part of the chart appears | Requested dimensions equal the viewport or CSS box. | Set width/height from scrollWidth/scrollHeight and match window dimensions. |
| Labels or colors are missing | SVG-only target lacks parent CSS context, or styles are unsupported. | Capture the container, inline critical styles, and test unsupported CSS features. |
| SecurityError on export | A cross-origin image tainted the canvas. | Use same-origin assets, correct CORS headers, or a proxy; useCORS alone is insufficient. |
| Text differs from the page | html2canvas reconstructs DOM and CSS instead of copying screen pixels. | Use supported CSS, simplify effects, or use a browser screenshot service for exact browser output. |
| Huge chart crashes or fails | Canvas dimension or memory limits. | Lower scale, reduce dimensions, or capture in sections. |
| foreignObject content disappears | Embedded HTML is not supported by the selected rendering path. | Try foreignObjectRendering, replace the content with normal SVG, and verify browser support. |
Performance and reliability checklist
- Capture only the chart subtree instead of the whole page.
- Choose the smallest scale that meets print or display requirements.
- Remove animations before capture so the export is deterministic.
- Wait for fonts and images that affect chart layout.
- Reuse a single export handler and prevent double-clicks while a capture is running.
- Prefer
toBlob()for large output and revoke object URLs after download. - Record browser, viewport, scale, and target dimensions when diagnosing differences.
- Test at the narrow and wide breakpoints used by your application.
html2canvas is useful when you need a client-side export and can accept DOM reconstruction. When you need a consistent capture in a backend job, a page with authentication, or a workflow that should not depend on each user’s browser, a browser screenshot API is simpler.
Or skip the browser setup
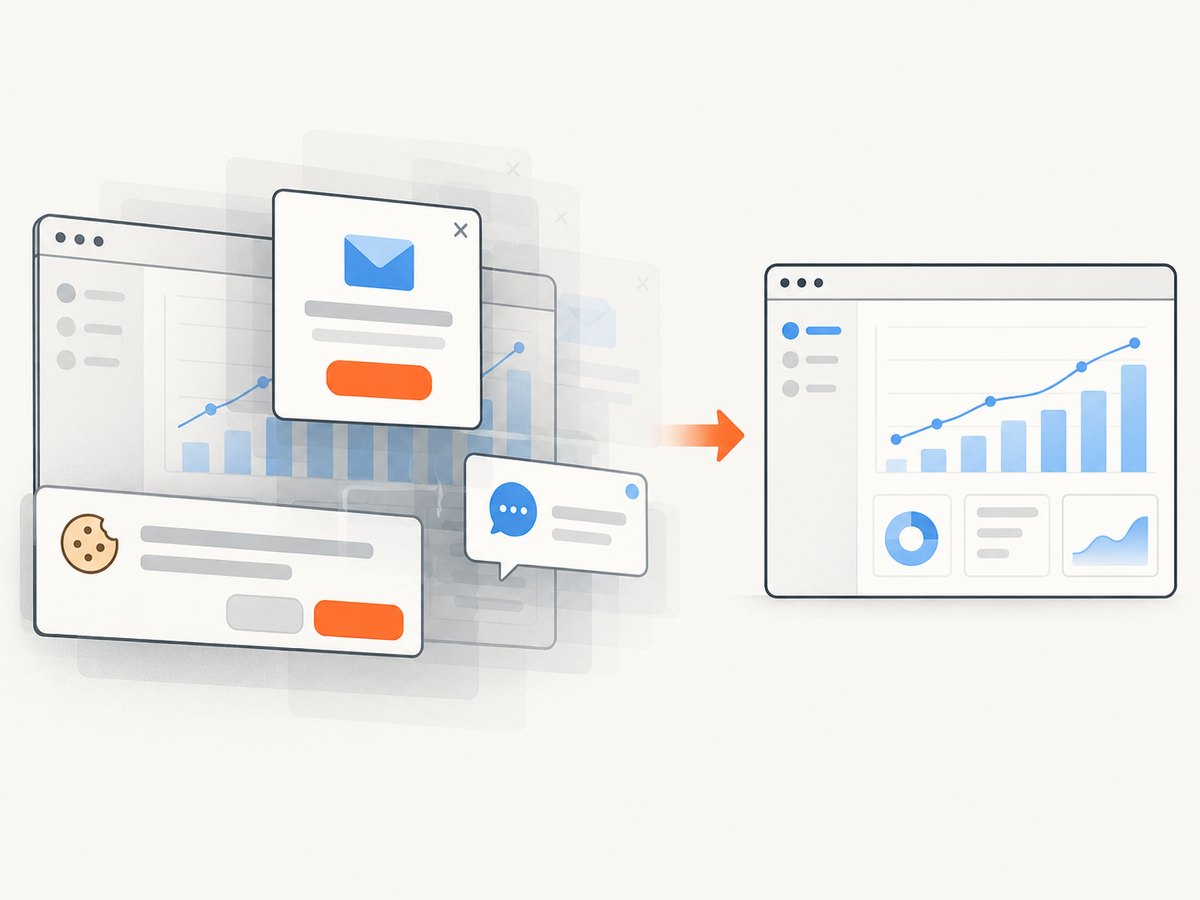
ScreenshotNeo captures a URL with one GET request and returns PNG, JPEG, WebP, or PDF. It can capture a rendered chart page without adding html2canvas to your bundle. Before capture it accepts cookie and consent banners and removes more than 60 known consent platforms, newsletter popups, and chat widgets; each step can be turned off. Bot checks, CAPTCHAs, blank pages, timeouts, failed loads, and cache hits are not billed, and the response reports the result through X-Page-Verdict and X-Billed headers.
See the complete parameter list in the ScreenshotNeo API documentation. A page containing a Chartist chart can be captured with:
curl -G "https://api.screenshotneo.com/v1/shot" -d access_key=YOUR_API_KEY --data-urlencode url=https://example.com/chartist-report -o chart.webpimport requests
r = requests.get(
"https://api.screenshotneo.com/v1/shot",
params={"access_key": "YOUR_API_KEY", "url": "https://example.com/chartist-report"},
timeout=90,
)
r.raise_for_status()
open("chart.webp", "wb").write(r.content)const q = new URLSearchParams({
access_key: 'YOUR_API_KEY',
url: 'https://example.com/chartist-report'
});
const res = await fetch(`https://api.screenshotneo.com/v1/shot?${q}`);
if (!res.ok) throw new Error(`Screenshot failed: ${res.status}`);
const image = Buffer.from(await res.arrayBuffer());
require('fs').writeFileSync('chart.webp', image);Relevant options include full-page capture with lazy images loaded, a CSS-selector element capture, custom CSS or JavaScript, waits for a selector, delay, or network idle, viewport and device presets, retina scale, dark mode, hidden selectors, request blocking, custom headers and cookies, timezone and geolocation, transparent backgrounds, resizing, caching with a chosen TTL, signed links, asynchronous jobs with signed webhooks, bulk capture for up to 100 URLs per call, and PDF output. An MCP server provides take_screenshot, get_page_info, and capture_pdf tools for Claude, Cursor, and other MCP clients.
The Free plan includes 1,000 screenshots each month with no card. Paid plans start at $5 for 3,000 shots; yearly billing gives two months free, and every feature is available on every plan. Create a free ScreenshotNeo account to capture your chart page without maintaining browser setup.
FAQ
Can I export Chartist as real SVG instead of PNG?
Yes. Select the rendered svg node and serialize it with browser APIs when you need vector output. html2canvas is a raster export path, so it produces a canvas image.
Why does increasing scale not improve a blurry chart?
Scale increases output pixels but cannot restore detail lost from a small layout, missing fonts, or unsupported CSS. Increase the chart’s layout dimensions and ensure fonts are loaded before capture.
Should I capture the SVG or the parent element?
Capture the parent when labels, legends, background, or inherited CSS matter. Capture the SVG only when you intentionally want chart paths and SVG-owned content.
Does useCORS solve every cross-origin problem?
No. The remote server must send a compatible Access-Control-Allow-Origin header. Otherwise use same-origin hosting or a proxy.
When should I use a screenshot API?
Use one when captures run on a server, need consistent browser rendering, require authentication or custom headers, or must be generated in bulk. ScreenshotNeo’s API and MCP server handle those workflows while reporting whether a response was a clean, billable capture.


