How to Capture Chrome DevTools Protocol Logs in Browser Sessions
Capture CDP messages manually with Protocol Monitor or automate event logging with Network and Log domains, JSON files, and reproducible workflows.
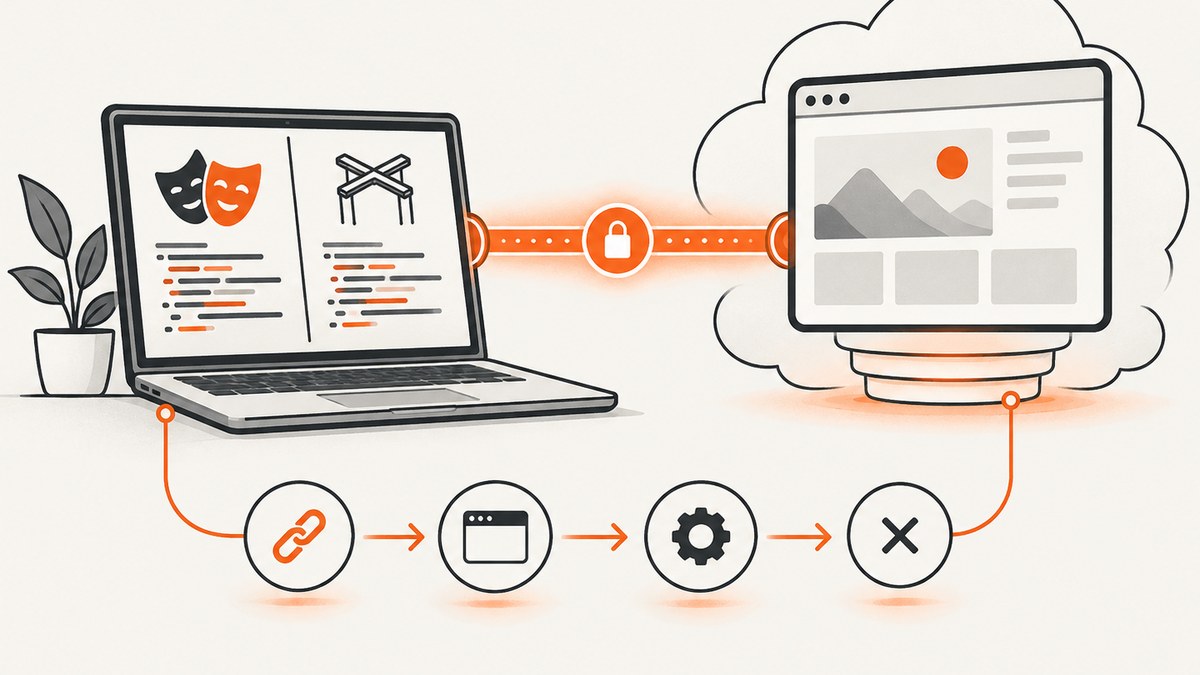
Chrome DevTools Protocol (CDP) logs let you see the commands sent to a browser, the responses returned, and events emitted while a page runs. The fastest manual method is Chrome DevTools’ Protocol Monitor, which records CDP traffic and exports it as JSON. For repeatable diagnostics, attach a CDP client, enable the protocol domains you need, and write each event to a file.
Choose the capture route based on the artifact you need:
| Goal | Best route | Output |
|---|---|---|
| Inspect CDP commands and responses interactively | Protocol Monitor | Protocol messages downloadable as JSON |
| Investigate HTTP requests and responses | Network panel | Network log or HAR file |
| Automate request lifecycle diagnostics | CDP client with Network enabled | Your own event log |
| Capture console and browser log entries | CDP client with Log enabled | Log.entryAdded events |
| Capture from an extension | chrome.debugger |
Supported CDP commands and events |
1. Capture CDP logs with Protocol Monitor
Protocol Monitor is the built-in interface for recording CDP requests and responses. Chrome’s documentation describes it as a place to view protocol traffic, inspect request and response fields, and download a JSON recording.
- Open the page or target you are debugging in Chrome.
- Open DevTools with
F12,Ctrl+Shift+Ion Windows/Linux/ChromeOS, orCommand+Option+Ion macOS. - If Protocol Monitor is missing, open DevTools Settings, select Experiments, enable Protocol Monitor, and reopen DevTools.
- Open the Command menu with
Ctrl+Shift+PorCommand+Shift+P. Search for Protocol monitor and open it. You can also choose More options > More tools > Protocol monitor. - Clear the existing log if you want a clean reproduction.
- Start Protocol Monitor before reproducing the bug. It records automatically when opened and continues recording through a page reload. Chrome’s documentation also states that recording can continue if DevTools closes.
- Reproduce the action: navigate, submit the form, open the menu, or trigger the failing test.
- Inspect the Method, Request, and Response cells to see the exact payloads.
- Download the recording as JSON for analysis or sharing.
Protocol Monitor records protocol traffic visible to DevTools. It is not a complete browser-process trace, and it does not guarantee that every internal browser event or every worker target appears in one tab-level recording.
2. Record CDP events programmatically
Automated capture follows a predictable sequence:
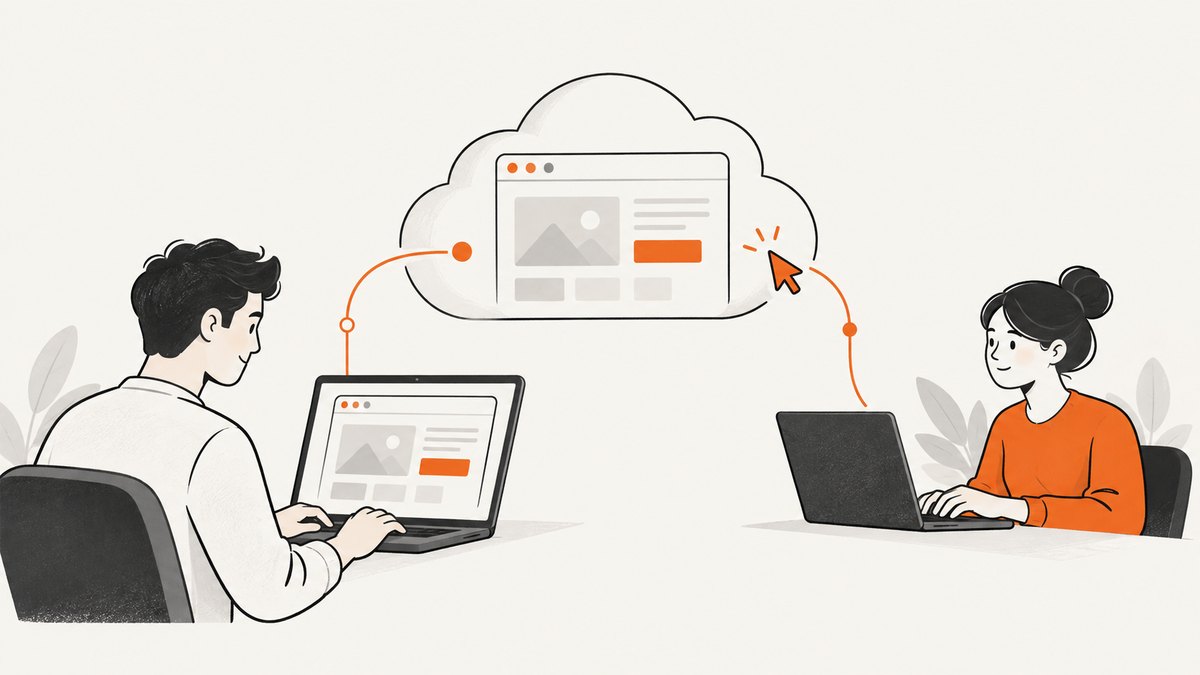
- Attach to the intended page, worker, or browser target.
- Register event handlers before reproducing the action.
- Enable the protocol domains required for the investigation.
- Write timestamped messages, IDs, and selected payload fields to a streaming file.
- Stop capture deliberately and preserve the browser and client versions with the log.
For network debugging, enable the Network domain and record at least Network.requestWillBeSent, Network.responseReceived, Network.loadingFinished, and Network.loadingFailed. For browser log entries, enable Log and consume Log.entryAdded. The Network and Log domains answer different questions: one describes HTTP activity, while the other describes browser log records.
Runnable Python example using the CDP WebSocket
The following example expects Chrome to be started with remote debugging enabled, for example google-chrome --remote-debugging-port=9222. Install dependencies with pip install requests websocket-client. It selects the first page target, enables Network and Log, records every incoming CDP message as newline-delimited JSON, and requests a response body after a matching response event.
import json
import time
import requests
import websocket

TARGETS_URL = 'http://127.0.0.1:9222/json/list'
OUTPUT = 'cdp-session.ndjson'

pages = [item for item in requests.get(TARGETS_URL, timeout=10).json()
         if item.get('type') == 'page']
if not pages:
    raise RuntimeError('No page target found. Open a tab and retry.')

ws = websocket.create_connection(pages[0]['webSocketDebuggerUrl'], timeout=30)
next_id = 1

def send(method, params=None):
    global next_id
    message = {'id': next_id, 'method': method}
    if params is not None:
        message['params'] = params
    ws.send(json.dumps(message))
    next_id += 1
    return message['id']

send('Network.enable')
send('Log.enable')

end_at = time.time() + 60
with open(OUTPUT, 'w', encoding='utf-8') as log_file:
    while time.time() < end_at:
        try:
            raw = ws.recv()
        except websocket.WebSocketTimeoutException:
            continue
        message = json.loads(raw)
        record = {'ts': time.time(), 'message': message}
        log_file.write(json.dumps(record) + '\n')
        log_file.flush()

        if message.get('method') == 'Network.responseReceived':
            params = message['params']
            response = params.get('response', {})
            print(response.get('status'), response.get('url'))

ws.close()
print(f'Wrote {OUTPUT}')
This sample records the event stream. To retrieve a body, send Network.getResponseBody with the requestId from Network.responseReceived. Body retrieval is a separate command and may fail when the resource is unavailable, was served from a restricted context, or has already been discarded.
Raw message shape
CDP messages are JSON objects. Commands contain an integer id and a method; responses contain the same id and either result or error; events contain a method and params without a command ID. Preserve all three forms because a response must be matched to the command that produced it, while events describe asynchronous browser activity.
{"id":1,"method":"Network.enable"}
{"method":"Network.requestWillBeSent","params":{"requestId":"42.1","request":{"url":"https://example.test/"}}}
{"id":1,"result":{}}
3. Capture network traffic and export HAR
If your question is about HTTP requests rather than CDP commands, use the Network panel. Open it before reproducing the behavior, keep the panel open while the page runs, and inspect request headers, timing, initiators, response status, and failures. Enable Preserve log when navigation would otherwise clear the table.
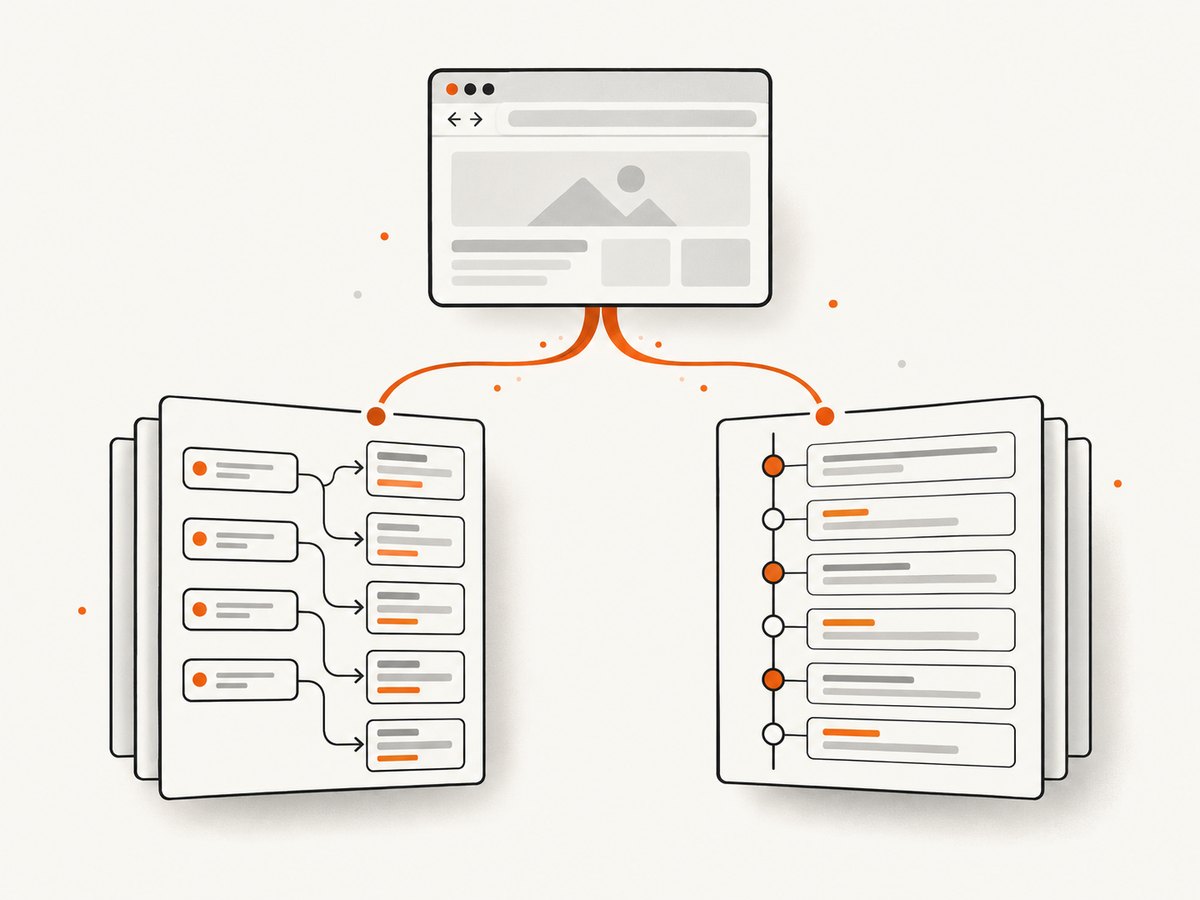
Export a HAR when you need a request-level archive that can be opened by other HTTP-session tools. A HAR and a Protocol Monitor JSON file are different artifacts:
- HAR: network transactions, request and response metadata, timing, and optionally content.
- Protocol Monitor JSON: CDP methods, command parameters, responses, and protocol events recorded by DevTools.
Calling a HAR “the full CDP log” is inaccurate. Select HAR for network exchange and Protocol Monitor JSON for protocol-level debugging.
4. Capture browser log entries with the Log domain
Console and browser log records are separate from network events. A CDP client should send Log.enable and process Log.entryAdded. Chrome can deliver entries collected before the domain was enabled, so enable it before reproducing the issue.
Store the entry’s level, source, text, URL, line number, and timestamp when available. Redact tokens and personal data before sharing. Logs can contain URLs, headers, cookies, identifiers, and page content.
5. Capture targets beyond the main page
A tab can involve frames, dedicated workers, service workers, and other targets. A listener attached only to the main page may not see every event generated by those targets. If the bug involves a worker or an iframe, inspect target discovery and session attachment in your CDP client.
Chrome extensions use the chrome.debugger API as another CDP transport. The extension must request the debugger permission. The API exposes only supported protocol domains, and enterprise policies can prevent attachment. Chrome also documents that frame and target relationships are not always one-to-one, so do not assume a tab listener represents every execution context.
6. Compatibility and version control
CDP is closely tied to the browser version. Selenium describes its CDP support as temporary while WebDriver BiDi is implemented, warns that CDP was not designed as a stable testing API, and notes that functionality depends heavily on browser versions. Dynamic bindings may require updates when the protocol changes.
For reproducible captures, record:
- Chrome or Chromium version.
- Automation-library and CDP-client versions.
- Operating system and architecture.
- Target type and URL.
- Command-line flags used to launch Chrome.
- Whether a proxy, extension, enterprise policy, or headless mode was active.
Check the protocol reference for the browser version you actually run. Avoid copying a command from a different version without confirming its domain, parameters, and event name.
7. Troubleshooting CDP capture
| Symptom | Likely cause | Fix |
|---|---|---|
| Protocol Monitor is not listed | The experiment is disabled or DevTools was not reopened. | Enable Protocol Monitor in DevTools Settings > Experiments, then reopen DevTools. |
| The log contains old noise | Recording began before the reproduction. | Clear the Protocol Monitor log or start a new output file before reproducing. |
| No CDP WebSocket URL | Chrome was not launched with remote debugging, or the port is blocked. | Launch Chrome with --remote-debugging-port=9222 and verify http://127.0.0.1:9222/json/list. |
| Network events are missing | Network.enable was sent too late or the client attached to the wrong target. |
Attach before the action, enable the domain first, and inspect page, frame, and worker targets. |
| Response body retrieval fails | The body is unavailable, restricted, evicted, or the request ID is wrong. | Call Network.getResponseBody promptly with the exact request ID and handle errors. |
| Only console output appears | The Log domain was enabled but Network was not. | Enable each domain independently; Log events do not replace Network events. |
| Selenium command breaks after a browser upgrade | CDP protocol-version mismatch. | Pin compatible versions, consult the matching protocol reference, or move stable automation to WebDriver BiDi where supported. |
| Extension cannot attach | Missing permission or enterprise policy restriction. | Declare debugger, request the correct target permission, and check managed-device policy. |
8. Performance, reliability, and cost considerations
Protocol logging adds work to the client and can produce large files on busy pages. Use newline-delimited JSON so records can be streamed, rotate files for long sessions, and avoid storing full response bodies unless they are required. Record only the domains and fields needed for the diagnosis.
Keep timestamps and request IDs. They let you join a request, response, completion, and failure event after the session. Flush periodically so a browser crash does not lose the entire capture. Treat logs as sensitive data and redact authorization headers, cookies, access tokens, and private URLs before uploading them.
For reliable reproductions, start capture before navigation, keep browser and client versions pinned, use a dedicated profile, and save the launch command beside the log. A successful WebSocket connection does not prove that the selected target is the one performing the action.
9. Or skip the browser setup
If your actual goal is a clean visual capture of a page rather than a CDP transcript, ScreenshotNeo provides a website screenshot API and MCP server. One request returns PNG, JPEG, WebP, or PDF. The API accepts the URL and capture options without requiring you to operate Chrome, attach to a target, or maintain a CDP client.
See the ScreenshotNeo API documentation for all parameters. The basic calls are:
cURL
curl -G "https://api.screenshotneo.com/v1/shot" -d access_key=YOUR_API_KEY --data-urlencode url=https://stripe.com -o shot.webpPython
import requests
r = requests.get("https://api.screenshotneo.com/v1/shot", params={"access_key": "YOUR_API_KEY", "url": "https://stripe.com"}, timeout=90)
open("shot.webp", "wb").write(r.content)
Node.js
const q = new URLSearchParams({ access_key: 'YOUR_API_KEY', url: 'https://stripe.com' });
const res = await fetch(`https://api.screenshotneo.com/v1/shot?${q}`);
ScreenshotNeo removes cookie and consent banners, newsletter popups, and chat widgets before capture. Each cleanup step can be turned off. Bot checks, blank pages, timeouts, failed loads, and cache hits are not billed, and response headers identify the page verdict and billing result with X-Page-Verdict and X-Billed. Its MCP server gives Claude, Cursor, and other MCP clients take_screenshot, get_page_info, and capture_pdf tools.
It also supports full-page screenshots with lazy images loaded, CSS-element capture, dark mode, device presets, custom viewports, retina scale, PDF paper and margin controls, custom CSS and JavaScript, clicks, selector waits, delays, network-idle waits, request blocking, headers, cookies, user agents, authorization, timezone, geolocation, transparent backgrounds, resizing, caching TTLs, signed links, asynchronous jobs, signed webhooks, bulk capture of up to 100 URLs per call, usage data, and an OpenAPI specification. The parameter names used by other screenshot APIs also work, which helps when switching.
The Free plan includes 1,000 screenshots per month with no card. Paid plans start at $5 for 3,000 screenshots; every feature is available on every plan. Create a free ScreenshotNeo account.
10. FAQ
Does Protocol Monitor capture network requests?
It captures CDP messages, including commands and events related to network activity. For a portable HTTP archive, export a HAR from the Network panel instead.
Can I capture CDP logs after the page reloads?
Yes. Start Protocol Monitor before the reload. Programmatic clients should remain attached to the target and keep their event handlers active.
Is CDP the same as WebDriver BiDi?
No. CDP is Chrome’s developer protocol. Selenium documents its CDP support as temporary while WebDriver BiDi support is implemented, and CDP compatibility depends on browser versions.
Should I save response bodies?
Only when the body is needed. Bodies increase storage and may contain secrets or personal data. Save metadata and lifecycle events by default, then retrieve selected bodies with Network.getResponseBody.
Why do worker requests not appear?
The listener may be attached only to the page target. Discover and attach to the relevant worker or other target, and verify how your CDP client represents sessions and frames.