How to Capture All Network Requests and Response Data in Chrome
Capture Chrome requests, inspect and save response bodies, export HAR files, and automate repeatable traces with extensions or the DevTools Protocol.
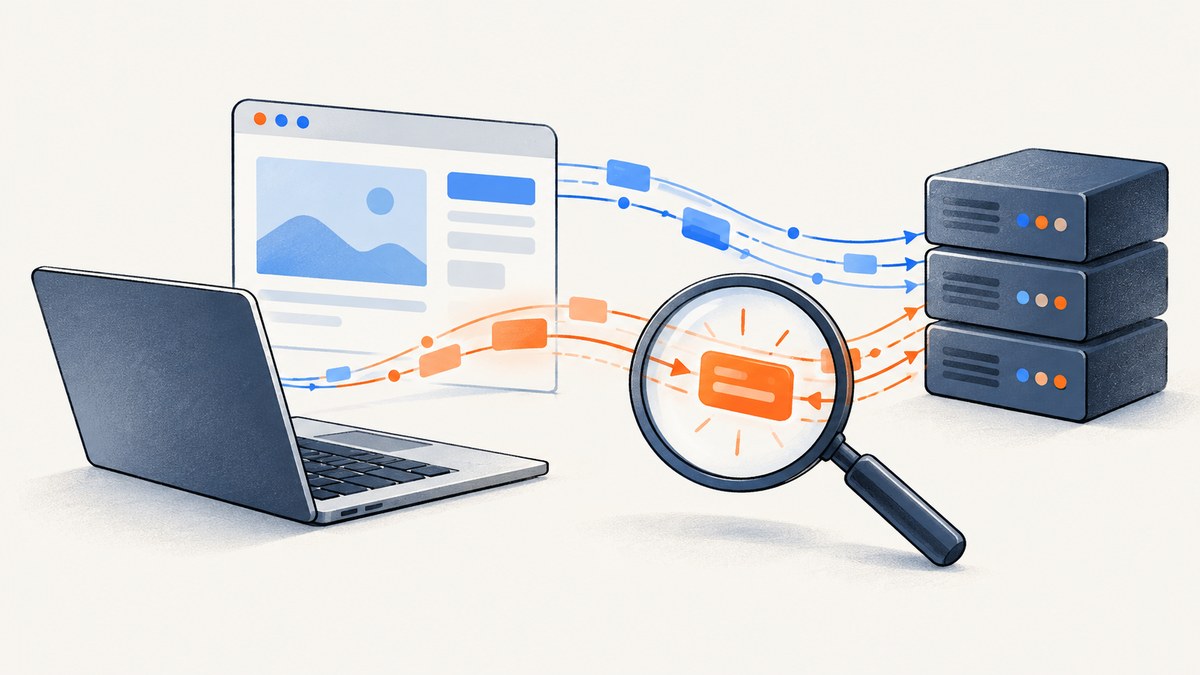
To capture all network requests in Chrome, open DevTools before the activity you want to record, select Network, make sure recording is on, and then reload the page or reproduce the action. Turn on Preserve log if the flow navigates or reloads. Click a request to inspect its headers, payload, timing, and response; use Copy response when you need its body separately. Export a HAR when you need a portable trace. Chrome sanitizes HAR exports by default, omitting sensitive header classes such as Cookie, Set-Cookie, and Authorization. Chrome’s Network reference
1. Capture a complete request trace in DevTools
- Open the page you intend to inspect, then open DevTools with F12 or Ctrl+Shift+I on Windows/Linux, or Cmd+Option+I on macOS.
- Select the Network panel. Chrome records network activity while this panel is open. Check that the round record control is active; if it is gray, click it.
- Enable Preserve log if you will follow links, submit a form, reload, or otherwise navigate. This keeps entries from earlier documents in the same trace.
- Reload the page while Network is visible to capture the initial document and its scripts, stylesheets, images, fetch/XHR calls, WebSockets, and other loading activity.
- Reproduce the interaction that triggers the traffic: sign in, open a menu, submit a form, scroll to lazy content, or wait for a background refresh.
- Inspect the request table and click any entry to view its details. Use the Headers, Payload, Preview, Response, and Timing tabs as appropriate.
Opening DevTools after a page has already loaded cannot recover requests that have already completed. Reload with Network open when the initial load matters. The Network panel can filter entries by type and request properties; clear filters and verify the selected time range before concluding a request is absent. Chrome’s Network overview
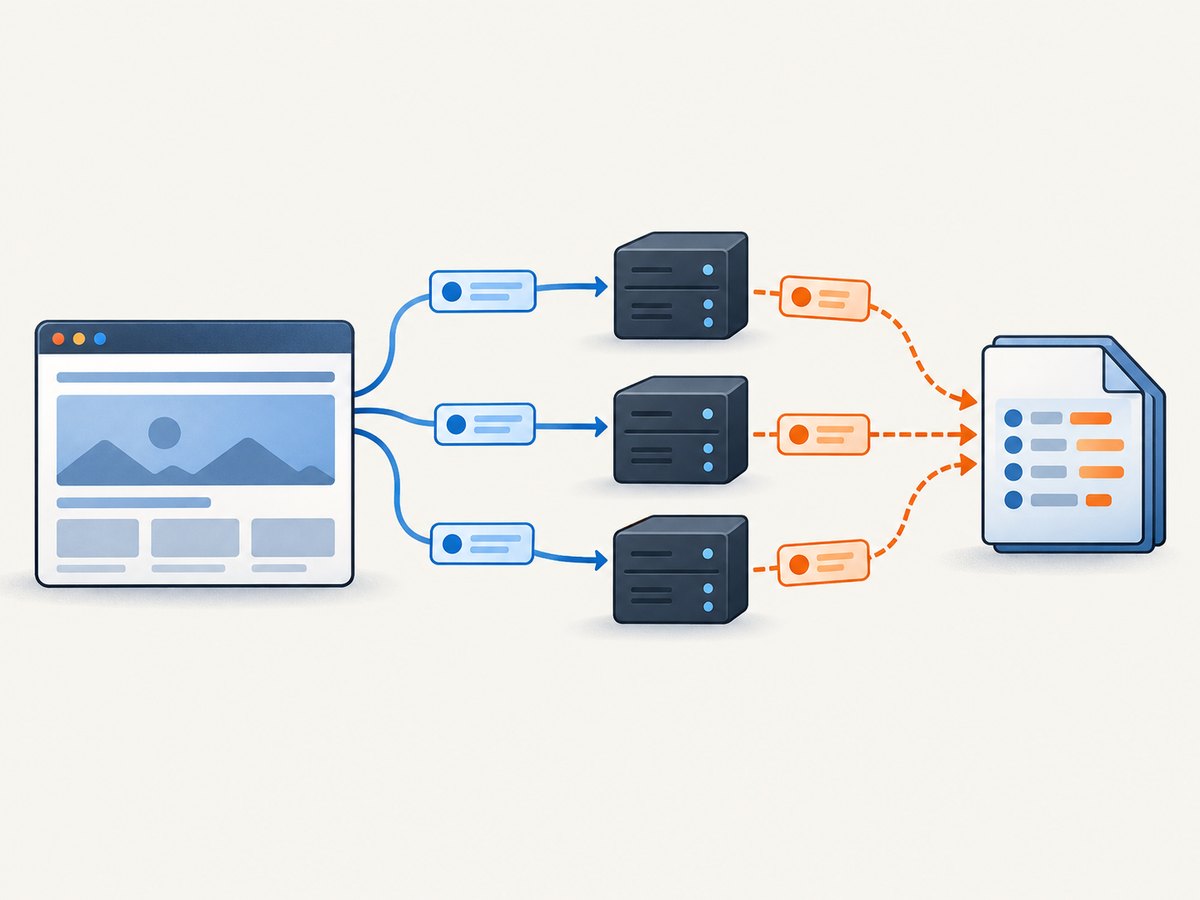
Useful Network panel controls
| Control | Use |
|---|---|
| Record | Start or stop collecting requests. Keep it active during the activity. |
| Preserve log | Keep entries across reloads and navigations in a multi-step flow. |
| Clear | Remove existing rows before a focused capture; do this before starting the action you want to isolate. |
| Filter box and type buttons | Find requests by text or resource category. A filter hides rows; it does not mean Chrome failed to record them. |
| Disable cache | For debugging, prevent the browser cache from serving eligible resources while DevTools is open. This changes the request conditions, so leave it off when you need to observe normal cache behavior. |
| Throttling | Simulate a constrained network profile to investigate load behavior. Record the chosen profile because it affects timings and which requests finish. |
2. Inspect and save response data
Click a completed request. The Headers tab shows its URL, method, status, request headers, and response headers. Payload shows submitted query or body data where available. Preview renders supported content; Response displays the response body. The Timing view helps distinguish waiting for a server response from transfer time.
To save a body for one request, right-click the request and choose Copy → Copy response, then paste it into a file or editor. This is useful for focused debugging but is manual and applies to the selected response. For a collection, export a HAR with content and inspect the resulting file. A HAR records request and response metadata and may contain response content, but extension-facing HAR entries do not include content automatically; extensions must call the finished request object’s getContent() method. Chrome extension Network API
Export a HAR
- In Network, capture the activity and ensure the relevant entries are present.
- Use the Network panel’s Export HAR control or the request table’s context menu to save the capture.
- Use the sanitized export by default. Chrome removes sensitive header classes including cookies and authorization headers.
- If a debugging task truly requires those headers, use the sensitive-data export preference deliberately, keep the file private, and remove secrets before sharing.
- Open the exported file with a text editor or a HAR viewer and check that the expected requests and response content are present.
Sanitization does not make a HAR safe to publish. URLs can include identifying query parameters; request bodies and response content can include account data or personal information. Review the actual file, redact tokens, cookies, account identifiers, and private data, and share only the minimum necessary trace.
3. Automate capture with a Chrome extension
For a repeatable workflow inside Chrome, the DevTools extension API exposes the known HAR log. Register a listener for completed requests and call getContent() to retrieve each response body. This is an extension snippet, not a standalone webpage script: it belongs in a DevTools extension page with the corresponding DevTools permission and manifest setup.
// devtools.js — run from a Chrome DevTools extension page
chrome.devtools.network.onRequestFinished.addListener((request) => {
  const details = {
    url: request.request.url,
    method: request.request.method,
    status: request.response.status,
    mimeType: request.response.content.mimeType,
  };

  request.getContent((content, encoding) => {
    // Persist or process this data using extension APIs appropriate to your setup.
    console.log({ ...details, encoding, content });
  });
});

// Retrieve the entries currently known to the Network panel.
chrome.devtools.network.getHAR((har) => {
  console.log(`Captured ${har.entries.length} HAR entries`);
});
Open DevTools before the activity and reload the target page. The official extension reference notes that doing so generally makes getHAR() correspond to the Network panel list. A HAR is a snapshot of known entries; the listener is useful for processing requests as they finish. Avoid treating the logged content as harmless: response bodies can contain private data. API reference
4. Capture request and response bodies with the DevTools Protocol
For browser automation or a debugging client, Chrome DevTools Protocol (CDP) provides Network events and commands. Enable the Network domain, retain each requestId from response events, wait for loading to finish, then call Network.getResponseBody for the body. The response can be text or base64-encoded; respect the base64Encoded flag when decoding. CDP Network domain
// Protocol sequence (pseudocode; send these messages over a CDP session)
await cdp.send('Network.enable');

cdp.on('Network.responseReceived', ({ requestId, response }) => {
  requests.set(requestId, {
    url: response.url,
    status: response.status,
    mimeType: response.mimeType,
    headers: response.headers,
  });
});

cdp.on('Network.loadingFinished', async ({ requestId }) => {
  try {
    const result = await cdp.send('Network.getResponseBody', { requestId });
    const body = result.base64Encoded
      ? Buffer.from(result.body, 'base64')
      : result.body;
    await saveBody(requestId, body);
  } catch (error) {
    // The body may no longer be available, or the request may not have a body.
    console.warn('Could not retrieve response body', requestId, error);
  }
});
This shows the protocol logic but assumes a CDP client has already connected and provides send, event subscriptions, a requests map, and a saveBody function. The exact connection and file-writing setup depends on the automation library and how Chrome was launched. Listen for the request lifecycle before the page action, and associate events by request ID; redirects can produce multiple response stages. CDP is appropriate when you need repeatable programmatic collection, while DevTools is quicker for a one-off investigation.
5. Choose the right capture method
| Method | Best for | Response bodies | Repeatability | Watch out for |
|---|---|---|---|---|
| Network panel | One-off debugging and visual inspection | Response tab or Copy response; HAR export | Manual | Panel must be open before activity; filters can hide entries. |
| Chrome DevTools extension | Processing requests while working in Chrome | Call getContent() for completed entries |
Automatable within extension | HAR content is not included in extension-facing data by default. |
| CDP Network domain | Automation, protocol events, and structured body retrieval | Network.getResponseBody |
High | Handle request lifecycle, binary encoding, unavailable bodies, and sensitive data. |
The extension and protocol approaches are more suitable for repeatable collection because they expose programmatic events and body retrieval; that is an inference from the documented APIs. Manual DevTools capture remains the shortest route to inspect a single request. Network reference
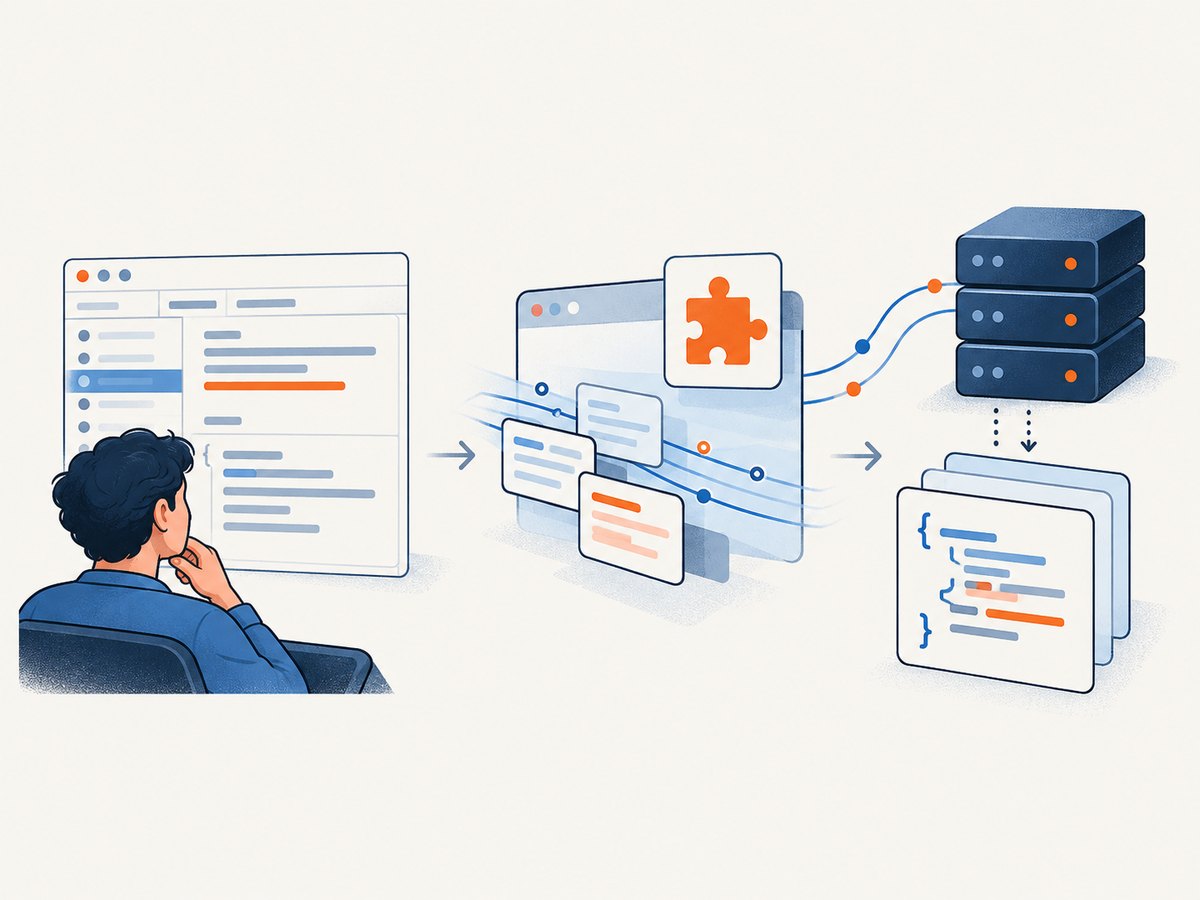
6. Troubleshoot missing requests and incomplete bodies
| Symptom | Likely cause | Fix |
|---|---|---|
| Initial page requests are missing | Network panel opened after the load, or recording was off. | Open Network, enable recording, clear old rows if useful, then reload. |
| Rows disappear after navigation | Preserve log was disabled. | Enable Preserve log before repeating the flow. |
| A request seems absent | A text or type filter is hiding it, or the action did not generate a network request. | Clear filters; reproduce the action and check the appropriate type, including fetch/XHR or WS. |
| Response tab is empty or unavailable | The request has not completed, has no body, or Chrome cannot expose its body for that request. | Wait for completion, check status and type, and try Copy response or protocol retrieval. Handle retrieval failure in automation. |
| HAR omits cookies or authorization | Sanitized export is the default. | Keep the sanitized file unless the debugging need requires sensitive headers. If enabled, protect and redact the export. |
| Extension HAR lacks response content | Extension API HAR entries omit request content for efficiency. | Call getContent() on the finished request object. |
| CDP body is unreadable | The returned body is base64 encoded, or it is binary data. | Check base64Encoded and decode bytes rather than treating every body as UTF-8 text. |
| Some requests are still pending | Long polling, WebSockets, streaming, or background requests may not finish like ordinary fetches. | Capture the relevant events and define a practical stopping point; don’t wait forever for a persistent connection. |
7. Reliability, performance, and handling sensitive data
A complete trace is bounded by what the browser observes during the capture window. Open the panel before the action, keep recording enabled, preserve the log when navigation matters, and account for service workers, cached responses, streaming, and long-lived connections. Disabling cache can help isolate network loads, but it changes the conditions and should be recorded in your notes.
Capturing and retaining every response body can consume substantial memory and disk space, especially for large media or repeated polling. Filter early when the task allows it, save only bodies needed for the investigation, and avoid dumping large or private bodies into console logs. For automation, handle body retrieval errors per request so one unavailable response does not stop the whole run.
HARs and body collections can expose credentials, personal information, internal endpoints, and business data. Sanitized HAR export is the safer default, but inspect even sanitized files before sharing. Store captures with access controls, set a retention period, and redact secrets in both headers and payloads.
Or skip the browser setup
If the task is to capture a rendered page as an image or PDF rather than inspect its underlying network trace, ScreenshotNeo provides a website screenshot API and MCP server. It does not export Chrome request logs or response bodies; use the DevTools methods above for that job. For a page screenshot, one GET request is enough:
ScreenshotNeo API documentation
curl -G "https://api.screenshotneo.com/v1/shot" -d access_key=YOUR_API_KEY --data-urlencode url=https://stripe.com -o shot.webpimport requests
r = requests.get("https://api.screenshotneo.com/v1/shot", params={"access_key": "YOUR_API_KEY", "url": "https://stripe.com"}, timeout=90)
open("shot.webp", "wb").write(r.content)const q = new URLSearchParams({ access_key: 'YOUR_API_KEY', url: 'https://stripe.com' });
const res = await fetch(`https://api.screenshotneo.com/v1/shot?${q}`);- Cookie banners, newsletter popups, and chat widgets are removed before the shot; each cleanup step can be turned off.
- Bot checks, blank pages, timeouts, failed loads, and cache hits are never billed; response headers identify the page verdict and billing status.
- An MCP server gives Claude, Cursor, and other MCP clients tools to take screenshots, get page information, and capture PDFs.
- The Free plan includes 1,000 screenshots a month with no card. Paid plans start at $5 for 3,000 shots; every feature is available on every plan.
Sign up free for 1,000 screenshots a month, with no card.
Frequently asked questions
Does Chrome record requests when DevTools is closed?
For a Network panel capture, keep the panel open before the activity. If it was closed or opened late, reload with it open to collect the page-load traffic.
Can I capture requests from another tab?
The Network panel records the inspected page’s activity. Select the relevant tab and open its DevTools before reproducing the action there.
Does exporting a HAR include every response body?
HAR is useful for metadata and exported content, but confirm the specific entries you need in the file. For Chrome extension automation, retrieve content explicitly with getContent().
Is a sanitized HAR safe to post publicly?
No. Sanitization removes specified sensitive header classes by default, but URLs, payloads, and response content may still reveal private information. Inspect and redact the file first.


