How to Capture Chrome DevTools Network Traffic and Record HAR Files for Offline Presentations
Capture Chrome network requests, export a sanitized HAR, add screenshots, and import the file later for a clear offline presentation.
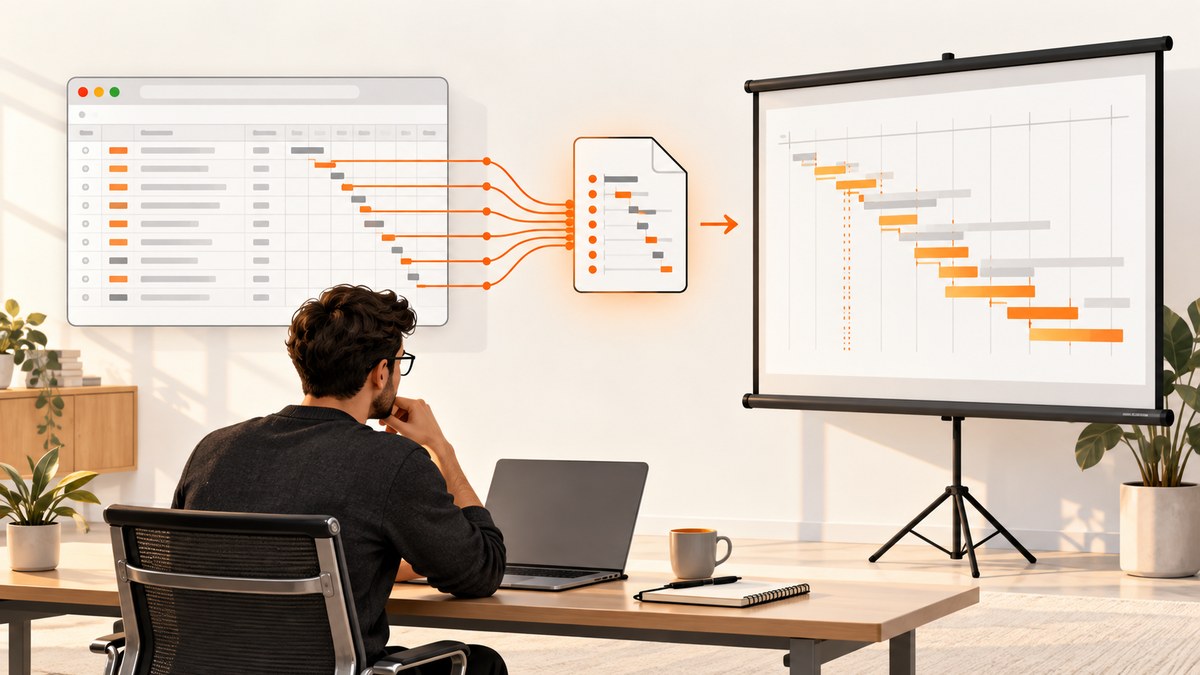
Direct answer: Open Chrome DevTools before reproducing the behavior, choose Network, and let recording run while DevTools is open. Turn on Preserve log when navigation or reloads belong in one capture. Reproduce only the scenario you need, filter the request list, then export a sanitized HAR. Review the JSON for secrets before sharing. In the presentation, import the HAR by dropping it into the Network request table or using Import HAR. If you want visible loading context, enable Capture screenshots and reload with the Network panel focused.
Chrome states: “By default, DevTools records all network requests in the Network panel, so long as DevTools is open.” See the Chrome DevTools Network features reference for the current controls and labels.
What a HAR file contains
HAR (HTTP Archive) is a JSON object with a defined set of fields describing browser requests and responses. It can preserve URLs, methods, status codes, timing data, headers, cookies, payload metadata, and response information for later inspection. A HAR is a saved record for analysis; the Chrome documentation describes importing it for inspection, not replaying a live authenticated session.
That distinction matters in an offline presentation. A viewer can inspect what was captured, sort requests, open headers, and correlate timing. They should not assume that importing the file recreates the original login, server state, or side effects.
Prepare a focused capture
- Choose the scenario. Write down the exact action you will demonstrate: initial page load, a form submission, a route transition, or an API error.
- Use a clean browser state. Close unrelated tabs and extensions where practical. Avoid real customer accounts and production credentials in a presentation capture.
- Open DevTools first. Use
Ctrl+Shift+I(Windows/Linux) orCmd+Option+I(macOS), then select Network. Recording begins while DevTools is open. - Decide whether to preserve navigation. Enable Preserve log before a reload or navigation if the final story crosses more than one page load. Leave it off for a compact, single-load capture.
- Clear old requests. Click the clear button so the first request in the table represents the scenario you will explain.
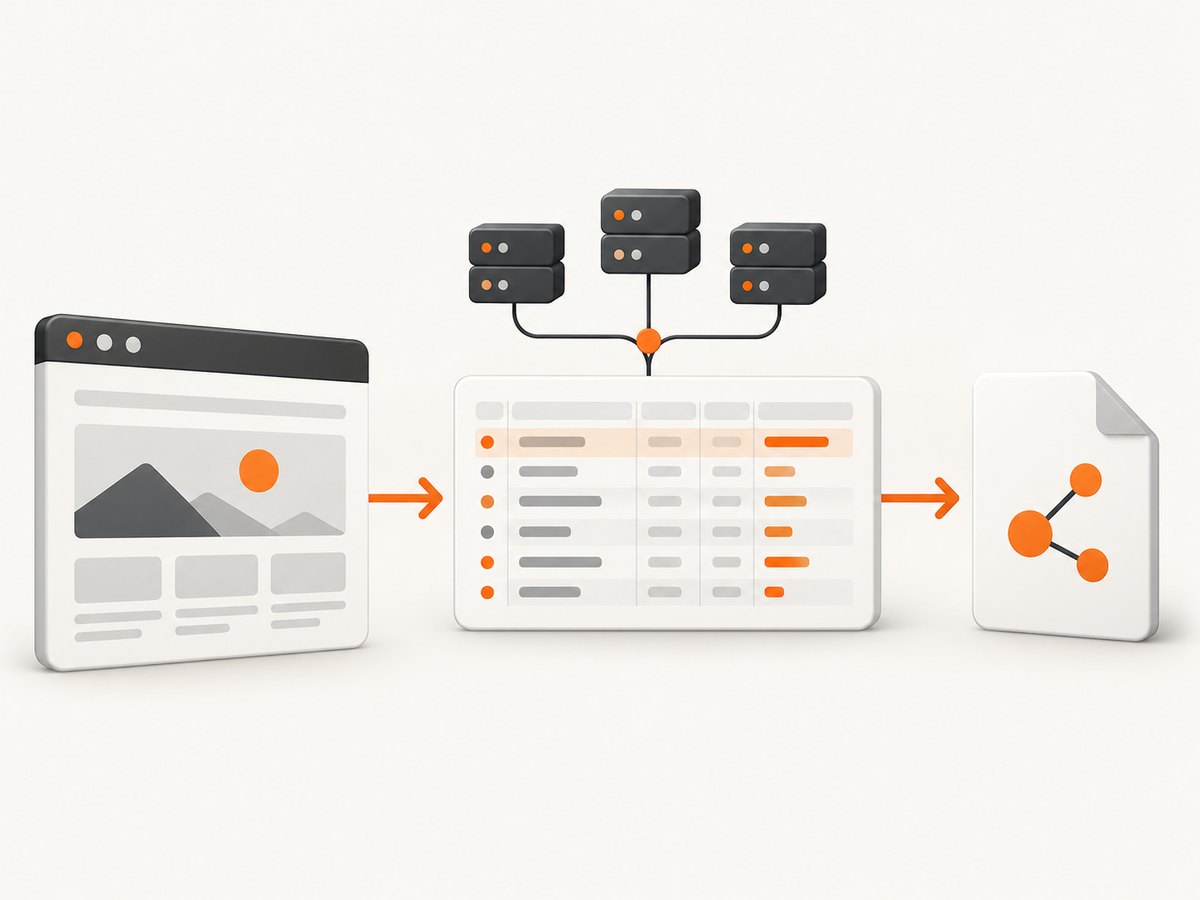
Record traffic step by step
- With Network selected, reload the page or start the interaction. The request table will populate with document, script, stylesheet, image, fetch/XHR, and other resource types.
- Reproduce only the actions needed for the presentation. Extra browsing creates noise and may expose unrelated identifiers.
- Use the filter box to narrow the story. Examples include
method:POST,status-code:404,resource-type:fetch, a domain name, or a distinctive path. Confirm the visible filter before exporting. - Click an important request and prepare the panes you will show: Headers for URL and status, Payload for submitted data, Preview/Response for returned content, and Timing for the waterfall.
- For a visual loading narrative, open Network panel settings and enable Capture screenshots. Reload while the panel is focused. Chrome associates thumbnails with the Overview timeline so you can connect a visible page state to requests captured at that moment. The Network panel overview explains the surrounding controls.
Export a HAR for offline use
Export the complete log
Use the Network panel’s Export HAR control. You can also right-click in the Requests table and choose the save-all-listed-as-HAR action. The wording includes “listed” in context-menu actions, so check whether an active filter would limit the export to the rows currently shown.
Export only a useful subset
If the presentation is about one API call, filter to that host, path, method, or status and save the listed requests. Keep the full log when dependency order, redirects, cache behavior, or page timing is part of the explanation. Record which choice you made in the presentation notes.
Sanitized versus sensitive-data export
Chrome’s sanitized HAR export excludes Cookie, Set-Cookie, and Authorization headers by default. Chrome 130 release notes document the same default and describe an opt-in preference for sensitive data at Settings > Preferences > Network > Allow to generate HAR with sensitive data. Only use the sensitive-data option when there is a specific, controlled need.
Sanitization is not a promise that every private value disappears. Before sharing, inspect URLs and query strings, headers other than the three named types, request payloads, response bodies, identifiers, and any personal data. Search the JSON for email addresses, account IDs, bearer-like strings, signed URLs, and internal hostnames. Keep the original capture private and distribute a reviewed copy.
Import and present the HAR offline
- Open Chrome DevTools and select Network.
- Drag the
.harfile into the Requests table, or use the Network panel’s Import HAR action. - Start with the request that explains the user-visible event. Show its status, URL, request method, and timing before expanding supporting calls.
- Use filters to move between the complete capture and a focused subset. If screenshots were captured, use the Overview timeline and thumbnails to point to the visual state associated with a request burst.
- State whether the file was sanitized and which parts are illustrative. Imported data is for inspection; do not describe it as a guaranteed live replay.
Capture design choices
| Choice | Use it when | Trade-off |
|---|---|---|
| Preserve log on | The story includes reloads, redirects, or route changes | Larger files and more unrelated requests |
| Preserve log off | You need one compact page-load record | Earlier requests disappear on navigation |
| Sanitized HAR | Sharing with a broad audience | Some authenticated header context is absent |
| Sensitive-data HAR | A restricted review requires those headers | Credentials and personal data can be exposed |
| All requests | Dependency order or timing is central | Harder for an audience to scan |
| Filtered/listed requests | One endpoint or failure is the lesson | Context outside the filter is omitted |
| Traffic plus screenshots | You must connect loading visuals to requests | Requires enabling the feature and reloading |
Make the presentation reproducible
Keep a small capture manifest next to the HAR:
- Chrome version and operating system.
- Page URL and the scenario’s start time.
- Whether cache was disabled, throttling was enabled, or Preserve log was used.
- Whether the export was sanitized.
- The filter text, if only listed requests were exported.
- A short map from visible events to request names.
Use stable test data and a staging environment where possible. If the demo requires a login, capture with a dedicated account and remove sensitive fields before distribution. Keep the narrative small: one page state, the triggering action, the key request, the response, and the resulting state.
Common errors and fixes
The request list is empty
Cause: DevTools was opened after the action, the wrong panel is selected, or a filter hides every row. Fix: Open DevTools before reproducing, select Network, clear the filter, and reload.
Requests disappeared after navigation
Cause: Preserve log was disabled. Fix: Enable Preserve log before navigating or reloading, then repeat the scenario.
The HAR lacks cookies or authorization
Cause: The sanitized export intentionally excludes Cookie, Set-Cookie, and Authorization headers. Fix: For a restricted internal review, enable Chrome’s sensitive-data preference and export again; for public sharing, keep the sanitized file and explain the limitation.
Private data still appears in the sanitized file
Cause: Sanitization targets the documented header fields, not every URL, payload, response, or identifier. Fix: Open the HAR as text, search for personal and secret values, redact or recapture with safe data, and validate the copy before distribution.
The imported HAR does not replay the workflow
Cause: Import is documented for inspection, not guaranteed session replay. Server state, credentials, expiring signatures, and side effects may be gone. Fix: Present the saved request and response details, or record a separate live demo in a controlled environment.
Screenshot thumbnails are missing
Cause: Capture screenshots was enabled after the load, or the page was not reloaded with Network focused. Fix: Enable it in Network settings, reload, and reproduce the interaction again.
The exported file is too large
Cause: Preserve log retained several navigations or the page loaded many assets. Fix: Capture a shorter scenario, clear before starting, filter to relevant requests, or export only listed rows after confirming the filter.
Timing differs between captures
Cause: Network conditions, cache state, server load, and background requests vary. Fix: Repeat the capture, document throttling and cache settings, and present timing as an observation from that capture rather than a universal benchmark.
Performance, reliability, and file handling
DevTools recording adds observability but does not make the underlying site deterministic. Long sessions increase memory and HAR size, while screenshot capture adds visual artifacts to the workflow. For a reliable presentation, capture the shortest complete scenario and keep the browser and network conditions documented.
Store HAR files as sensitive engineering artifacts until reviewed. Use checksums or versioned filenames when a team must refer to the exact same capture. Compress only after validation, and retain an unmodified private original if your process requires auditability. Never put credentials in source control or a public issue.
Or skip the browser setup
If your actual requirement is a clean image or PDF of a URL rather than a record of every network request, ScreenshotNeo provides a single GET request. Its capture flow accepts cookie and consent banners like a visitor, then removes more than 60 known consent platforms, newsletter popups, and chat widgets; each step can be turned off. Bot checks/CAPTCHAs, blank pages, timeouts, failed loads, and cache hits cost nothing, and response headers report the page verdict and whether the shot was billed. It also offers an MCP server with take_screenshot, get_page_info, and capture_pdf for Claude, Cursor, and other MCP clients.

See the ScreenshotNeo documentation for all options. This is a screenshot service, so it complements a HAR when slides need a stable visual of the result rather than the underlying request log.
cURL
curl -G "https://api.screenshotneo.com/v1/shot" -d access_key=YOUR_API_KEY --data-urlencode url=https://stripe.com -o shot.webpPython
import requests
r = requests.get("https://api.screenshotneo.com/v1/shot", params={"access_key": "YOUR_API_KEY", "url": "https://stripe.com"}, timeout=90)
open("shot.webp", "wb").write(r.content)
Node.js
const q = new URLSearchParams({ access_key: 'YOUR_API_KEY', url: 'https://stripe.com' });
const res = await fetch(`https://api.screenshotneo.com/v1/shot?${q}`);
const bytes = await res.arrayBuffer();
await Bun.write('shot.webp', bytes);
ScreenshotNeo supports PNG, JPEG, WebP, and PDF output; full-page capture with lazy images, CSS-selector element capture, dark mode, device presets or custom viewports, retina scale, custom CSS and JavaScript, click and wait actions, request blocking, headers, cookies, user agents, authorization, timezone, geolocation, transparent backgrounds, resizing, configurable caching, signed links, asynchronous jobs with signed webhooks, bulk capture for up to 100 URLs per call, usage data, and an OpenAPI specification. Parameter names used by other screenshot APIs also work, which can simplify migration.
The Free plan includes 1,000 shots per month with no card. Paid plans start at $5 for 3,000 shots; yearly billing gives two months free, and every feature is available on every plan. Create a free ScreenshotNeo account to get started.
FAQ
Does Chrome record requests before DevTools opens?
No. Recording is automatic while DevTools is open, so open Network before reproducing the behavior.
Should I always enable Preserve log?
Only when navigation or reloads are part of the story. It is useful for multi-page sequences but can retain unrelated traffic.
Is a sanitized HAR safe to publish publicly?
It removes the three documented sensitive header types by default, but you must still inspect URLs, payloads, response bodies, and other identifiers yourself.
Can an imported HAR reproduce a logged-in session?
Do not assume so. Import is documented for inspection, and authentication or server state may be expired or absent.
How do I connect screenshots to requests?
Enable Capture screenshots in Network settings, reload with Network focused, and use the thumbnails and Overview timeline to relate visible states to request timing.
What should I show first in a live explanation?
Start with the user action, then the key request’s method, URL, status, and timing. Expand supporting calls only when they explain the visible result.


