How to Capture Complete SVG Charts With Puppeteer
Capture complete SVG charts with Puppeteer without clipped labels, legends, strokes, or lazy-rendered data. Includes element, full-page, and clip workflows.
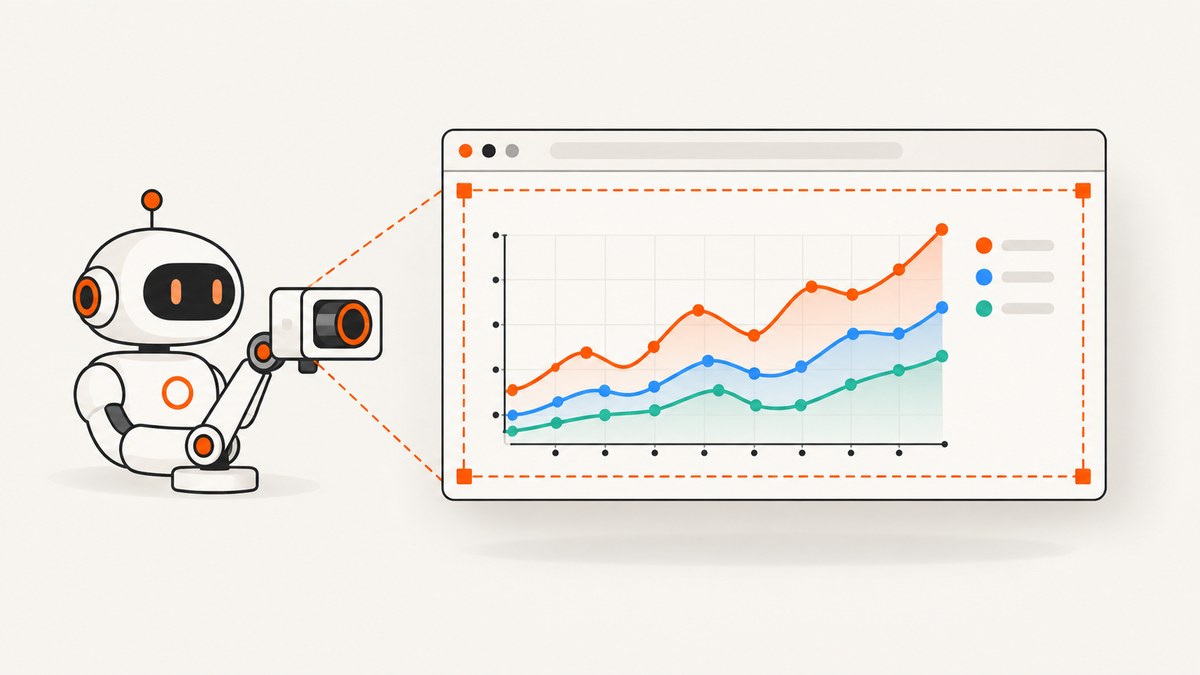
To capture a complete SVG chart with Puppeteer, wait until the chart application reports that rendering is finished, select the outer SVG or chart wrapper, verify its rendered dimensions, and use an element screenshot. Use fullPage: true only when you want the entire document. Use clip when you need a deliberately positioned region.
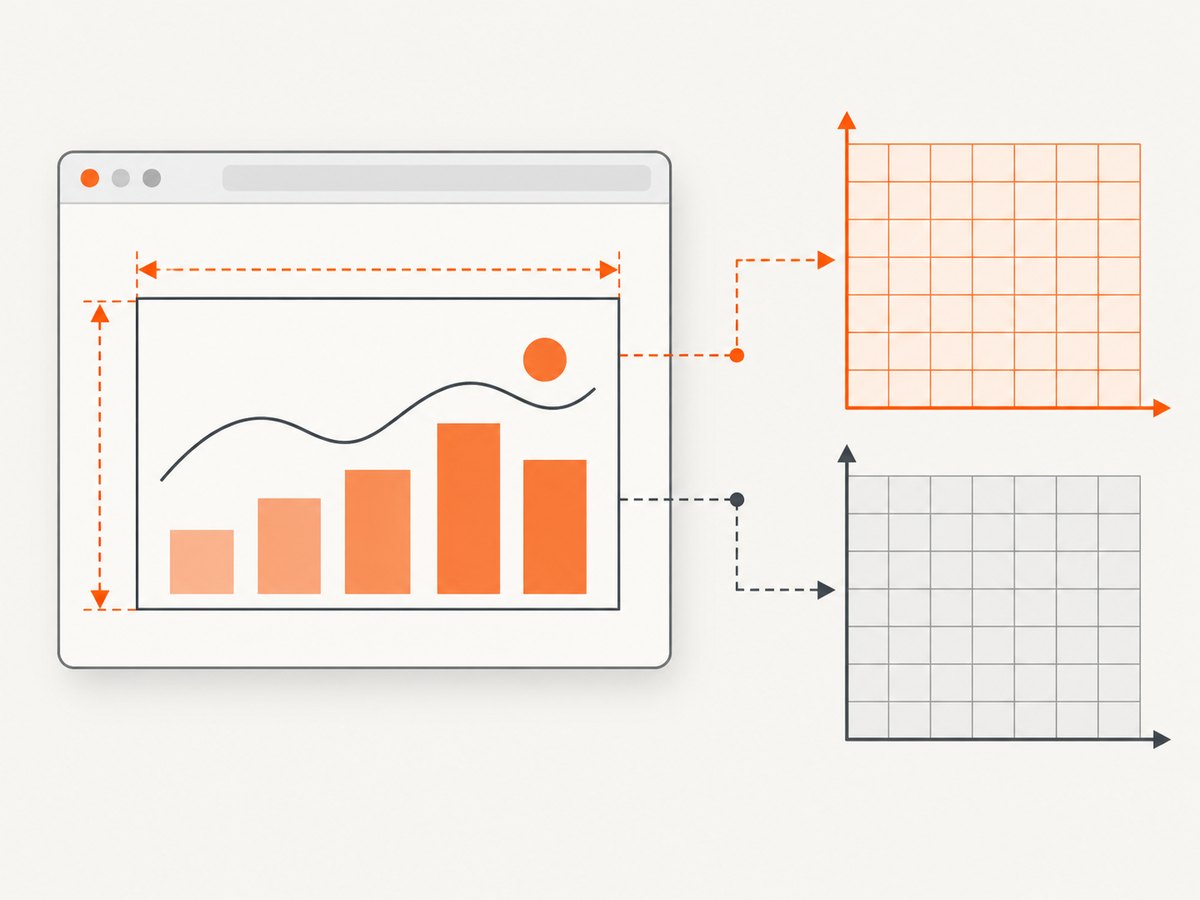
The most common cause of clipped charts is measuring SVG geometry in one coordinate system and passing it to Puppeteer as another. SVG getBBox() values are in SVG user units. Screenshot clips use page CSS-pixel coordinates. For a reliable chart-only image, target the rendered SVG or its enclosing chart container instead of copying raw getBBox() coordinates into a clip.
Choose the right Puppeteer capture scope
| Need | Preferred method | Trade-off |
|---|---|---|
| Chart only | ElementHandle.screenshot() on the SVG or chart wrapper |
Needs a stable selector and a wrapper containing labels and legend. |
| Whole document | page.screenshot({ fullPage: true }) |
Includes unrelated page content and does not fix chart sizing or readiness. |
| Exact page region | page.screenshot({ clip }) |
Gives control, but you must calculate CSS-pixel coordinates and margins. |
| Currently visible chart | page.screenshot() |
Anything outside the viewport is omitted. |
Puppeteer’s page screenshot API documents viewport, full-page, and clip captures. Its element screenshot API scrolls an element into view when necessary and captures that element’s rendered box. PNG is the default format and is generally the safest choice for small axis labels.
Set up Puppeteer and a deterministic viewport
Install Puppeteer in a new project:
npm install puppeteerSet the viewport to the output size you need before the chart renders. A responsive chart can change its dimensions when the viewport changes, so set this before navigation and before waiting for the chart-ready condition.
const puppeteer = require('puppeteer');

(async () => {
  const browser = await puppeteer.launch({
    headless: true,
    args: ['--no-sandbox', '--disable-setuid-sandbox']
  });
  const page = await browser.newPage();
  await page.setViewport({
    width: 1440,
    height: 900,
    deviceScaleFactor: 1
  });
  await page.goto('https://example.com/chart', {
    waitUntil: 'networkidle2',
    timeout: 60_000
  });
  // Add the chart application's real readiness condition here.
  await page.screenshot({ path: 'viewport.png' });
  await browser.close();
})();
networkidle2 only describes network activity. It does not prove that your chart has parsed data, finished an animation, or drawn labels. Treat it as navigation support, then wait for a signal owned by the chart application.
Wait for the chart to finish rendering
Use an application signal such as a data-rendered="true" attribute, a completed state element, or a custom event exposed by the page. Also check that the selected SVG has positive rendered dimensions.
await page.waitForSelector('#sales-chart svg', { visible: true });

await page.waitForFunction(() => {
  const svg = document.querySelector('#sales-chart svg');
  return svg &&
    svg.getBoundingClientRect().width > 0 &&
    svg.getBoundingClientRect().height > 0 &&
    svg.dataset.rendered === 'true';
}, { timeout: 30_000 });
Replace the example flag with the condition your application actually sets. If no signal exists, wait for the data request to complete and verify dimensions, labels, and a known mark in the DOM. A fixed delay can be a fallback, but it is not a universal chart-readiness test: a slow data request can outlast it, while a fast page wastes time.
Capture the SVG or its chart wrapper
For an isolated chart, capture the element that owns every visual part you need. The SVG may contain paths and axes while HTML labels, a legend, a toolbar, or annotations sit in a sibling element. In that case, capture the outer wrapper.
const chart = await page.waitForSelector('#sales-chart', {
  visible: true
});

const box = await chart.boundingBox();
if (!box || box.width <= 0 || box.height <= 0) {
  throw new Error('Chart has no positive rendered dimensions');
}

await chart.screenshot({
  path: 'sales-chart.png',
  type: 'png'
});
When the SVG itself contains the complete chart, target it directly:
const svg = await page.waitForSelector('#sales-chart svg', {
  visible: true
});
await svg.screenshot({ path: 'sales-chart.svg-area.png' });
Element screenshots are usually less error-prone than hand-built clips because Puppeteer uses the element’s rendered page box. Inspect the result for all four edges: a path’s bounds can be smaller than the visible chart because strokes, markers, labels, and legends extend beyond it.
Capture the whole document when that is the requirement
If the requested artifact is a report page containing the chart and surrounding content, use a full-page screenshot:

await page.screenshot({
  path: 'report-page.png',
  fullPage: true,
  type: 'png'
});
fullPage: true captures the full page or document dimensions. It does not discover hidden chart content, force lazy data to load, or correct an SVG with a too-small viewBox. It can also include headers, navigation, and unrelated sections that you did not want in a chart image.
Use an explicit clip for a controlled region
A clip is useful when the required region is defined in page coordinates, for example a chart plus a fixed margin. Measure the rendered wrapper with getBoundingClientRect(), which returns viewport-relative CSS-pixel geometry.
const rect = await page.$eval('#sales-chart', el => {
  const r = el.getBoundingClientRect();
  const margin = 16;
  return {
    x: Math.max(0, r.left - margin),
    y: Math.max(0, r.top - margin),
    width: r.width + margin * 2,
    height: r.height + margin * 2
  };
});

if (rect.width <= 0 || rect.height <= 0) {
  throw new Error('Computed clip is empty');
}

await page.screenshot({ path: 'sales-chart-clipped.png', clip: rect });
Ensure the clip stays within the screenshot’s practical page area and account for a sticky header, scroll position, and device scale factor. Puppeteer clip coordinates are CSS pixels; output pixels are affected by deviceScaleFactor.
Understand SVG geometry before calculating bounds
SVGGraphicsElement.getBBox() returns the smallest rectangle containing an element’s graphics in that element’s SVG user coordinate system. Its default result can exclude stroke and markers. Newer options can request stroke, markers, or clipping, but those options do not turn the result into page coordinates. Transforms on the element or its ancestors are not included in the returned rectangle.
getBoundingClientRect() returns a rectangle relative to the browser viewport. That is the appropriate basis for a page screenshot clip when the target is already a rendered DOM element.
const geometry = await page.$eval('#sales-chart svg', svg => {
  const userBox = svg.getBBox();
  const pageBox = svg.getBoundingClientRect();
  return {
    userSpace: {
      x: userBox.x,
      y: userBox.y,
      width: userBox.width,
      height: userBox.height
    },
    viewportCssPixels: {
      x: pageBox.x,
      y: pageBox.y,
      width: pageBox.width,
      height: pageBox.height
    }
  };
});
console.log(geometry);
getScreenCTM() exposes the matrix that maps SVG coordinates into the SVG viewport coordinate system. Use it when you must convert custom SVG points into screen-space coordinates. Nested SVG viewports, page positioning, CSS transforms, and scrolling still need to be handled by your calculation. For most chart captures, selecting the rendered wrapper is safer.
Prevent lazy content and animation from producing incomplete images
Charts can be incomplete even when the SVG node exists. Common causes include delayed data, fonts that have not loaded, an animation still running, and a chart that is below the fold and only renders after intersection.
- Wait for the data request or application completion state.
- Scroll the chart into view if the library uses viewport visibility.
- Wait for fonts when text metrics affect layout.
- Disable or finish animations through an application setting or injected CSS.
- Check that labels, legend nodes, and representative marks exist.
await page.evaluate(async () => {
  if (document.fonts && document.fonts.ready) {
    await document.fonts.ready;
  }
  const chart = document.querySelector('#sales-chart');
  chart?.scrollIntoView({ block: 'center', inline: 'nearest' });
});

await page.addStyleTag({
  content: `*, *::before, *::after {
    animation-duration: 0s !important;
    animation-delay: 0s !important;
    transition: none !important;
    caret-color: transparent !important;
  }`
});
Only disable animation if a static frame is acceptable. If the chart’s final state depends on an animation completion callback, wait for that callback before capturing.
Output format, scale, and readability
PNG is lossless and a good default for axes, legends, and small labels. JPEG is smaller but can blur fine text and introduce artifacts around thin lines. WebP can reduce size while retaining good quality, depending on your downstream tooling.
await chart.screenshot({
  path: 'chart@2x.png',
  type: 'png'
});
Set deviceScaleFactor: 2 on the viewport for a higher-density output:
await page.setViewport({
  width: 1200,
  height: 800,
  deviceScaleFactor: 2
});
Higher scale increases pixel dimensions, memory use, encoding time, and storage. Choose it based on the consuming interface rather than assuming that more pixels always improve legibility.
Troubleshooting clipped or blank charts
| Symptom | Likely cause | Fix |
|---|---|---|
| Only part of the chart appears | Viewport screenshot or an inner plot element was selected. | Capture the SVG or outer wrapper; use full-page only for a full document. |
| Labels or strokes are cut off | getBBox() excluded stroke, markers, or labels outside the graphics group. |
Capture a larger wrapper or add an explicit margin to a CSS-pixel clip. |
| Clip is shifted or scaled | SVG user units were passed as page coordinates. | Use getBoundingClientRect(), or transform points with getScreenCTM(). |
| Chart is blank or stale | Capture happened before data or animation completed. | Wait for the application’s real ready signal and verify positive dimensions. |
| Image contains too much page | fullPage: true was used for a chart-only request. |
Use an element screenshot or a measured clip. |
| Text wraps differently in CI | Viewport, fonts, or device scale differs between environments. | Pin viewport settings, load the intended fonts, and use the same browser build. |
| Screenshot times out | Navigation or a readiness selector never completes. | Increase the relevant timeout only after checking selectors, network calls, and application errors. |
Performance, reliability, and cost considerations
- Reuse a browser: Keep one Chromium process alive and create a fresh page per job when capturing many charts. Browser startup is expensive compared with another page.
- Control concurrency: Limit simultaneous pages to the CPU and memory available. Large SVGs and high device scale factors increase rasterization memory.
- Make jobs deterministic: Pin the viewport, timezone, locale, fonts, user agent, and chart data version where possible.
- Use targeted waits: A selector or application state is usually faster and more reliable than a long fixed sleep.
- Retry carefully: Retry navigation and transient network failures, but do not blindly retry a deterministic selector or JavaScript error.
- Validate output: Check file existence and dimensions, and optionally inspect for a known SVG mark or expected label before publishing.
- Budget storage: PNG files at 2x scale can be considerably larger than viewport-sized JPEG or WebP files. Pick a format and retention period that match your use case.
Or skip the browser setup
ScreenshotNeo provides a website screenshot API and MCP server. It can capture a rendered chart page with one GET request, while handling browser setup for you. Cookie and consent banners, newsletter popups, and chat widgets are removed before the shot. Bot checks, blank pages, timeouts, failed loads, and cache hits are not billed; the response reports the result with X-Page-Verdict and X-Billed headers.
For chart pages, request a full-page image when the chart is part of a report, or combine the API’s selector, wait, viewport, custom CSS, and JavaScript options when you need a focused capture. The API supports PNG, JPEG, WebP, PDF, element capture by CSS selector, dark mode, retina scale, lazy-image loading, request blocking, custom headers and cookies, timezone and geolocation, caching with a chosen TTL, asynchronous jobs, signed webhooks, bulk capture, and usage reporting. See the ScreenshotNeo documentation for parameter names and response details.
cURL
curl -G "https://api.screenshotneo.com/v1/shot" \
  -d access_key=YOUR_API_KEY \
  --data-urlencode url=https://stripe.com \
  -o shot.webp
Python
import requests

r = requests.get(
    "https://api.screenshotneo.com/v1/shot",
    params={"access_key": "YOUR_API_KEY", "url": "https://stripe.com"},
    timeout=90,
)
r.raise_for_status()
open("shot.webp", "wb").write(r.content)
Node.js
const q = new URLSearchParams({
  access_key: 'YOUR_API_KEY',
  url: 'https://stripe.com'
});
const res = await fetch(`https://api.screenshotneo.com/v1/shot?${q}`);
if (!res.ok) throw new Error(`Screenshot failed: ${res.status}`);
const fs = require('node:fs/promises');
await fs.writeFile('shot.webp', Buffer.from(await res.arrayBuffer()));
ScreenshotNeo has an MCP server with take_screenshot, get_page_info, and capture_pdf tools for Claude, Cursor, and other MCP clients. The Free plan includes 1,000 shots per month with no card; paid plans start at $5 for 3,000 shots, and every feature is available on every plan.
Create a free ScreenshotNeo account to try the API with 1,000 screenshots per month and no card.
Short FAQ
Should I screenshot the SVG or the chart container?
Screenshot the SVG when it contains every required visual. Use the outer container when labels, legends, annotations, or controls are outside the SVG.
Does fullPage load every chart point?
No. It changes capture height; it does not guarantee that application data, lazy rendering, or animations have completed.
Can I use getBBox() directly as a clip?
Usually no. Its values are SVG user units and may exclude transforms, strokes, markers, and separate labels. Convert coordinates correctly or use the rendered element box.
Which format is best for chart labels?
PNG is the safest default for crisp text and thin lines. Use JPEG or WebP when smaller files matter and your consumer accepts them.
How do I capture a chart that changes with dark mode?
Set the page’s color scheme or use your capture service’s dark-mode option before the chart renders, then wait for the chart’s own ready condition.


