How to Capture Highcharts with Custom Text and CSS
Style Highcharts text and CSS, then export reliable PNG, JPEG, SVG, or PDF images with client-side code or a hosted screenshot API.
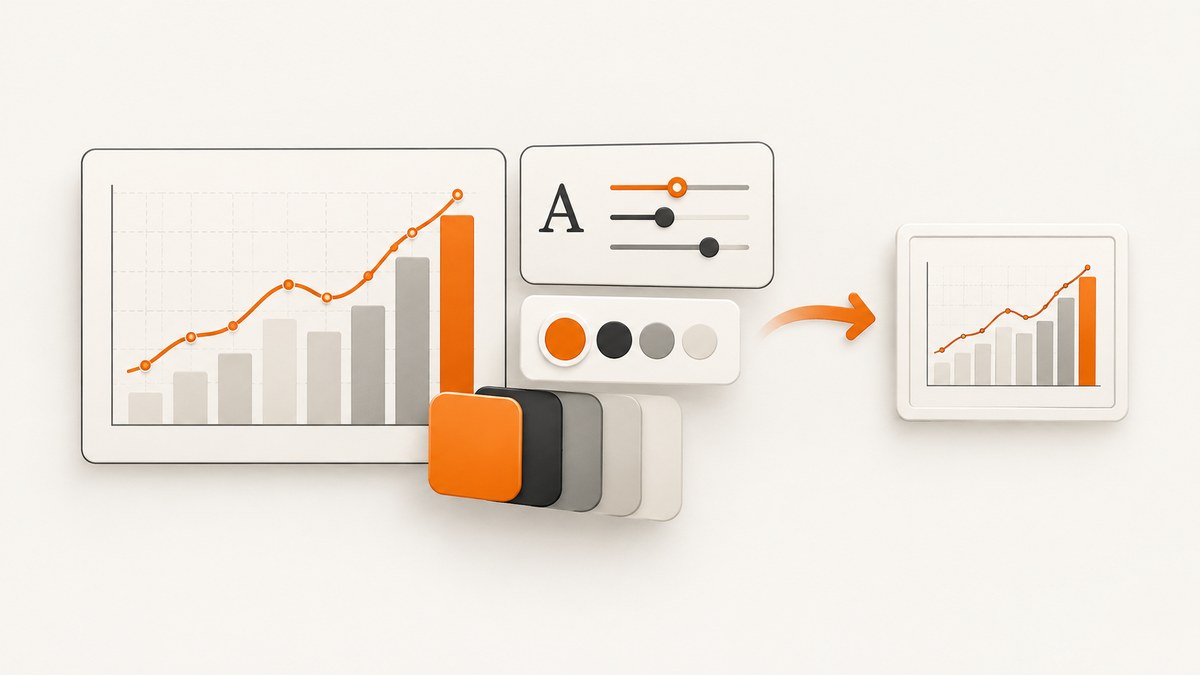
Direct answer: define chart text with Highcharts options such as title.style, axis-label style, and legend item styles. For a CSS-first design, enable chart.styledMode: true, load the version-matched highcharts.css, and override Highcharts classes. Set exporting.applyStyleSheets when you need custom CSS retained in an export; Highcharts documents this as the default behavior in styled mode. Use layout options such as margins and spacing to position text instead of CSS padding or margins.
From Highcharts v12.3, PNG, JPEG, and SVG exports run in the browser by default. PDF remains a special case: local PDF needs offline-exporting.js and its supporting libraries. If client-side export is not suitable for your browser or deployment, use a self-hosted export server or a screenshot API.
1. Build a chart with custom text styles
This complete HTML example creates a chart with a custom title, subtitle, axis labels, legend, data labels, and a CSS override. It uses the exporting module so the export menu can download PNG, JPEG, SVG, or PDF when the required modules are loaded.
<!doctype html>
<html lang="en">
<head>
  <meta charset="utf-8">
  <meta name="viewport" content="width=device-width, initial-scale=1">
  <title>Highcharts custom text export</title>
  <script src="https://code.highcharts.com/highcharts.js"></script>
  <script src="https://code.highcharts.com/modules/exporting.js"></script>
  <script src="https://code.highcharts.com/modules/offline-exporting.js"></script>
  <style>
    #container { max-width: 900px; height: 520px; margin: 2rem auto; }
    .highcharts-title { letter-spacing: 0.02em; }
    .highcharts-subtitle { font-style: italic; }
  </style>
</head>
<body>
  <div id="container"></div>
  <script>
    Highcharts.chart('container', {
      chart: {
        type: 'line',
        spacing: [24, 24, 24, 24]
      },
      title: {
        text: 'Monthly active users',
        style: {
          color: '#14213d',
          fontFamily: 'Inter, Arial, sans-serif',
          fontSize: '24px',
          fontWeight: '700'
        }
      },
      subtitle: {
        text: 'A custom subtitle exported with the chart',
        style: {
          color: '#52606d',
          fontFamily: 'Inter, Arial, sans-serif',
          fontSize: '14px'
        }
      },
      xAxis: {
        categories: ['Jan', 'Feb', 'Mar', 'Apr', 'May', 'Jun'],
        labels: {
          style: {
            color: '#334e68',
            fontFamily: 'Inter, Arial, sans-serif',
            fontSize: '12px'
          }
        },
        title: {
          text: 'Month',
          style: { color: '#243b53', fontWeight: '600' }
        }
      },
      yAxis: {
        title: {
          text: 'Users',
          style: { color: '#243b53', fontWeight: '600' }
        },
        labels: {
          style: {
            color: '#334e68',
            fontFamily: 'Inter, Arial, sans-serif',
            fontSize: '12px'
          }
        }
      },
      legend: {
        itemStyle: {
          color: '#102a43',
          fontFamily: 'Inter, Arial, sans-serif',
          fontWeight: '600'
        },
        itemHoverStyle: { color: '#0b7285' }
      },
      plotOptions: {
        series: {
          dataLabels: {
            enabled: true,
            style: {
              color: '#102a43',
              fontFamily: 'Inter, Arial, sans-serif',
              textOutline: 'none'
            }
          }
        }
      },
      exporting: {
        enabled: true,
        applyStyleSheets: true,
        scale: 2
      },
      series: [
        { name: 'Product', data: [120, 180, 240, 310, 380, 460] },
        { name: 'Marketing', data: [90, 130, 190, 230, 280, 340] }
      ]
    });
  </script>
</body>
</html>
Highcharts text style properties use JavaScript camel case, such as fontFamily and fontSize. CSS spellings such as font-family do not belong inside an option object.
2. Use styled mode for CSS-led designs
Styled mode removes presentational SVG attributes and lets CSS control colors, strokes, and font rules. Load the Highcharts stylesheet that matches your Highcharts version, then override the documented classes.

<link rel="stylesheet" href="https://code.highcharts.com/12.3.0/css/highcharts.css">
<style>
  .highcharts-root {
    font-family: Inter, Arial, sans-serif;
  }
  .highcharts-title {
    fill: #14213d;
    font-size: 24px;
    font-weight: 700;
  }
  .highcharts-subtitle {
    fill: #52606d;
  }
  .highcharts-axis-labels text {
    fill: #334e68;
  }
  .highcharts-grid-line {
    stroke: #d9e2ec;
  }
  .highcharts-series-0 .highcharts-graph {
    stroke: #0b7285;
  }
  .highcharts-series-1 .highcharts-graph {
    stroke: #f08c46;
  }
</style>
<script>
  Highcharts.chart('container', {
    chart: { styledMode: true },
    title: { text: 'Styled mode chart' },
    subtitle: { text: 'CSS supplies presentation' },
    series: [{ data: [1, 3, 2, 4] }]
  });
</script>
Use options for the text content and chart layout. Use CSS for presentation. General CSS margins and padding are unreliable for moving chart elements; use Highcharts options such as spacing, margin, axis titles, and legend positioning.
3. Preserve CSS, fonts, and layout during export
Custom CSS
Set exporting.applyStyleSheets: true when exporting a chart whose appearance depends on stylesheets. Highcharts documents this option as enabled by default in styled mode, but setting it explicitly makes the intent clear and protects code that may switch modes.
Custom fonts
Font loading is a frequent source of differences between the browser and the exported image. Wait until the font is available before creating or exporting the chart:
await document.fonts.ready;
const chart = Highcharts.chart('container', options);
await new Promise(requestAnimationFrame);
chart.exportChart({ type: 'image/png', scale: 2 });
From Highcharts v12.3, external fonts supplied with CSS @font-face rules are included in exported images. Setting fontFamily explicitly in export options disables automatic font inclusion, so verify the behavior for your chosen version and export path.
Output size and scale
The export scale controls pixel dimensions. A 600×400 chart exported with the documented default scale of 2 produces a 1200×800 image. Set scale deliberately when a downstream system requires a fixed size, and ensure the chart container has the intended width and height before export.
4. Download PNG, JPEG, SVG, or PDF
The exporting module provides the context menu and programmatic export methods. Client-side PNG, JPEG, and SVG exports are enabled by default from v12.3. Local PDF needs offline-exporting.js and supporting libraries.
const chart = Highcharts.chart('container', options);

// Download a PNG.
chart.exportChart({
  type: 'image/png',
  filename: 'monthly-active-users',
  scale: 2
});

// Download a JPEG with a white background.
chart.exportChart({
  type: 'image/jpeg',
  filename: 'monthly-active-users',
  backgroundColor: '#ffffff'
});

// Download SVG for later editing.
chart.exportChart({
  type: 'image/svg+xml',
  filename: 'monthly-active-users'
});

// Local PDF (requires offline-exporting.js and its dependencies).
chart.exportChart({
  type: 'application/pdf',
  filename: 'monthly-active-users'
});
Older or unsupported browsers can fall back to an export server unless fallback is disabled. Check Highcharts’ supported-browser information before promising fully offline behavior to users.
5. Export a chart after changing text or CSS
Update options, redraw, wait for fonts and layout, then export. This avoids capturing an old title or a chart whose labels have not reflowed.
chart.update({
  title: {
    text: 'Q2 revenue',
    style: { color: '#7f1d1d', fontSize: '28px' }
  }
}, true);

await document.fonts.ready;
await new Promise(requestAnimationFrame);
chart.exportChart({ type: 'image/png', scale: 2 });
For CSS changes, change a class or stylesheet, force a redraw with chart.reflow() when the container size changes, and export only after the browser has painted the new styles.
6. Client-side export versus an export server
| Route | Best fit | Trade-offs |
|---|---|---|
| Client-side export | Interactive applications and data that should remain in the browser | Requires supported browser features; PDF needs additional modules and libraries |
| Self-hosted Highcharts export server | Private infrastructure or a controlled rendering environment | You operate the Node.js service and its Puppeteer browser; it accepts chart configurations or SVG and renders PNG, JPG, PDF, or SVG |
| Public Highcharts export server | Occasional server rendering | Review its terms and fair-use policy; requests must include Referer and User-Agent |
Highcharts recommends considering client-side export first. A server is useful when browser support, repeatable rendering, or private infrastructure makes local export unsuitable.
7. Troubleshooting checklist
| Symptom | Likely cause | Fix |
|---|---|---|
| Title appears with the wrong font | Font was not loaded before export or is unavailable to the renderer | Wait for document.fonts.ready; verify @font-face URLs and version-specific export behavior |
| CSS colors disappear in the image | Styled-mode stylesheet is missing or styles are not copied into export | Load matching highcharts.css and set exporting.applyStyleSheets: true |
| Labels overlap the title | CSS margins were used for layout | Use spacing, margin, axis title options, or legend layout settings |
| Export is blurry | Scale is too low for the destination size | Increase scale and set a known container size |
| PDF export fails locally | offline-exporting.js or supporting libraries are missing |
Load the required modules, or use a server route |
| Export differs from the browser | Unsupported browser, late web fonts, animations, or a server renderer with different CSS | Wait for fonts and rendering, disable animation for export, and test the exact target browser or server |
| Public export requests are restricted | Missing headers or excessive usage under the public service policy | Send the required Referer and User-Agent, or operate a private server |
8. Or skip the browser setup
ScreenshotNeo can capture a rendered chart page with one GET request. It removes cookie and consent banners, newsletter popups, and chat widgets before capture; bot checks, blank pages, failed loads, timeouts, and cache hits are not billed, and response headers identify the page verdict and billing result. Its MCP server provides take_screenshot, get_page_info, and capture_pdf for Claude, Cursor, and other MCP clients. The Free plan includes 1,000 screenshots per month without a card; paid plans start at $5 for 3,000.

See the ScreenshotNeo API documentation for the available options.
curl -G "https://api.screenshotneo.com/v1/shot" -d access_key=YOUR_API_KEY --data-urlencode url=https://example.com/highcharts -o shot.webpimport requests
r = requests.get("https://api.screenshotneo.com/v1/shot", params={"access_key": "YOUR_API_KEY", "url": "https://example.com/highcharts"}, timeout=90)
open("shot.webp", "wb").write(r.content)const q = new URLSearchParams({ access_key: 'YOUR_API_KEY', url: 'https://example.com/highcharts' });
const res = await fetch(`https://api.screenshotneo.com/v1/shot?${q}`);Create a free ScreenshotNeo account with 1,000 screenshots a month and no card required.
9. Performance, reliability, and cost
- Use client-side export when the chart is already rendered and data should stay in the browser.
- Wait for fonts and network-loaded data once, then export; repeated redraws add work and can produce inconsistent images.
- Choose an export scale that matches the delivery size. Higher scales increase pixels, memory use, and download size.
- Disable animation for deterministic batch exports.
- For server rendering, pin the Highcharts version and stylesheet, keep the browser runtime warm, and monitor failures caused by missing fonts or external resources.
- For ScreenshotNeo, caching with a chosen TTL can avoid repeated captures; failed loads and other non-clean results are not billed.
10. FAQ
Can I style only the exported chart?
Yes. Pass export-specific options to chart.exportChart, or use a separate export stylesheet and ensure it is included when applyStyleSheets is enabled.
Should I use styled mode or option-based styles?
Use option-based styles for a self-contained chart configuration. Use styled mode when a shared CSS theme should control many charts.
Which format is best for a report?
Use PNG or JPEG for raster documents, SVG when the consuming tool supports vector graphics, and PDF when you need a document output and have verified the required local or server export route.
Does a screenshot API replace Highcharts exporting?
It can replace the browser-export setup when the chart is available at a URL. The chart still needs to render correctly in that page; the API captures the resulting page or element.
Where can I verify the documented behavior?
Read Highcharts’ design and style guide, CSS styling guide, export module overview, client-side export guide, applyStyleSheets API reference, server setup guide, and export server terms.


