How to Capture Highcharts Charts With html2canvas
Capture a rendered Highcharts chart as a PNG in the browser with html2canvas, solve blank output and CORS issues, and compare native export.
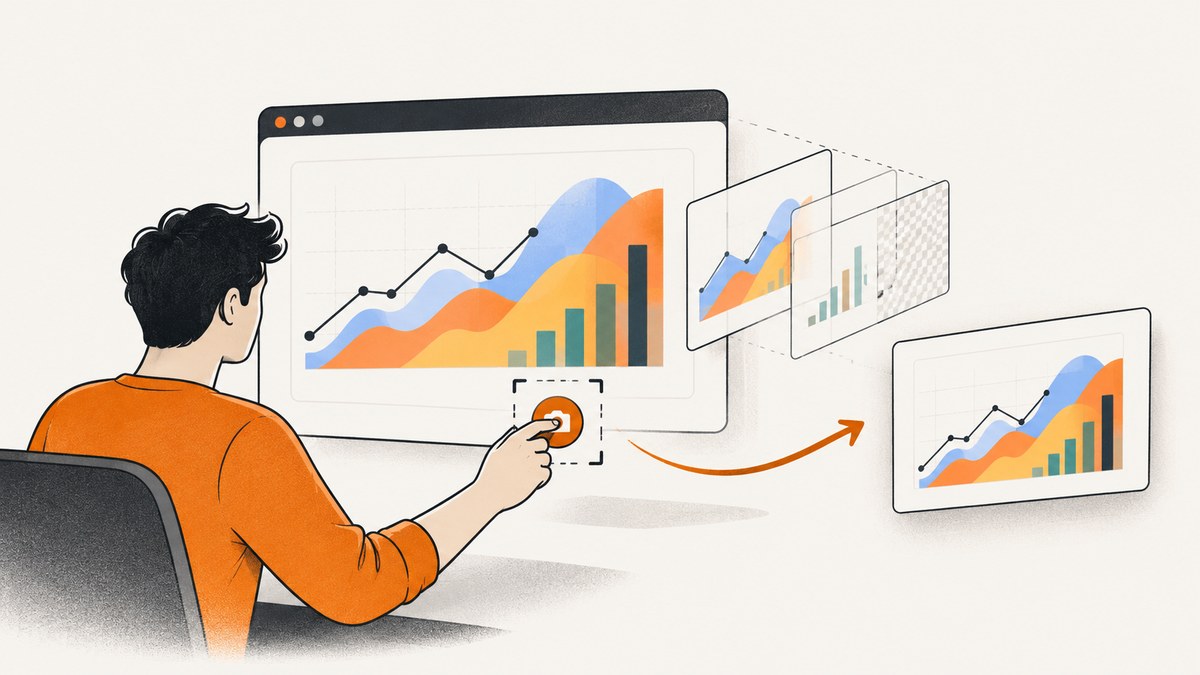
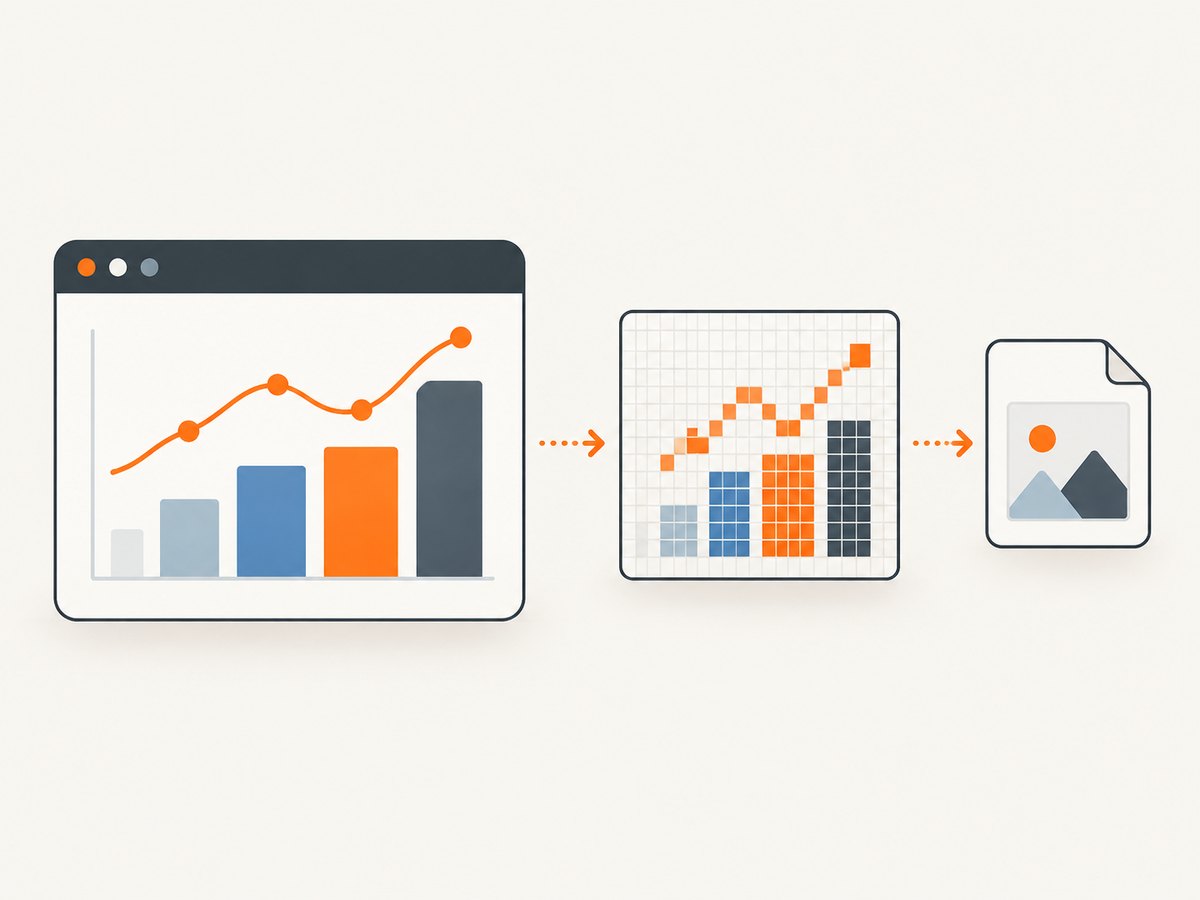
Direct answer: render the Highcharts chart completely, select its container, pass that element to html2canvas(), then export the returned canvas with toBlob() or toDataURL(). html2canvas rebuilds the image from the DOM and CSS; it does not take a native pixel screenshot, so unsupported CSS, SVG details, cross-origin images and iframes can produce differences or blank areas. See the html2canvas documentation.
1. Complete browser example
This example waits for Highcharts to create the chart, captures only its container, and downloads a PNG. It uses a white background and the device pixel ratio for sharper output.
<!doctype html>
<html lang="en">
<head>
  <meta charset="utf-8">
  <meta name="viewport" content="width=device-width, initial-scale=1">
  <title>Highcharts html2canvas capture</title>
  <script src="https://code.highcharts.com/highcharts.js"></script>
  <script src="https://cdn.jsdelivr.net/npm/html2canvas@1.4.1/dist/html2canvas.min.js"></script>
  <style>
    #container { width: 900px; height: 500px; }
  </style>
</head>
<body>
  <div id="container"></div>
  <button id="download" type="button">Download PNG</button>

  <script>
    const chart = Highcharts.chart('container', {
      title: { text: 'Monthly revenue' },
      xAxis: { categories: ['Jan', 'Feb', 'Mar', 'Apr', 'May'] },
      series: [{ name: 'Revenue', data: [12, 18, 15, 24, 29] }]
    });

    document.querySelector('#download').addEventListener('click', async () => {
      const element = document.querySelector('#container');
      const canvas = await html2canvas(element, {
        backgroundColor: '#ffffff',
        useCORS: true,
        scale: window.devicePixelRatio || 1
      });

      canvas.toBlob(blob => {
        if (!blob) throw new Error('The browser could not create a PNG blob.');
        const url = URL.createObjectURL(blob);
        const link = document.createElement('a');
        link.href = url;
        link.download = 'highcharts-chart.png';
        link.click();
        URL.revokeObjectURL(url);
      }, 'image/png');
    });
  </script>
</body>
</html>
Why the timing matters
Call html2canvas only after the initial chart render and after asynchronous data, fonts and images have settled. If you update the chart immediately before capture, wait for the update callback or the promise that loads your data. A stable pixel width and height prevents a second layout pass from changing labels while the canvas is being built.
2. Capture a chart after asynchronous data
async function captureChartAfterData() {
  const response = await fetch('/api/revenue');
  if (!response.ok) throw new Error(`Data request failed: ${response.status}`);
  const points = await response.json();

  const chart = Highcharts.chart('container', {
    title: { text: 'Revenue' },
    series: [{ name: 'Revenue', data: points }]
  });

  // Let the browser apply layout and paint the updated SVG.
  await new Promise(requestAnimationFrame);
  await document.fonts.ready;

  const canvas = await html2canvas(document.querySelector('#container'), {
    backgroundColor: '#fff',
    useCORS: true,
    scale: 2
  });
  return canvas;
}
For images used by custom HTML labels or annotations, wait for each image’s load event before capture. A short delay can help with third-party widgets, but waiting for a specific application state is more reliable than using a fixed timeout.
3. Download, upload or convert the canvas
Download with toBlob()
function downloadCanvas(canvas, filename = 'chart.png') {
  canvas.toBlob(blob => {
    if (!blob) return;
    const url = URL.createObjectURL(blob);
    const a = document.createElement('a');
    a.href = url;
    a.download = filename;
    a.click();
    URL.revokeObjectURL(url);
  }, 'image/png');
}
Upload to an API
async function uploadCanvas(canvas) {
  const blob = await new Promise(resolve => canvas.toBlob(resolve, 'image/png'));
  if (!blob) throw new Error('Canvas encoding failed');
  const form = new FormData();
  form.append('file', blob, 'highcharts.png');
  const response = await fetch('/api/upload', { method: 'POST', body: form });
  if (!response.ok) throw new Error(`Upload failed: ${response.status}`);
}
toDataURL('image/png') is convenient for small images but keeps the entire encoded file in memory. Prefer toBlob() for larger charts or uploads.
4. Options that affect the result
| Option | Use | Important limit |
|---|---|---|
backgroundColor |
Sets the canvas background, such as #fff. |
Use null for transparency when the source supports it. |
scale |
Controls output pixel density. window.devicePixelRatio is a practical default. |
Higher values increase memory and encoding time. |
useCORS |
Attempts to load cross-origin images with CORS. | The image server must send compatible CORS headers; this cannot bypass browser security. |
width, height |
Overrides the capture dimensions. | Keep them aligned with a stable chart layout. |
x, y |
Adds an offset to the capture. | Usually unnecessary when capturing the chart element itself. |
onclone |
Changes the cloned document before rendering. | Useful for hiding buttons or applying print-only styles without changing the live chart. |
ignoreElements |
Skips controls, tooltips or other nodes. | Do not skip SVG nodes that contain the chart. |
const canvas = await html2canvas(document.querySelector('#container'), {
  backgroundColor: '#ffffff',
  useCORS: true,
  scale: 2,
  onclone: clonedDocument => {
    clonedDocument.querySelectorAll('.capture-only-hidden')
      .forEach(node => { node.style.display = 'none'; });
  }
});
5. Highcharts-specific checks
- Capture the right node. Select the chart container, not an unrelated page wrapper, when you need only the chart.
- Set dimensions. Give the container an explicit width and height. Responsive dimensions can change between layout and capture.
- Fix clipping. Temporarily remove
overflow: hiddenor enlarge the target if labels are cut off. - Wait for fonts. Use
await document.fonts.readywhen label metrics depend on web fonts. - Handle tooltips deliberately. Move the pointer away or hide the tooltip in the cloned document if it should not appear.
- Check HTML labels and complex SVG. html2canvas supports many common properties, but its reconstruction can differ from the browser’s native SVG rendering.
6. Cross-origin images and iframes
Images loaded from another origin need same-origin delivery or a proxy/CORS arrangement. The remote server must allow your origin with the appropriate Access-Control-Allow-Origin response header. useCORS: true only opts into that browser mechanism; it does not grant access to an image server that refuses it.
Cross-origin iframes cannot be rendered by html2canvas. Capture content hosted in your own document, arrange a server-side rendering path, or ask the embedded application to produce its own export. If a chart includes external images, preload CORS-enabled copies or proxy them through your origin.
7. html2canvas versus native Highcharts export
Highcharts has a native export path. Its exporting module supports PNG, JPEG, SVG and PDF. Since version 12.3.0, exporting.js handles PNG, JPEG and SVG locally by default. Read the Highcharts exporting documentation.
| Requirement | html2canvas | Highcharts export |
|---|---|---|
| Capture surrounding HTML | Yes, for same-document content html2canvas can render. | Designed for the chart rather than arbitrary page sections. |
| Fidelity to Highcharts SVG | Can differ because it reconstructs DOM and CSS. | Uses Highcharts’ chart export pipeline. |
| Formats | Canvas formats such as PNG and JPEG. | PNG, JPEG, SVG and PDF, subject to module and browser support. |
| Cross-origin behavior | Restricted by browser CORS and iframe rules. | Chart data and assets still need to be available to the chosen export path. |
| Privacy | Runs in the browser. | Local export stays in the browser; remote export sends generated SVG to Highcharts’ export server. |
| Dimensions | Set the element size and html2canvas scale. | Use exporting.sourceWidth, sourceHeight and scale; documented fallback dimensions are 600 by 400 with scale 2 when no explicit dimensions exist. |
<script src="https://code.highcharts.com/highcharts.js"></script>
<script src="https://code.highcharts.com/modules/exporting.js"></script>
<script>
  const chart = Highcharts.chart('container', {
    exporting: {
      sourceWidth: 1200,
      sourceHeight: 700,
      scale: 1
    },
    series: [{ data: [1, 3, 2, 5] }]
  });

  chart.exportChart({
    type: 'image/png',
    filename: 'highcharts-chart'
  });
</script>
Use native export when the deliverable is the chart itself and you need Highcharts’ formats or export sizing. Use html2canvas when the output must include surrounding HTML, custom overlays or page composition. Local PDF is a special case: it requires offline-exporting.js plus jsPDF/svg2pdf dependencies, and PDFs containing images can fall back to the export server. Highcharts also documents a Node/Puppeteer export server for self-hosted rendering when chart data must remain under your control.
8. Troubleshooting
| Symptom | Likely cause | Fix |
|---|---|---|
| Blank canvas | Capture ran before Highcharts or its data finished rendering. | Await data, requestAnimationFrame and fonts; capture after chart creation. |
SecurityError from toDataURL() |
A cross-origin image tainted the canvas. | Serve the image with CORS, proxy it through your origin, or remove it before capture. |
| Chart missing but page content appears | SVG features or CSS used by the chart are not reproduced by html2canvas. | Compare with native Highcharts export; simplify unsupported styling or export the chart natively. |
| External iframe is empty | Cross-origin iframes are blocked. | Capture same-origin content or use an export/rendering service. |
| Labels are clipped | Fixed height, overflow rules or a responsive reflow. | Increase dimensions, remove clipping in onclone, and capture after layout settles. |
| Fonts look wrong | Web fonts had not loaded. | Await document.fonts.ready and verify the font request succeeds. |
| Browser tab freezes | Very large dimensions or a high scale consume too much memory. | Lower scale, capture a smaller element, or move rendering to a server. |
| Native export sends data externally | exporting.local is disabled or local export cannot handle the chart. |
Keep local export enabled, or self-host the Highcharts Node/Puppeteer server. |
| Native export fails on a complex chart | Blob or data-URL limits were exceeded. | Reduce dimensions, use a file/blob workflow, and configure exporting.error when disabling fallback. |
9. Performance, reliability and cost
- Performance: capture only the chart node, keep dimensions bounded, and avoid an unnecessarily large scale. Encoding with
toBlob()avoids holding a base64 string. - Reliability: wait on actual data, font and image readiness; use deterministic dimensions; retry failed network data requests before capture rather than retrying canvas work blindly.
- Browser limits: a canvas is held in memory as raw pixels before compression. A 2,000 by 1,000 capture at scale 2 is 16 million pixels before browser overhead, so large dashboards may exceed practical memory limits.
- Privacy: html2canvas runs locally. Native Highcharts local export also stays local; the remote Highcharts export server receives generated SVG, so choose local or self-hosted export for sensitive chart data.
- Cost: the browser libraries have no per-capture API charge, but client-side work uses the user’s CPU and memory. A server renderer adds infrastructure and bandwidth costs.
10. Or skip the browser setup
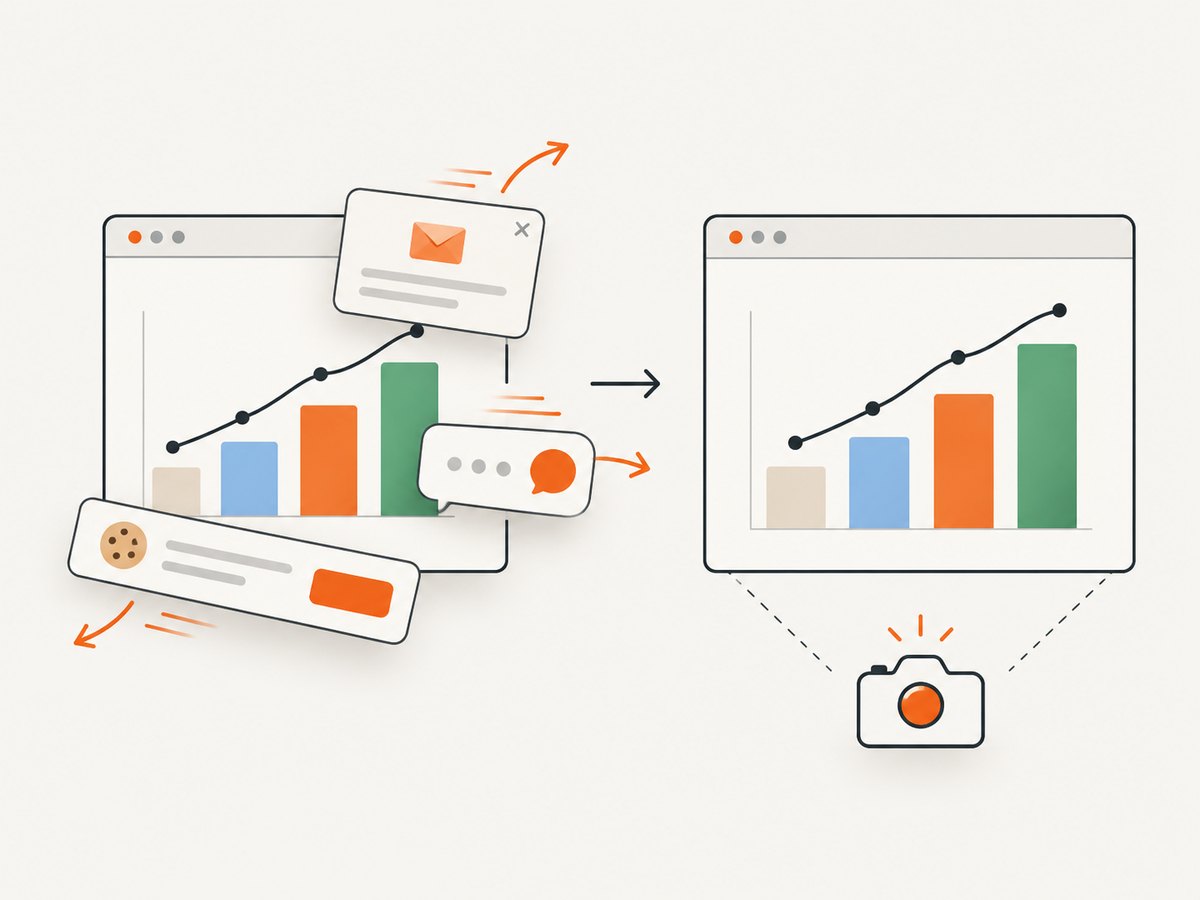
ScreenshotNeo provides a website screenshot API and MCP server. It can capture a rendered chart page without installing or managing a browser. Cookie banners, newsletter popups and chat widgets are removed before the shot; bot checks, blank pages and failed loads are never billed. Its MCP server lets AI agents take screenshots, and the free plan includes 1,000 screenshots a month with no card; paid plans start at $5 for 3,000 shots. See the ScreenshotNeo API documentation.
curl -G "https://api.screenshotneo.com/v1/shot" -d access_key=YOUR_API_KEY --data-urlencode url=https://example.com/chart-page -o shot.webpimport requests
r = requests.get("https://api.screenshotneo.com/v1/shot", params={"access_key": "YOUR_API_KEY", "url": "https://example.com/chart-page"}, timeout=90)
r.raise_for_status()
open("shot.webp", "wb").write(r.content)const q = new URLSearchParams({ access_key: 'YOUR_API_KEY', url: 'https://example.com/chart-page' });
const res = await fetch(`https://api.screenshotneo.com/v1/shot?${q}`);
if (!res.ok) throw new Error(`Screenshot failed: ${res.status}`);
const buffer = Buffer.from(await res.arrayBuffer());
require('fs').writeFileSync('shot.webp', buffer);Use the browser method when you need a canvas in the user’s session or must compose extra local DOM. Use ScreenshotNeo when you want a repeatable URL capture with consent cleanup, optional waiting and device settings handled by an API. Create a free ScreenshotNeo account with 1,000 screenshots per month and no card.
FAQ
Can html2canvas capture the Highcharts SVG directly?
Yes, it can reconstruct the chart container, but the result can differ from the browser’s native SVG rendering. Native Highcharts export is usually the safer choice for a chart-only deliverable.
Why is useCORS: true not enough?
The remote image server must opt into CORS. The option cannot bypass the browser’s same-origin policy.
Which format should I use?
Use PNG for sharp labels and lossless charts, JPEG for smaller photographic compositions, and native Highcharts SVG or PDF when vector or document output is required.
Can I capture a chart inside a cross-origin iframe?
No. Cross-origin iframe content is not readable by html2canvas; capture it in its own origin or use a server-side renderer.
How do I make captures reproducible?
Fix the viewport and chart dimensions, wait for data, fonts and images, set an explicit scale, and keep the chart configuration and browser version consistent.


