How to Capture and Inspect Log Snapshots in Cypress
Learn how Cypress time-travel snapshots work, how to pin and inspect them, and how to add named before/after snapshots to custom commands.

Direct answer: Run your test in Cypress Open Mode, hover over a Command Log entry to time-travel the application preview to the state Cypress recorded for that command, then click the entry to pin that snapshot. If a command has more than one recorded state, use its snapshot menu to switch between them. For custom commands, create a first-class entry with Cypress.log() and call log.snapshot('before') and log.snapshot('after').
A Cypress log snapshot is a recorded DOM state for debugging. It is different from an image screenshot: snapshots let you inspect the rendered page and command details at a point in the test, while cy.screenshot() writes a visual image.
What Cypress captures
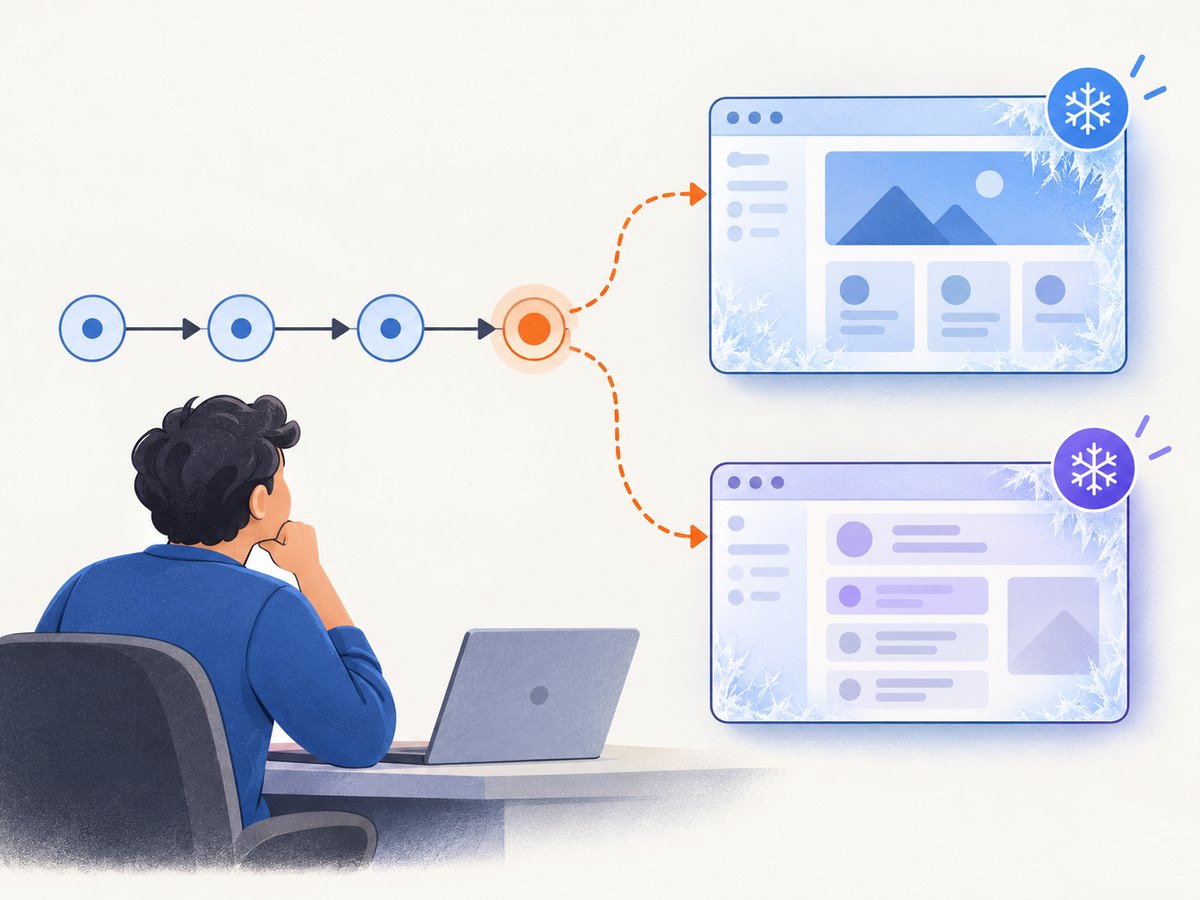
Cypress captures a snapshot for every command, which lets you time travel to previous states while you debug. The Command Log displays commands and hooks in execution order. When you move the pointer over a command, Cypress restores the application or component-under-test preview to the state associated with that command. Clicking the command pins the state so it remains visible while you inspect the page or move the pointer elsewhere.
Some actions expose multiple snapshots. An action may have a state before it runs and another after it finishes. Open the command’s snapshot selector and choose the state you need. Cypress keeps a default amount of command data and snapshots equivalent to 50 tests for time travel; treat this as a retention setting documented by Cypress, not as a guarantee about how long a particular run remains available. See the Cypress Open Mode documentation.
Inspect an existing snapshot step by step
- Start the project in Open Mode with
cypress open, or use your normal package script. - Select the browser and spec, then run the test so the Command Log is populated.
- Expand the test in the Command Log. Commands, hooks, and their status appear in sequence.
- Hover over a command. The application preview time-travels to that command’s recorded DOM state.
- Click the command to pin it. The preview stays on that state while you inspect it.
- If a snapshot menu is shown, select the relevant entry, such as a before or after state.
- Use the browser’s Elements panel for deeper inspection. Cypress documentation describes right-clicking an element to jump to the Elements panel.
This workflow is best when you need to answer, “What did the page look like when this command ran?” It can reveal a missing element, an unexpected attribute, a loading state, or a modal that appeared between two commands without requiring you to reproduce the timing manually.
Capture named snapshots in a custom command
Cypress.log() creates a first-class Command Log entry for custom commands. The returned log object provides snapshot(), set(), get(), end(), and error(). Use autoEnd: false when asynchronous work separates the before and after states.
const log = Cypress.log({
  name: 'loadProfile',
  message: 'loading profile',
  autoEnd: false,
  consoleProps: () => ({ status: 'running' }),
})

log.snapshot('before')

cy.request('/api/profile').then((response) => {
  cy.get('[data-cy=profile]').invoke('text', response.body.name)

  log.set({
    consoleProps: () => ({
      status: 'complete',
      httpStatus: response.status,
      profile: response.body.name,
    }),
  })

  log.snapshot('after')
  log.end()
})
When the entry is pinned in the Command Log, its snapshot menu can switch between before and after. The example updates console properties after the request completes, so clicking the command also gives you useful diagnostic data.
Registering a reusable custom command
Cypress.Commands.add('fillAndSubmitProfile', (name) => {
  const log = Cypress.log({
    name: 'fillAndSubmitProfile',
    message: name,
    autoEnd: false,
    consoleProps: () => ({ status: 'starting', name }),
  })

  log.snapshot('before')

  cy.get('[data-cy=profile-name]')
    .clear()
    .type(name)
  cy.get('[data-cy=save-profile]').click()

  cy.get('[data-cy=profile-status]')
    .should('contain', 'Saved')
    .then(() => {
      log.set({
        consoleProps: () => ({ status: 'saved', name }),
      })
      log.snapshot('after')
      log.end()
    })
})
Use log.end() when your custom command controls completion. The API also exposes log.finish(), which finalizes an entry and can add a final snapshot, but Cypress’s API guidance recommends end() for custom commands when you are managing the lifecycle yourself.
Snapshot API details that prevent confusing logs
Cypress.log() versus cy.log()
cy.log(message, ...args) writes explanatory text to the Command Log and yields null. It does not provide the named DOM snapshot workflow described above. Use Cypress.log() when you need a custom entry with snapshots, console properties, or manual completion.
Choosing snapshot names
Names such as before, after, request, and rendered make a multi-stage command understandable. Keep names tied to observable states rather than implementation details. Capture the before state immediately before the operation and the after state only after the page has reached the condition your command promises.
Asynchronous work
Set autoEnd: false before starting asynchronous work. Update console properties with log.set() when the result is known, call log.snapshot() for the final DOM, and call log.end(). If you end the log too early, the pinned entry may not describe the completed state.
When to use screenshots, pause, or debug
| Need | Use | What you get |
|---|---|---|
| Recorded DOM at a command | Command Log hover and pin | Time-travel inspection of the recorded state |
| Named states in a custom command | Cypress.log() and log.snapshot(name) |
Before/after or other named DOM states |
| Live, step-by-step execution | cy.pause() |
A pause point where you can advance commands interactively |
| Inspect the current yielded subject | .debug() |
The subject exposed to browser developer tools |
| Static visual evidence | cy.screenshot() |
Viewport, full-page, or runner image capture |
| Terminal or automation access | cypress tap |
Reporter, command, pin, DOM, and accessibility-tree inspection |
cy.pause() and .debug() are interactive controls, not snapshot-writing APIs. Use cy.screenshot() when the artifact must be an image. Its capture option supports viewport, fullPage, and runner; runner capture includes the Cypress Command Log. Cypress notes that automatic failure screenshots are coerced to runner capture.
Inspect snapshots from the terminal with cypress tap
Cypress documents cypress tap for accessing a running Open Mode session. This is useful when triaging tests from a terminal or building a diagnostic workflow.
# Show the running tests and command entries
npx cypress tap reporter

# Display a command's details, snapshots, and console properties
npx cypress tap command <command-id>

# Pin a command snapshot by name or one-based index
npx cypress tap pin <command-id> before

# Inspect the pinned DOM or accessibility tree
npx cypress tap dom
npx cypress tap aria
The exact command identifier comes from the tap reporter output. A pin can select a named snapshot such as before or after, or a one-based snapshot index. This route exposes recorded information; it does not create a separate image file.
Debugging and troubleshooting
The preview does not change when I hover
Confirm that the test is running in Open Mode and that the command has finished. Hovering over a command in a headless cypress run report cannot provide the interactive preview. If the command has no recorded application state, pin another command that does.
I can see the command but not the expected before/after state
The command may expose only one snapshot, or the custom log may have ended before the second call. Set autoEnd: false, call log.snapshot('before') before the asynchronous operation, and call log.snapshot('after') after the DOM assertion that defines completion.
The custom entry remains marked as running
Manual entries need an explicit log.end(). Put it in the success path after the final snapshot, and make sure error handling also ends or reports the log appropriately. An entry that is never ended cannot accurately describe a completed command.
The snapshot shows stale data
A snapshot is historical. It is not a live view of the current page. Pin the command that follows the state change, or add a named after snapshot after the application has rendered the expected result. Use a retrying assertion such as should() before capturing the final state.
I need more diagnostic text
Set DEBUG=cypress:* before cypress run or cypress open when broad Cypress debug output is appropriate. Cypress warns that broad logging can produce a large amount of data and affect performance; narrow the selector when practical and enable it only while investigating.
DEBUG=cypress:server:util:cypress:server npx cypress openChoose a narrower namespace that matches the subsystem you are investigating. Avoid committing large debug logs or relying on their exact format in automation.
Performance, reliability, and retention considerations
- Keep custom logs focused. Snapshot only meaningful boundaries in a long asynchronous command. Excessive custom entries make the Command Log harder to scan.
- Use assertions as synchronization. Capture the after state after a stable assertion, rather than after an arbitrary short delay.
- Expect dynamic content. Time, random IDs, animations, and network-driven widgets can differ between runs. Inspect the DOM state relevant to the failure instead of treating every pixel or text node as permanent.
- Separate evidence types. A pinned snapshot is ideal for DOM and console inspection; a screenshot is better for sharing visual layout evidence.
- Plan for retention. Cypress’s documented default covers 50 tests worth of snapshots and command data. For long exploratory sessions, inspect or export evidence before older entries leave the available history.
- Limit debug output. Broad
DEBUGlogging increases I/O and can slow diagnosis, especially in large suites.
Or skip the browser setup
If your goal is a repeatable image or PDF of a URL rather than a Cypress DOM snapshot, ScreenshotNeo provides a single HTTP request. It can accept consent banners before capture and remove more than 60 known consent platforms, newsletter popups, and chat widgets; each step can be turned off. Bot checks, blank pages, timeouts, failed loads, and cache hits cost nothing, and the response identifies the result with X-Page-Verdict and X-Billed headers. It also provides an MCP server with take_screenshot, get_page_info, and capture_pdf for Claude, Cursor, and other MCP clients.
See the complete option list and parameter reference in the ScreenshotNeo documentation. This is a capture service, so it complements Cypress snapshots rather than replacing time-travel inspection of a test’s recorded DOM.
cURL
curl -G "https://api.screenshotneo.com/v1/shot" \
  -d access_key=YOUR_API_KEY \
  --data-urlencode url=https://stripe.com \
  -o shot.webp
Python
import requests

r = requests.get(
    "https://api.screenshotneo.com/v1/shot",
    params={"access_key": "YOUR_API_KEY", "url": "https://stripe.com"},
    timeout=90,
)
r.raise_for_status()
open("shot.webp", "wb").write(r.content)
Node.js
const q = new URLSearchParams({
  access_key: 'YOUR_API_KEY',
  url: 'https://stripe.com',
})
const res = await fetch(`https://api.screenshotneo.com/v1/shot?${q}`)
if (!res.ok) throw new Error(`Screenshot request failed: ${res.status}`)
const buffer = Buffer.from(await res.arrayBuffer())
await import('node:fs/promises').then((fs) => fs.writeFile('shot.webp', buffer))
ScreenshotNeo supports full-page capture with lazy images loaded, CSS-selector element capture, dark mode, device presets and custom viewports, retina scale, PDF paper and margin settings, custom CSS and JavaScript, clicks, selector or network-idle waits, request blocking, headers, cookies, user agents, authorization, timezone, geolocation, transparent backgrounds, resizing, TTL caching, signed links, asynchronous jobs with signed webhooks, bulk capture for up to 100 URLs per call, and a usage API. Parameter names used by other screenshot APIs also work, which can simplify migration.
The Free plan includes 1,000 screenshots per month with no card. Paid plans start at $5 for 3,000 shots; yearly billing gives two months free, and every feature is included on every plan. Create a free ScreenshotNeo account to try it.
FAQ
Does a log snapshot save a PNG?
No. It records a DOM state for Cypress time travel. Use cy.screenshot() when you need an image.

Can I inspect a snapshot after the test finishes?
In Open Mode, inspect the available Command Log history. Cypress keeps a documented default of 50 tests worth of snapshots and command data, so older entries may no longer be available.
Should I use cy.log() for custom snapshots?
No. Use Cypress.log() and its snapshot() method. cy.log() is for messages and yields null.
Can snapshots capture component tests?
Yes. The same Command Log time-travel workflow applies to the application or component preview recorded for a command.
How do I inspect accessibility information?
Pin the desired state, then use the documented cypress tap aria command for terminal inspection of the pinned accessibility tree.


