How to Capture Leaflet SVG Vector Layers as PNG with PhantomJS 1.9
Capture Leaflet SVG paths as a PNG with PhantomJS 1.9. Learn when to keep SVG, when to use Canvas, and how to handle missing layers, tiles, and sizing.
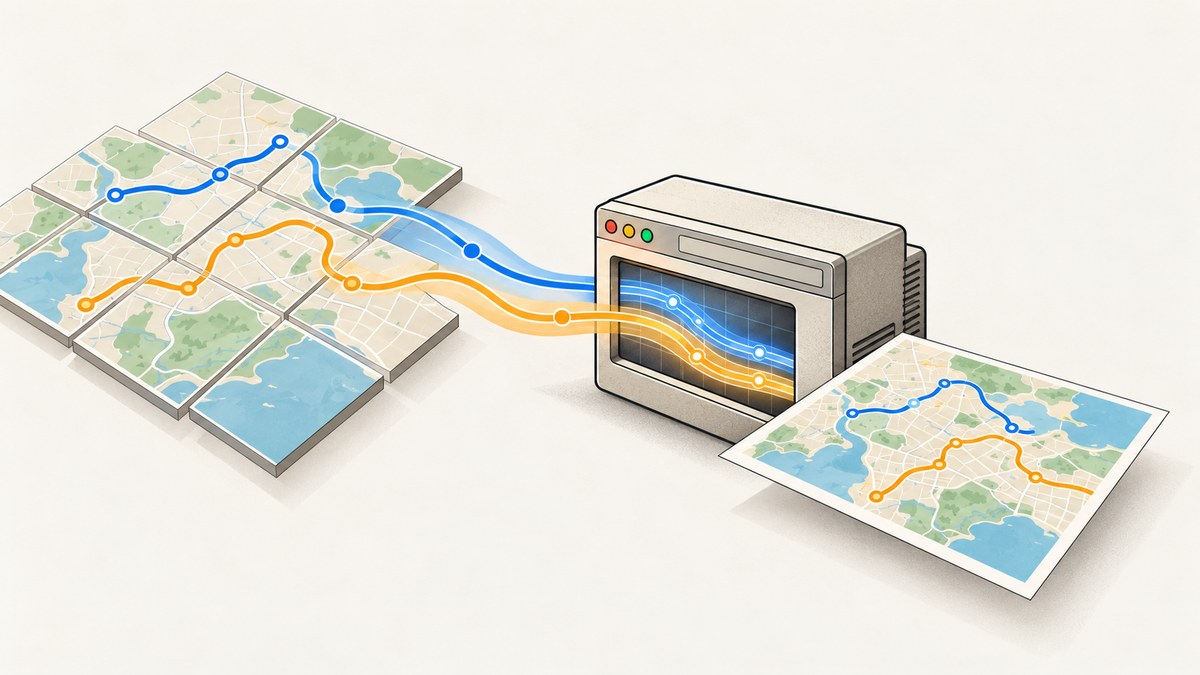
To capture Leaflet SVG vector layers as a PNG with PhantomJS 1.9, let Leaflet finish rendering the map, then call page.render('map.png'). A direct page screenshot can include both SVG paths and Canvas content: PhantomJS uses WebKit to render the page. Keep Leaflet’s default SVG renderer for this approach. Switch paths to Canvas only when your export method depends on Canvas, such as leaflet-image.
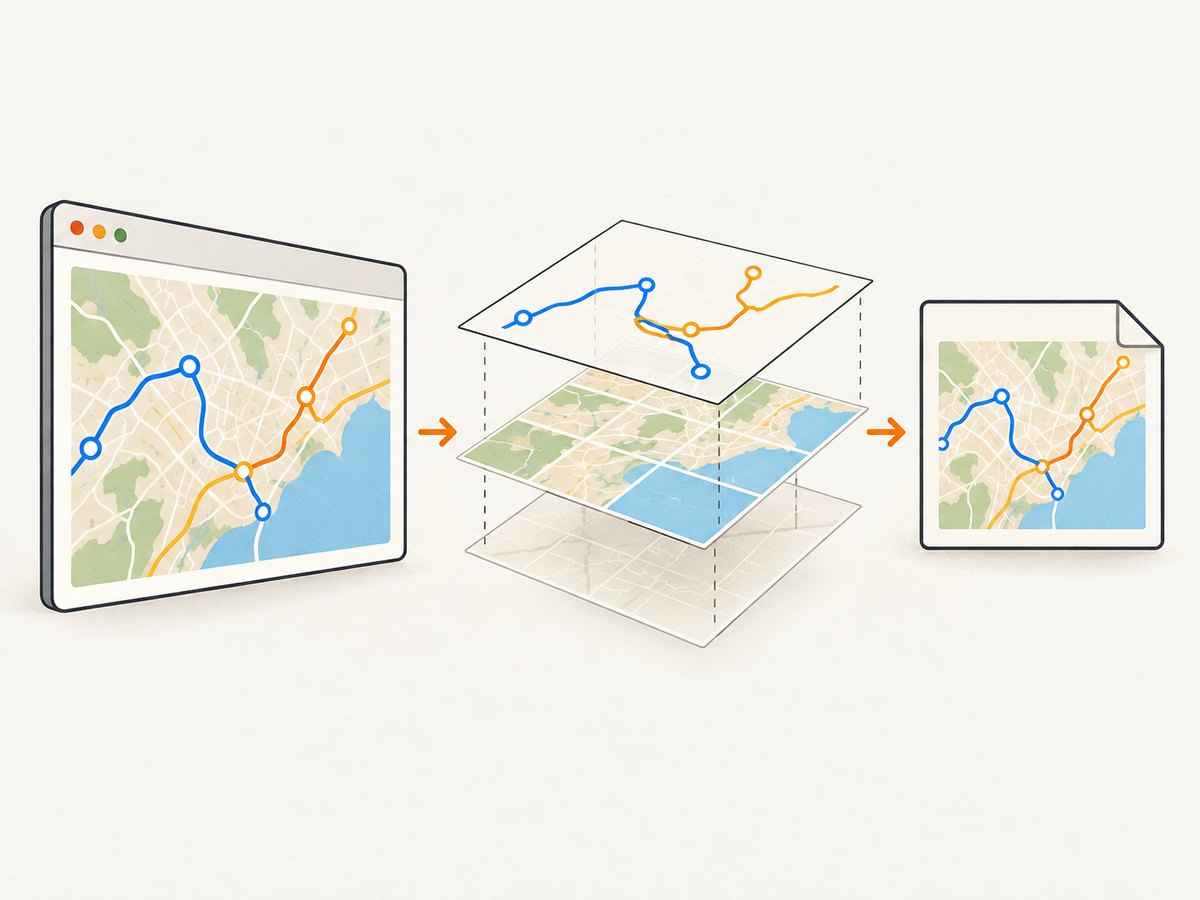
The reliable sequence is: create and size the map, add the layers, wait for tiles and overlays, signal that the page is ready, and only then render. A fixed delay can demonstrate the sequence, but it is not a dependable readiness check.
1. Choose the right capture path
There are two common ways to export a Leaflet map. They have different rendering constraints.
| Approach | Vector rendering | HTML controls and markers | Image and CORS constraints |
|---|---|---|---|
| PhantomJS page screenshot | Captures the rendered page, including SVG and Canvas | Includes visible page content, such as controls and HTML-based markers | External resources still need to load in the page |
| Canvas exporter such as leaflet-image | Export paths through Canvas; configure paths accordingly | HTML features such as L.divIcon, zoom controls, and legends are not rasterized |
Tiles and marker images must be CORS-compatible |
For a full-page screenshot through PhantomJS, you normally do not need to convert Leaflet’s SVG paths to Canvas. Leaflet 1.9.4 uses SVG as its default path renderer. Its preferCanvas option changes the default to Canvas, while a layer can select its own renderer. See the Leaflet reference and the PhantomJS screen capture documentation.
If your pipeline calls a Canvas exporter, set preferCanvas: true on the map or pass renderer: L.canvas() to each vector layer that must appear. That choice applies to the export pipeline; it is not a requirement for PhantomJS page rendering.
2. Create a map page that reports readiness
The example below creates a map with a tile layer and an SVG polyline, then sets a readiness flag after the map has been positioned and its initial tiles have loaded. Save it as map.html, serve it from a local HTTP server, and make sure the tile URL and attribution match the provider you are authorized to use.
<!doctype html>
<html>
<head>
<meta charset="utf-8">
<meta name="viewport" content="width=device-width, initial-scale=1">
<link rel="stylesheet" href="https://unpkg.com/leaflet@1.9.4/dist/leaflet.css">
<style>
html, body { margin: 0; width: 1280px; height: 800px; }
#map { width: 1280px; height: 800px; }
</style>
</head>
<body>
<div id="map"></div>
<script src="https://unpkg.com/leaflet@1.9.4/dist/leaflet.js"></script>
<script>
window.mapReady = false;
var map = L.map('map').setView([51.505, -0.09], 13);
var tiles = L.tileLayer('https://tile.openstreetmap.org/{z}/{x}/{y}.png', {
attribution: '© OpenStreetMap contributors'
}).addTo(map);
var line = L.polyline([
[51.51, -0.12], [51.505, -0.09], [51.50, -0.06]
], { color: '#1769aa', weight: 5 }).addTo(map);
tiles.once('load', function () {
// The initial tile layer has loaded. Add app-specific checks here
// if overlays, animations, or other asynchronous data remain.
window.mapReady = true;
});
</script>
</body>
</html>The readiness flag is deliberately page-owned. PhantomJS can poll it without guessing how long a particular tile provider, network, or app takes. For apps with multiple tile layers, data requests, animated overlays, or custom icons, set the flag only after all the work needed in the final frame is complete. A tile layer’s initial load event alone does not prove that unrelated asynchronous application work has finished.
For a vector-only map with no tiles, set the flag after you add the paths and finish any layout or data work. Ordinary Leaflet path layers and L.SVGOverlay are related vector features, but they use different APIs: an SVG overlay binds an SVG element to geographic bounds. See the Leaflet SVG reference.
3. Render the PNG with PhantomJS 1.9
Save this script as capture.js. It opens the map page at a fixed viewport, polls the page’s readiness flag, and renders a PNG when ready. The timeout is a fail-safe so a broken page does not wait forever.
var page = require('webpage').create();
var system = require('system');
var address = system.args[1] || 'http://127.0.0.1:8000/map.html';
var output = system.args[2] || 'map.png';
var maxWaitMs = 30000;
var pollMs = 100;
var elapsed = 0;

page.viewportSize = { width: 1280, height: 800 };

page.onError = function (message, trace) {
  console.log('Page error: ' + message);
  trace.forEach(function (frame) {
    console.log('  ' + frame.file + ':' + frame.line);
  });
};

page.open(address, function (status) {
  if (status !== 'success') {
    console.log('Could not load page: ' + address);
    phantom.exit(1);
    return;
  }

  var timer = setInterval(function () {
    elapsed += pollMs;
    page.evaluate(function () {
      return window.mapReady === true;
    }).then(function (ready) {
      if (ready) {
        clearInterval(timer);
        page.render(output);
        console.log('Wrote ' + output);
        phantom.exit(0);
      } else if (elapsed >= maxWaitMs) {
        clearInterval(timer);
        console.log('Timed out waiting for window.mapReady');
        phantom.exit(2);
      }
    });
  }, pollMs);
});
PhantomJS 1.9’s page.evaluate is synchronous, so use the following polling callback form if your build does not support a Promise return from page.evaluate:
var timer = setInterval(function () {
  elapsed += pollMs;
  var ready = page.evaluate(function () {
    return window.mapReady === true;
  });
  if (ready) {
    clearInterval(timer);
    page.render(output);
    console.log('Wrote ' + output);
    phantom.exit(0);
  } else if (elapsed >= maxWaitMs) {
    clearInterval(timer);
    console.log('Timed out waiting for window.mapReady');
    phantom.exit(2);
  }
}, pollMs);
Use that callback form as the PhantomJS 1.9-compatible implementation. The complete script can use the same setup above, replacing the polling block with this synchronous poll. Run it with:
phantomjs capture.js http://127.0.0.1:8000/map.html map.pngPhantomJS documents viewportSize for page dimensions and clipRect for a specific crop. Set the viewport to the map’s CSS dimensions to avoid capturing a differently sized layout. To crop a region, add this before page.render(output):
page.clipRect = { top: 0, left: 0, width: 1280, height: 800 };The capture target is the rendered browser page, so map controls, labels, and HTML markers appear if they are visible in the selected area. For a clean map-only file, omit controls from the page or hide them with page CSS before setting the readiness flag.
4. Configure Leaflet for a Canvas exporter when needed
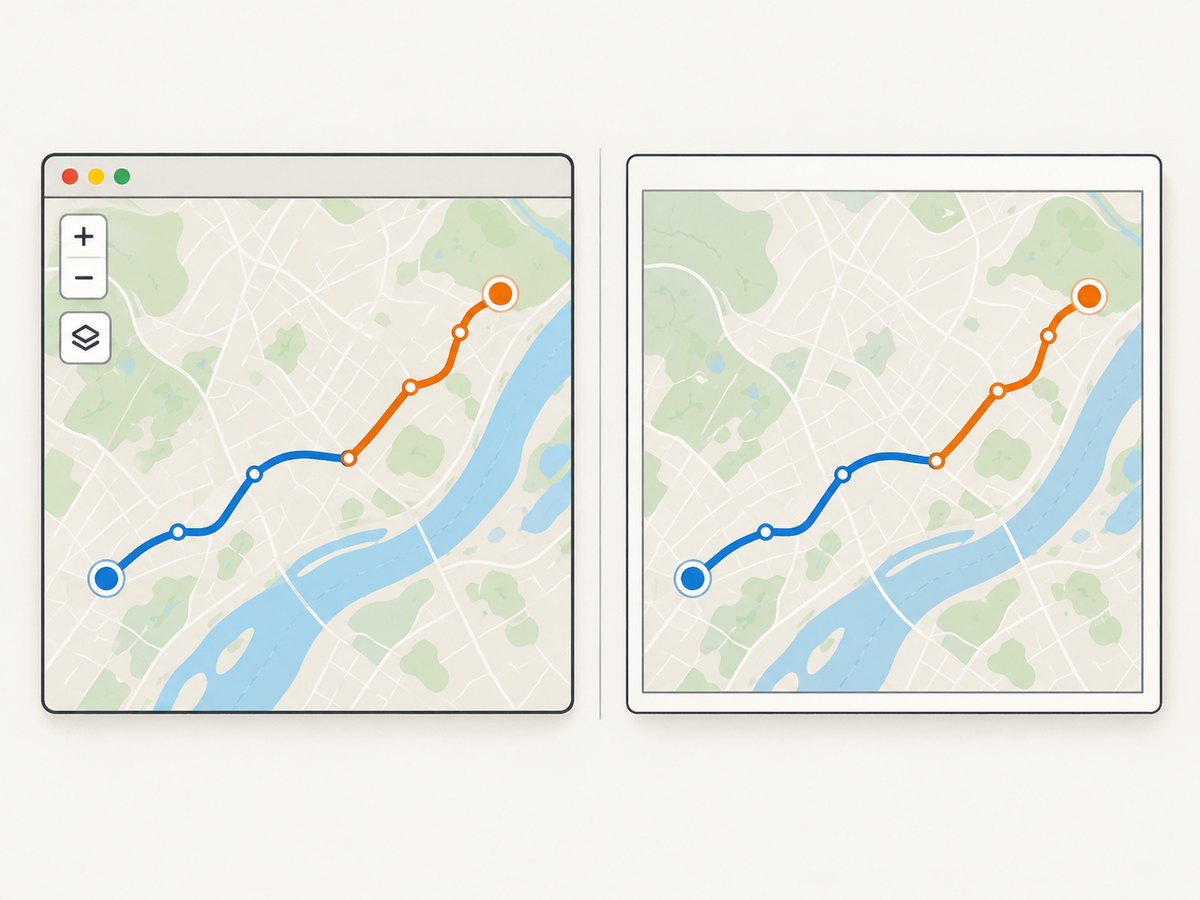
If you use leaflet-image instead of page.render(), configure the vector rendering backend for that export route. To make Canvas the map default:
var map = L.map('map', { preferCanvas: true }).setView([51.505, -0.09], 13);
L.polyline(coords, { color: '#1769aa', weight: 5 }).addTo(map);
Or select Canvas for only the layer that needs it:
var canvasRenderer = L.canvas();
var line = L.polyline(coords, {
  color: '#1769aa',
  weight: 5,
  renderer: canvasRenderer
}).addTo(map);
Use per-layer renderers when you need to mix rendering approaches. Make sure every path required in the Canvas export uses a Canvas renderer; changing one path does not necessarily change other layers. Leaflet’s FAQ says Canvas can help with heavy vector data, depending on the app and data, but it is not a universal speed guarantee.
Canvas export also has limits unrelated to path rendering. The leaflet-image README requires CORS-compatible tile and marker images. It does not rasterize HTML features such as L.divIcon, built-in zoom controls, or legends. If those must be in the PNG, use a page screenshot or draw equivalent content into the export yourself.
5. Size, frame, and map state
- Viewport: Set
page.viewportSizebefore opening the page. Keep the map container’s CSS width and height consistent with the intended output. - Crop: Set
page.clipRectwhen only part of the page should be rendered. Check the crop origin and dimensions against the viewport. - Map position: Call
setView,fitBounds, or equivalent before reporting readiness so the captured frame is deterministic. - Layout changes: If the map container is resized after initialization, call
map.invalidateSize()after the new dimensions are applied, then wait for rendering to settle. - High density: PhantomJS 1.9 capture dimensions follow the configured page viewport and crop. If a larger raster is needed, render a larger viewport or use another capture workflow designed for that output.
- Attribution: Keep required tile attribution visible and comply with the tile provider’s terms. Leaflet’s quick start specifically notes attribution is obligatory when using OpenStreetMap tiles.
6. Troubleshoot missing paths and incomplete maps
| Symptom | Likely cause | Fix |
|---|---|---|
| SVG paths are missing | The paths were not added before capture, the map has not rendered, or the selected Canvas exporter cannot see SVG output. | Confirm layer creation and timing. For direct PhantomJS capture, wait for page readiness and retain SVG. For Canvas export, use preferCanvas or a per-layer L.canvas() renderer. |
| Basemap is blank or partial | Tile requests failed, are still pending, or are blocked by the network or provider. | Inspect page errors and tile requests; wait for the tile layer’s load event and confirm the tile URL is valid and reachable. |
| Canvas export fails or omits imagery | Tile or marker images are not CORS-compatible. | Use a source that permits the required cross-origin access and follow its usage terms. A browser page screenshot and a Canvas export have different cross-origin behavior. |
Controls, legends, or L.divIcon markers are absent |
leaflet-image exports Canvas content and does not rasterize those HTML elements. |
Capture the page with PhantomJS or implement those items as rasterizable map content. |
| Wrong output dimensions | The page viewport, map element, and clip rectangle do not agree. | Set viewportSize before opening; match the map container CSS size; inspect clipRect coordinates. |
| Map is shifted or tiles have gaps | The map was resized or captured before Leaflet recalculated its layout. | Apply final CSS dimensions, call map.invalidateSize() if necessary, and only then signal readiness. |
| Capture waits forever | The page never sets its readiness flag, often because an expected event did not fire. | Log tile errors, handle empty/no-tile cases, and enforce a timeout that exits with a failure code. |
| Paths look slow to render | Many or complex geometries can increase rendering work. | Try Canvas for heavy vector data and profile with representative geometry. Leaflet notes the benefit depends on the app and data. |
7. Performance, reliability, and cost
There are no benchmark figures in the referenced documentation that establish a universal capture time or vector-count limit. Measure the actual page with the geometry, zoom, tile provider, and viewport you intend to use. Canvas may help with heavy vector data, but evaluate the resulting visual output and exporter compatibility too.
For reliable batch or scheduled captures, make readiness explicit, use a bounded timeout, return a nonzero exit status on load or readiness failures, and log page errors. Avoid treating a fixed one-second delay as proof that tiles and overlays finished. If the page can fail because of network conditions, distinguish a failed capture from a valid image before consuming it downstream.
PhantomJS is the direct route when you need the page as rendered, including SVG and visible HTML. A Canvas exporter can be a narrower route with CORS and HTML-content constraints. Tile costs, limits, and attribution are determined by the tile provider and are separate from the PNG capture call; consult that provider’s current terms rather than assuming public tiles are suitable for automated production capture.
Or skip the browser setup
ScreenshotNeo takes a screenshot with one GET request and supports PNG, JPEG, WebP, and PDF. It removes cookie banners, popups, and chat widgets before the shot. Bot checks, blank pages, and failed loads are never billed. Its MCP server lets AI agents take screenshots, and 1,000 screenshots a month are free with no card; paid plans start at $5 for 3,000.
For example, capture a map page served from your app:
curl -G "https://api.screenshotneo.com/v1/shot" \
  -d access_key=YOUR_API_KEY \
  --data-urlencode url=https://example.com/map \
  -o map.webp
For other options, including viewport and full-page capture, see the ScreenshotNeo API documentation. The API captures a web page; keep the map readiness and attribution considerations above in mind for dynamic maps.
Create a free ScreenshotNeo account for 1,000 screenshots a month, with no card required.
Frequently asked questions
Do I have to convert Leaflet SVG paths to Canvas for PhantomJS?
No. PhantomJS renders the page through WebKit and can capture SVG. Canvas configuration is for Canvas-based export workflows or a deliberate rendering choice.
Does an SVG overlay behave exactly like a polyline?
No. A polyline is a Leaflet path layer; L.SVGOverlay binds an SVG element to geographic bounds. Both can appear in a page screenshot when present and rendered, but they are configured through different Leaflet APIs.
Can I save a cropped map instead of the whole page?
Yes. Set page.clipRect to the capture region and make sure its dimensions fit the page viewport.
Will a PNG preserve vector editability?
No. PNG is a raster image. The screenshot records the rendered appearance, not editable SVG geometry.


