How to Capture Network Requests and Full Response Data in Chrome
Learn how to record Chrome network traffic, inspect full response bodies, preserve requests across reloads, copy individual responses, and export a safe HAR.
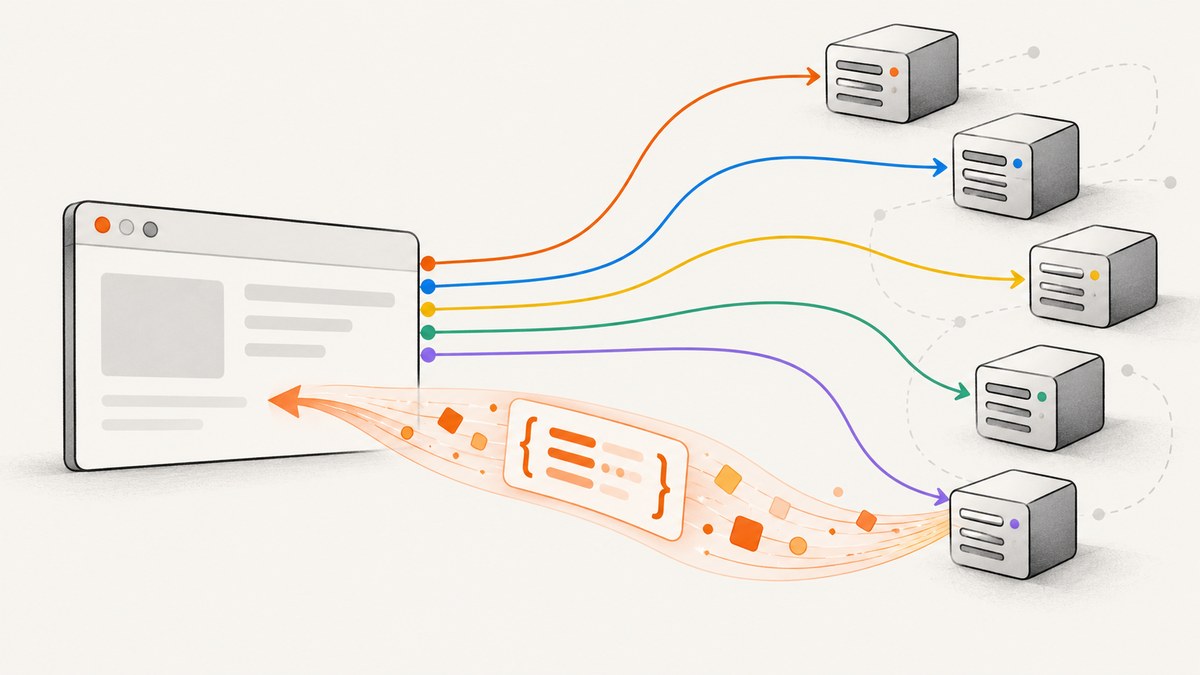
To capture network requests and full response data in Chrome, open DevTools before reproducing the problem, use the Network panel to record traffic, select a request to inspect its Headers, Payload, Response, and Preview tabs, then copy the response or export the session as a HAR file. Enable Preserve log before a reload or navigation if you need entries to survive page changes.
This workflow is built into Chrome DevTools. It gives you a live request log for debugging, a way to inspect one response body in detail, and export options for sharing a broader session. A HAR is useful for a session record, but it should not be treated as a guarantee that every response body is included. When you need one exact body, copy that response directly.
1. Start a clean Network capture
- Open the page where the issue occurs.
- Open Chrome DevTools with
Ctrl+Shift+Ion Windows/Linux orCmd+Option+Ion macOS. - Select the Network panel.
- Make sure recording is active. The record control should be enabled.
- Clear the existing request list if you want a focused capture.
- Turn on Preserve log if the flow includes a reload, redirect, or navigation.
- Reproduce the action, then reload and reproduce it again if DevTools was opened after the page had already loaded.
Chrome records requests while DevTools is open. Requests made before DevTools opened may be absent, so opening the panel late and then repeating the flow is essential. The official Network reference documents recording, Preserve log, request inspection, copying, and HAR export: Network features reference. The overview also describes automatic recording and request detail tabs: Analyze network load and resources.
Preserve requests across reloads
Without Preserve log, a navigation normally clears the request list. Enable it before starting a login flow, redirect chain, checkout, or any reproduction that changes pages. Preserve log keeps the entries visible across those loads; it does not recover requests that happened before recording began.
For a cache-sensitive issue, open DevTools settings and enable Disable cache while DevTools is open. This can reveal whether a response is being served locally, but it changes loading behavior, so record whether it was enabled when you share the capture.
2. Find the request that matters
The Requests table shows details such as name, status, type, initiator, size, timing, and the waterfall. Use the filter box and resource-type filters to narrow the list. Do not assume the request must be labeled XHR or fetch: pages also make document, script, stylesheet, image, font, WebSocket, and other requests.
Useful filtering approaches include:
- Search for part of the endpoint path, filename, or query string.
- Filter by status when looking for failures such as 4xx or 5xx responses.
- Filter by type when you know the resource class, then verify the actual request.
- Use the initiator and timing columns to connect a request to the user action that triggered it.
Select a row to open its detail pane. If the request list is noisy, clear it and perform only the action you want to document. A focused capture makes both debugging and review faster.
3. See the full response body in DevTools
After selecting a request, open the Response tab to view the returned body. Use Preview when Chrome’s rendered representation makes JSON, images, or other structured data easier to interpret. The tabs answer different questions:
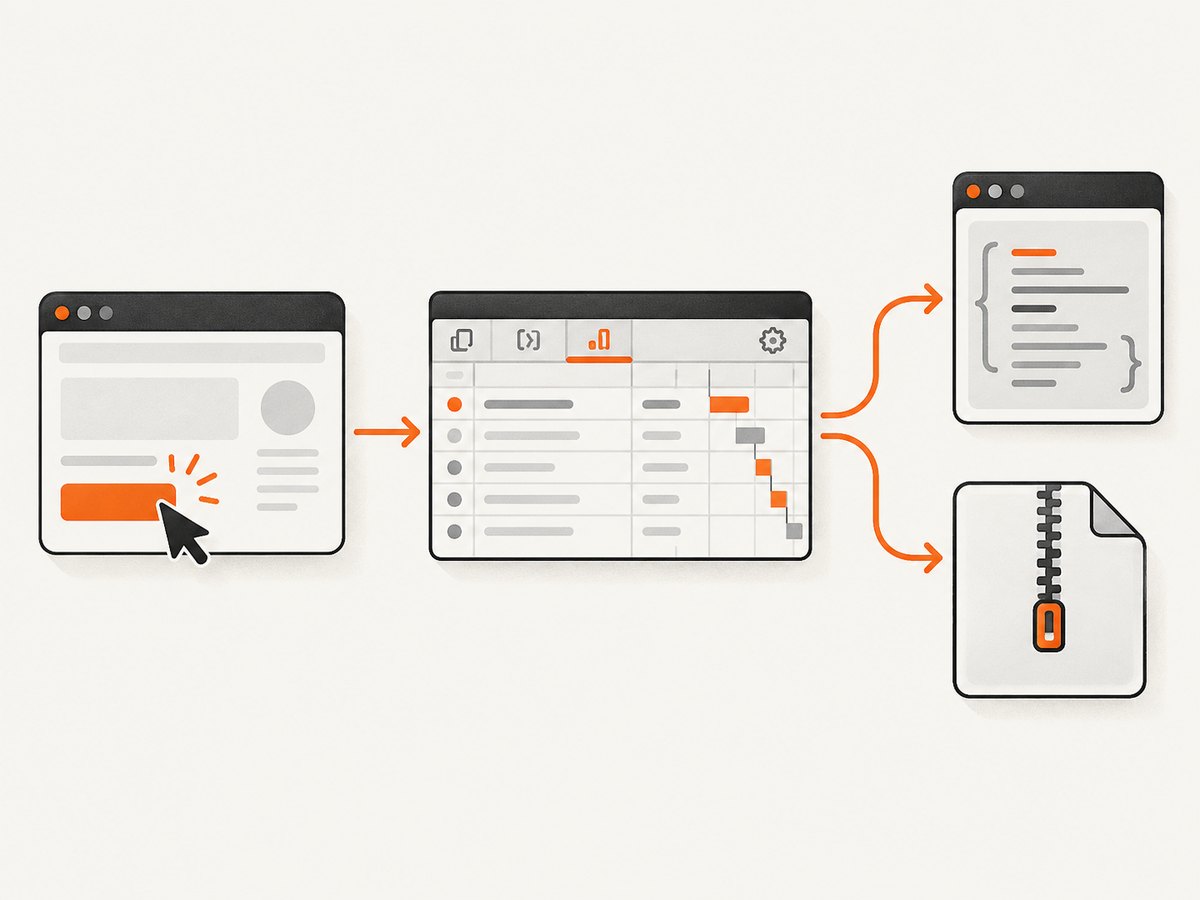
| Tab | What it shows | Typical use |
|---|---|---|
| Headers | Status, URL, request headers, response headers, and general metadata | Check authentication, caching, content type, redirects, and server status |
| Payload | Query parameters, form data, and submitted request content | Verify exactly what the browser sent |
| Preview | A rendered interpretation of the response | Quickly inspect structured or visual content |
| Response | The returned response body | Read or copy the exact body for debugging |
Headers and Payload can also provide a source view for raw forms of those sections. If Chrome shows provisional headers, the documented causes include a locally cached resource, an invalid resource, or security restrictions. Disable cache while DevTools is open when the cache explanation applies, then repeat the request. This does not guarantee that every header will become available.
Copy one response body
- Right-click the request in the Network table.
- Open the Copy submenu.
- Choose Copy response.
- Paste into a text editor or issue tracker and preserve the content type and status code alongside it.
For reproducing the request elsewhere, the same menu includes options such as Copy as cURL and Copy as fetch. Treat copied commands as sensitive: they can include cookies, authorization headers, request bodies, and private URLs.
4. Save a HAR file in Chrome
A HAR (HTTP Archive) records a broader Network-panel session. It is the right choice when someone needs to see the request sequence, timings, headers, and page activity rather than one isolated body.
- Capture the complete flow with DevTools open.
- Keep only the relevant requests, or apply a filter if you want a smaller export.
- Right-click in the request table or use the Network panel export control.
- Choose Save all [listed] as HAR (sanitized), or the equivalent HAR export action in your Chrome version.
- Save the file, then inspect it before sending it to anyone.
Chrome also supports importing a HAR by dragging it into the Network panel or using the import control. A sanitized HAR omits sensitive headers such as Cookie, Set-Cookie, and Authorization. Chrome documents a separate preference at Settings > Preferences > Network > Allow to generate HAR with sensitive data. Enable that only when the recipient genuinely needs those values, and remove or rotate credentials afterward. See the official DevTools Preferences documentation.
HAR safety checklist
- Prefer the sanitized export for routine support requests.
- Open the HAR as text or inspect it with a trusted viewer before sharing.
- Look for cookies, authorization tokens, API keys, passwords in query strings, private hostnames, personal data, and request or response bodies.
- Redact sensitive values and confirm that redaction did not break the evidence.
- If credentials were captured, revoke or rotate them after the investigation.
Even a sanitized HAR can contain sensitive URLs, payloads, page content, and response data. Sanitization is not a substitute for reviewing the complete file.
5. Keep full response content for repeated analysis
If you need several bodies, copy each relevant response while the capture is open and store it with the request URL, method, status, timestamp, and content type. This is often clearer than asking a teammate to infer body content from a HAR. For large or binary responses, record the response size and use an appropriate file or artifact store instead of pasting bytes into a ticket.
When debugging an intermittent failure, repeat the exact sequence several times and preserve the log across navigations. Compare status, timing, response headers, and body differences. Keep the browser version, operating system, account state, cache setting, and whether an extension or service worker was active in your notes.
6. Programmatic access for DevTools extensions
Chrome DevTools extensions can use the chrome.devtools.network API. Request information is exposed in HAR form, and the API provides getContent() to retrieve response content when it is needed. The API documentation notes that request content is omitted for efficiency until retrieved and that requests can be missing if DevTools opened after page load. Reload the page after opening DevTools to populate the complete set.
chrome.devtools.network.onRequestFinished.addListener(request => {
  request.getContent((content, encoding) => {
    console.log({
      url: request.request.url,
      status: request.response.status,
      mimeType: request.response.content.mimeType,
      encoding,
      content
    });
  });
});
This route requires an extension with the appropriate DevTools permissions and is separate from ordinary manual capture. Read the primary API reference before building around its data model: chrome.devtools.network.
7. Choose the right capture method
| Need | Use | Limitation |
|---|---|---|
| Inspect one body | Select a request, then Response | Only the selected response is shown |
| Copy one body | Request menu > Copy response | Review copied content before sharing |
| Save a session | Export a sanitized HAR | A HAR is broader than one body and should not be assumed to contain every response body |
| Keep entries through reloads | Enable Preserve log | It cannot capture requests made before DevTools opened |
| Retrieve bodies in extension code | getContent() on API request objects |
Requires a DevTools extension |
8. Troubleshooting common capture problems
The request is missing
Cause: DevTools opened after the request, the list was cleared, or navigation removed entries. Fix: open Network first, enable Preserve log, reload, and reproduce the action.
The list is cleared after navigation
Cause: Preserve log is disabled. Fix: enable Preserve log before starting the flow.
The Response tab is empty
Cause: the request failed before a body was returned, the body is unavailable for that resource, or the response is streamed or otherwise handled specially. Fix: check status and timing in Headers, inspect the console for related errors, and repeat with the request selected from the beginning.
Only provisional headers appear
Cause: Chrome may be showing a cached, invalid, or security-restricted resource. Fix: repeat with Disable cache enabled while DevTools is open and compare the result.
The HAR contains secrets
Cause: sensitive export was enabled, or secrets were present in URLs, payloads, or bodies. Fix: use sanitized export, inspect the file, redact values, and rotate exposed credentials.
The capture is too large
Cause: long sessions, large media, or unfiltered resource traffic. Fix: clear the list, reproduce only the needed flow, filter before exporting, and copy only the relevant response bodies.
9. Performance, reliability, and cost considerations
DevTools capture adds an observation layer, so compare behavior with and without DevTools when investigating timing-sensitive issues. Disable cache changes request behavior and can increase transfer time. Preserve log improves diagnostic continuity but allows the table to grow during long sessions; clear it between unrelated reproductions.
For reliable evidence, capture from a clean tab, record the exact reproduction steps, repeat intermittent failures, and note whether extensions, service workers, VPNs, or proxies were involved. Chrome DevTools itself has no capture fee. The main costs are storage, review time, and the security risk of sharing data that should have been redacted.
Or skip the browser setup
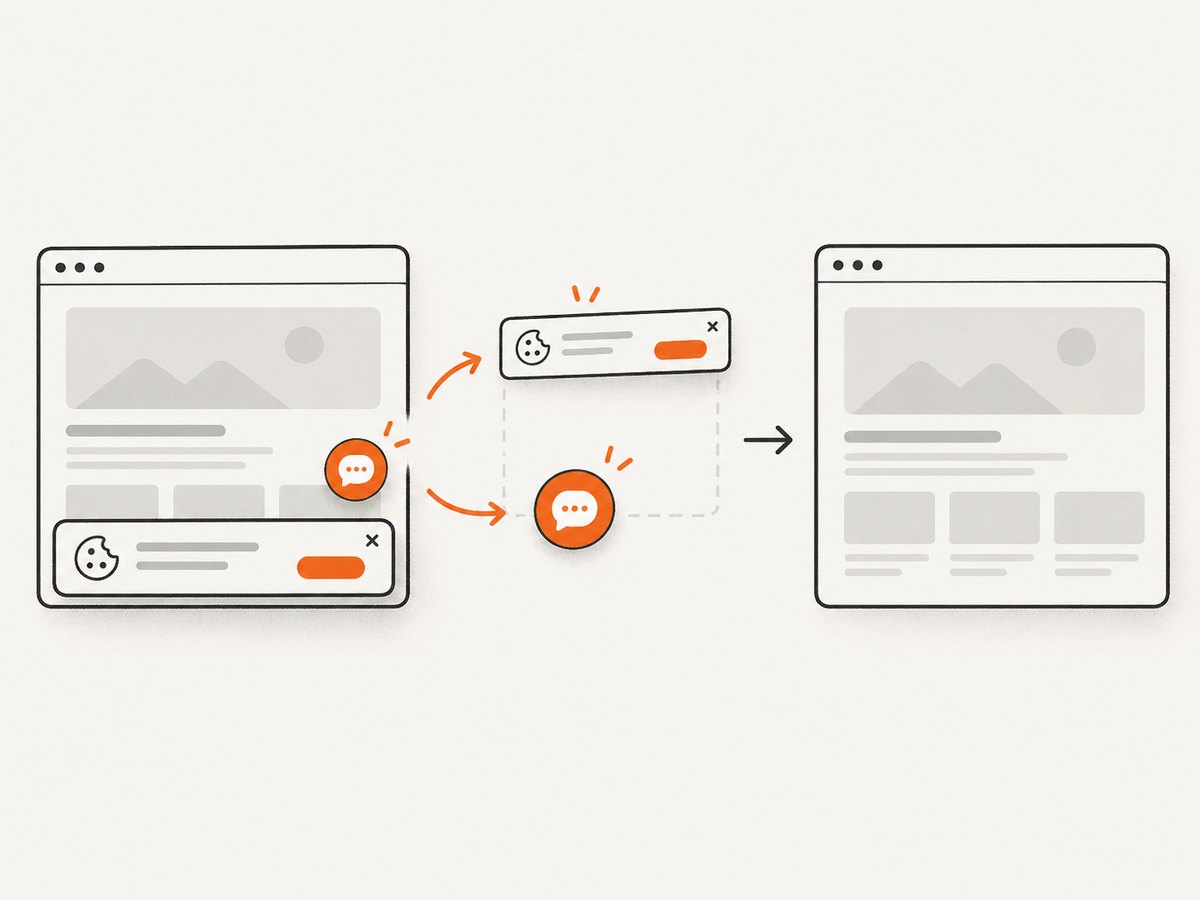
If your actual goal is a repeatable screenshot of a page after diagnosing its requests, ScreenshotNeo provides a single HTTP request for PNG, JPEG, WebP, or PDF output. Its capture process accepts cookie and consent banners before removing more than 60 known consent platforms, newsletter popups, and chat widgets; each step can be turned off. Bot checks, blank pages, timeouts, failed loads, and cache hits are not billed, and the response reports the result through X-Page-Verdict and X-Billed headers. See the ScreenshotNeo API documentation.
curl -G "https://api.screenshotneo.com/v1/shot" -d access_key=YOUR_API_KEY --data-urlencode url=https://stripe.com -o shot.webpimport requests
r = requests.get("https://api.screenshotneo.com/v1/shot", params={"access_key": "YOUR_API_KEY", "url": "https://stripe.com"}, timeout=90)
open("shot.webp", "wb").write(r.content)const q = new URLSearchParams({ access_key: 'YOUR_API_KEY', url: 'https://stripe.com' });
const res = await fetch(`https://api.screenshotneo.com/v1/shot?${q}`);ScreenshotNeo also includes an MCP server with take_screenshot, get_page_info, and capture_pdf tools for Claude, Cursor, and other MCP clients. Options include full-page capture with lazy images loaded, CSS-selector element capture, dark mode, device presets or custom viewports, retina scale, PDF paper settings, custom CSS and JavaScript, clicks, selector or network-idle waits, request blocking, custom headers and cookies, timezone and geolocation, transparent backgrounds, resizing, caching with a chosen TTL, signed links, asynchronous jobs with signed webhooks, bulk capture for up to 100 URLs per call, usage data, and an OpenAPI specification.
The Free plan includes 1,000 screenshots per month with no card. Paid plans start at $5 for 3,000 screenshots; yearly billing provides two months free. Create a free ScreenshotNeo account to try it.
FAQ
How do I keep network requests when I reload the page?
Open Network, enable Preserve log, then reload and reproduce the flow. Requests made before DevTools opened still require another reload or reproduction.
Does exporting a HAR include every response body?
Do not assume that it does. Use Copy response for a specific body, or retrieve content with getContent() in a DevTools extension.
Should I export a sensitive HAR?
Use a sanitized HAR by default. Only enable sensitive-data export for a justified case, inspect the file, redact what you can, and rotate any credentials that were exposed.
Can I copy the request as code?
Yes. The request context menu includes Copy as cURL and Copy as fetch. Review copied headers, cookies, URLs, and bodies before sharing or running them.


