How to Capture Screenshots from BrowserStack
Capture browser and app screenshots with BrowserStack using automatic logs, test code, its Screenshots API, or responsive tools. Choose the method that fits your workflow.
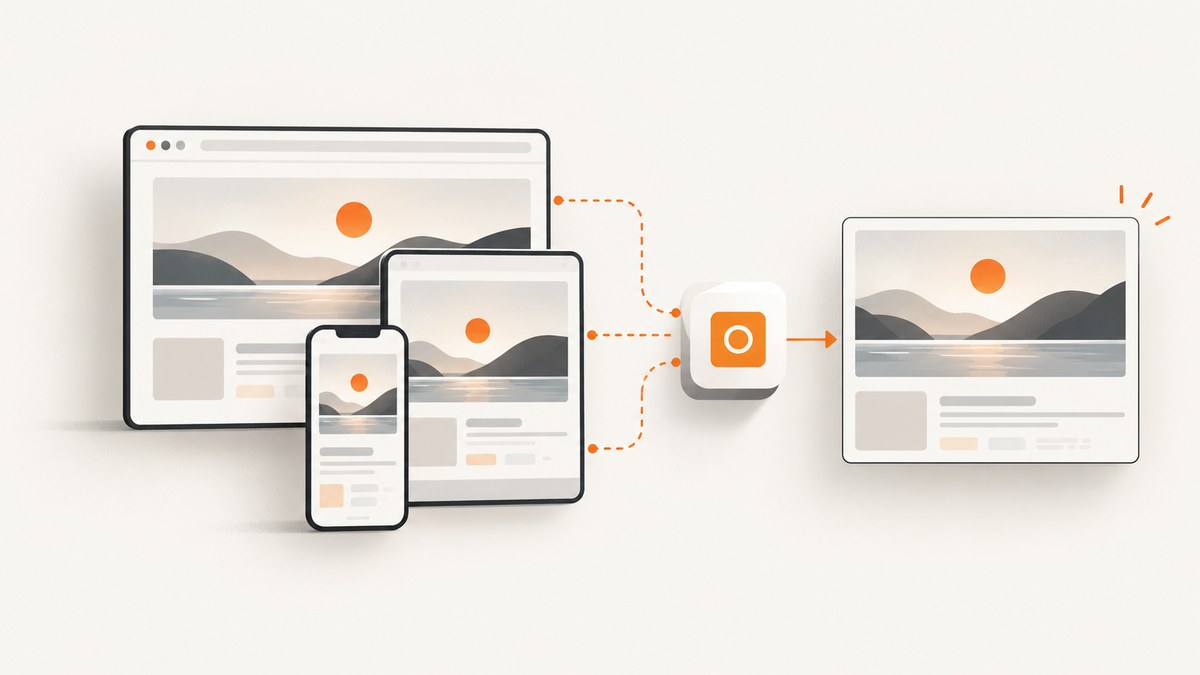
BrowserStack has several screenshot workflows, and the right one depends on what you are testing and where the image needs to go. For automatic evidence while Selenium or Playwright commands run, enable Visual Logs. To save a specific moment as a file, call the screenshot method in your test script. For URL-based captures across selected browsers and operating systems, use the Screenshots API. Appium and Espresso tests have app-specific screenshot routes; Responsive Testing can capture one or all configured viewports.
This guide covers each option, where the screenshots end up, runnable examples, common failure causes, and how to choose a workflow. BrowserStack product behavior and plan availability can change, so check the linked documentation when configuring a current account.
1. Pick the right BrowserStack screenshot method
| Need | Method | Trigger and destination |
|---|---|---|
| See the page during Selenium commands | Automate Visual Logs | Automatic; view in the Automate dashboard. |
| Save a chosen Selenium test moment as a file | Explicit Selenium screenshot | Test code; saved on the test runner unless you upload it elsewhere. |
| Save a chosen Playwright moment | page.screenshot() |
Test code; writes to the path you specify. |
| See screenshots at Playwright commands | Automate Visual Logs | Automatic when browserstack.debug is enabled. |
| Capture a URL in selected OS and browsers | Screenshots API | Authenticated API job; availability depends on plan. |
| Capture an app screen in an automated test | App Automate screenshot support | Appium or Espresso test flow; inspect the session or save from the runner. |
| Compare responsive layouts | Responsive Testing | Camera control captures one configured device or all of them. |
| Attach one annotated viewport to an issue | Bug Capture | Manual capture; current FAQ describes viewport-only and no multiple screenshots. |
Visual Logs are useful for diagnosis, but they are not the same as an image artifact on your machine. If a downstream CI step needs a PNG file, take an explicit screenshot and preserve it as a build artifact.
2. Capture screenshots in Selenium Automate
Enable automatic Visual Logs
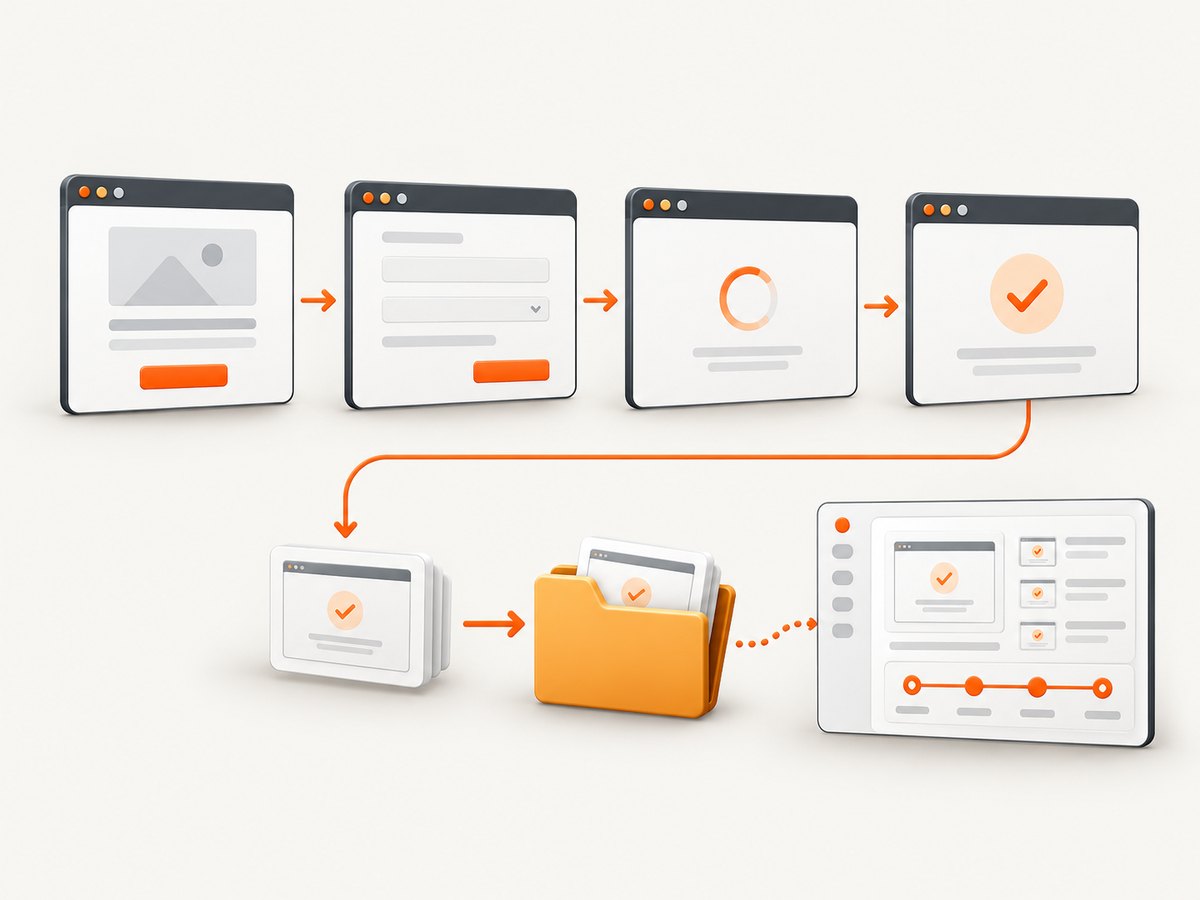
Visual Logs are disabled by default. Enable the BrowserStack debug capability (or the equivalent BrowserStack SDK setting) to capture screenshots around Selenium commands. They are intended for inspecting test progress in the Automate dashboard; use explicit capture when your test must write an image locally. See BrowserStack’s Selenium screenshot documentation.
// Capability fragment: merge this into your existing BrowserStack capabilities.
const capabilities = {
  browserName: 'Chrome',
  browserstack: {
    debug: true
  }
};
Capability formats can vary with the client and configuration style. Preserve your existing BrowserStack username, access key, OS, browser, and other capabilities; add the debug setting using the format supported by your test setup.
Take an explicit screenshot with Selenium and Node.js
This example uses Selenium’s JavaScript binding and saves the returned image bytes on the machine running the test. It assumes you already created a driver session, locally or remotely on BrowserStack.
const fs = require('node:fs/promises');

// After navigating and waiting for the state you want to capture:
const png = await driver.takeScreenshot();
await fs.writeFile('artifacts/checkout.png', Buffer.from(png, 'base64'));
Create the output directory before writing if it may not exist. In CI, upload or copy the file to durable artifact storage before an ephemeral runner is shut down. BrowserStack documents examples for several language bindings; use the screenshot call supported by your binding.
3. Capture a chosen moment in Playwright
Call page.screenshot() after the page reaches the state you want. BrowserStack’s example uses await page.screenshot({ path: '<image-name.png>' }). For automatic screenshots at Playwright commands, set browserstack.debug: true; Visual Logs are disabled by default. See BrowserStack’s Playwright debugging guide.
const { chromium } = require('playwright');

(async () => {
  const browser = await chromium.connectOverCDP(process.env.BROWSERSTACK_PLAYWRIGHT_WS);
  const context = await browser.newContext();
  const page = await context.newPage();

  await page.goto('https://example.com', { waitUntil: 'domcontentloaded' });
  await page.screenshot({ path: 'artifacts/home.png', fullPage: true });

  await browser.close();
})();
The connection URL and authentication are specific to your BrowserStack Playwright setup; provide the documented remote endpoint as an environment variable and do not hard-code or print credentials. The screenshot call itself is ordinary Playwright. Omit fullPage when you only need the current viewport. A full-page image can be very tall and may be harder to review or store.
4. Use the BrowserStack Screenshots API for URL captures
Choose the Screenshots API when the input is a URL and you want jobs across selected browser and OS configurations without writing a browser test for each capture. The API starts and stops screenshot generation and lets you select configurations. BrowserStack says API access is available on Automate plans that include browsers, and not on Live-only subscriptions. API requests require your BrowserStack username and access key. See the Screenshots API documentation for the current request schema and response flow.
Keep credentials in environment variables or a secret manager. The exact endpoint fields and job lifecycle should follow the current API specification; this minimal cURL pattern illustrates authenticated HTTP without guessing request parameters:
# Set these in your shell or CI secret configuration first.
export BROWSERSTACK_USERNAME='your-username'
export BROWSERSTACK_ACCESS_KEY='your-access-key'

# Consult the Screenshots API documentation for its current endpoint,
# payload fields, and start/stop job sequence.
curl --user "$BROWSERSTACK_USERNAME:$BROWSERSTACK_ACCESS_KEY" \
  -H 'Content-Type: application/json' \
  --data @screenshot-request.json \
  'https://www.browserstack.com/screenshots/api'
The documentation page describes the product and request flow; use its current API endpoint and payload in place of the illustrative URL above before running a request. This avoids relying on a stale schema or treating a documentation URL as an API endpoint. After the job completes, retrieve the generated image links from the response or dashboard workflow documented for your account.
5. Take screenshots in Appium or Espresso tests
Appium
Call the Appium driver screenshot function at the point of interest and save the image on the machine running your automated tests. The test runner may be ephemeral, so transfer the file before shutdown. BrowserStack notes that platform security settings can prevent capture; Android FLAG_SECURE is one example. Review the Appium screenshot guide for language-specific examples and platform behavior.
// JavaScript Appium client example, with an existing driver session.
const fs = require('node:fs/promises');

const base64Image = await driver.takeScreenshot();
await fs.writeFile('artifacts/app-screen.png', Buffer.from(base64Image, 'base64'));
Use a unique path or filename per test and session to prevent parallel workers from overwriting each other’s images.
Espresso
BrowserStack documents native screenshot capture and a Spoon library route. Its native feature supports all Android versions; Spoon is supported through Android 10 according to the documentation. For the documented session capture route, enable debugscreenshots in the Espresso build request and inspect the session’s Screenshots tab. Native captures need a valid screenshot name; spaces or invalid characters may keep the image from appearing. Follow the Espresso screenshot documentation for the current build request syntax.
6. Capture one or many viewport sizes in Responsive Testing
- Open the page in BrowserStack and open Testing Toolkit.
- Select Responsive Testing.
- Add predefined device resolutions or enter a custom configuration.
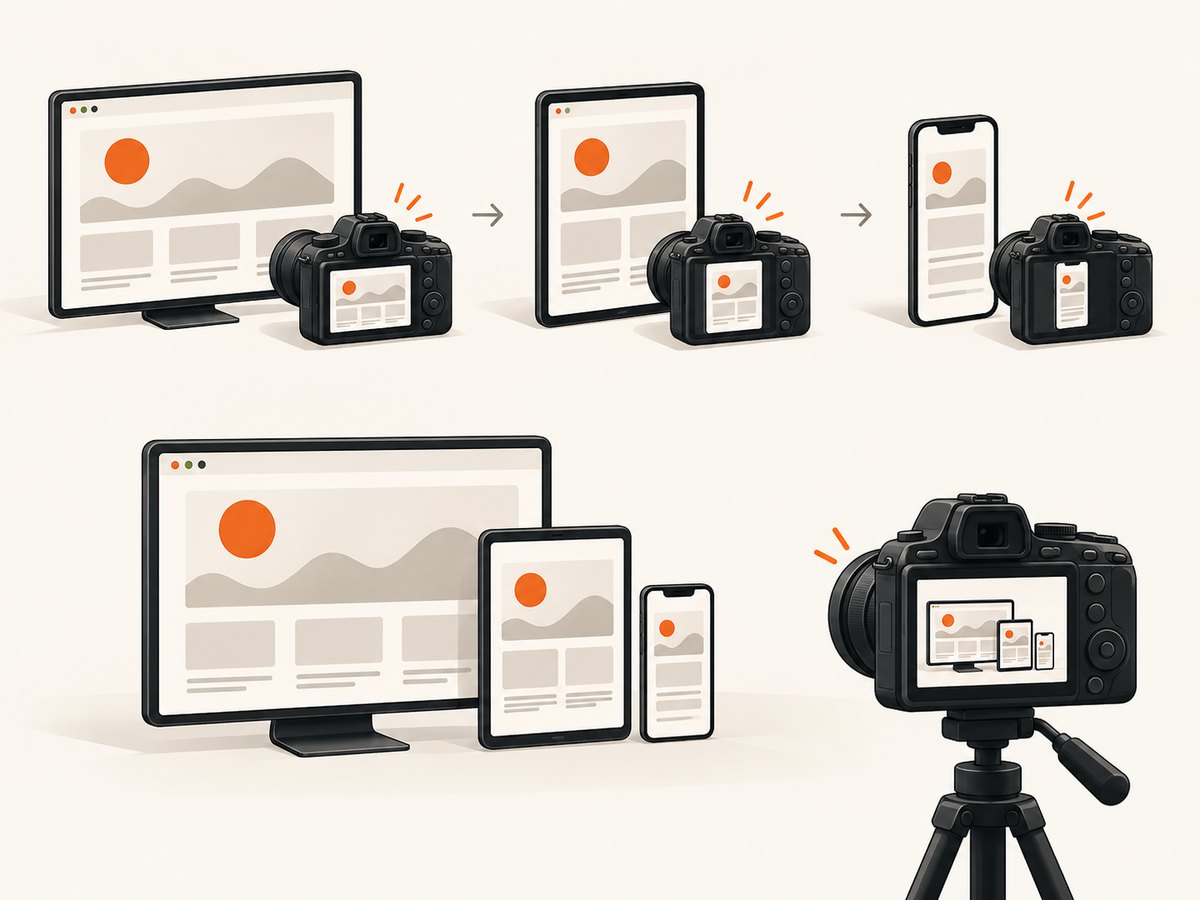
- Use the camera control beside a device to capture that viewport, or the top-bar camera control to capture all configured devices.
This is suited to visual checks across viewport sizes without wiring a test script for every resolution. See BrowserStack’s Responsive Testing guide for the current interface.
7. Bug Capture: viewport image and annotations
BrowserStack’s current Bug Capture screenshot FAQ describes viewport-only screenshots and says multiple screenshots are not supported. Use annotations to point to a detail; if the issue depends on multiple moments, the FAQ suggests video. These limits apply to Bug Capture and should not be generalized to Automate, App Automate, or the Screenshots API. If technical logs are missing, check whether Replays are enabled and whether browser technical logs existed before capture. See the screenshot FAQ and Bug Capture FAQ.
8. Or skip the browser setup
If the task is simply to turn a URL into a clean image, ScreenshotNeo offers a one-request screenshot API and an MCP server for AI agents. The API accepts options for formats, viewport and device settings, full-page capture, element selection, waiting, cookies, headers, blocking resources, and more. See the ScreenshotNeo API documentation for request options.
curl -G "https://api.screenshotneo.com/v1/shot" \
  -d access_key=YOUR_API_KEY \
  --data-urlencode url=https://stripe.com \
  -o shot.webp
import requests
r = requests.get(
"https://api.screenshotneo.com/v1/shot",
params={"access_key": "YOUR_API_KEY", "url": "https://stripe.com"},
timeout=90,
)
open("shot.webp", "wb").write(r.content)const q = new URLSearchParams({ access_key: 'YOUR_API_KEY', url: 'https://stripe.com' });
const res = await fetch(`https://api.screenshotneo.com/v1/shot?${q}`);
if (!res.ok) throw new Error(`Screenshot request failed: ${res.status}`);
const bytes = Buffer.from(await res.arrayBuffer());
await import('node:fs/promises').then(fs => fs.writeFile('shot.webp', bytes));Cookie and consent banners, newsletter popups, and chat widgets are removed before the shot; each cleanup step can be turned off. Bot checks and CAPTCHAs, blank pages, timeouts, failed loads, and cache hits are not billed, and response headers report the page verdict and billing status. Its MCP server exposes take_screenshot, get_page_info, and capture_pdf to Claude, Cursor, and other MCP clients. The free plan includes 1,000 screenshots each month with no card; paid plans start at $5 for 3,000, and every feature is on every plan. Sign up for 1,000 free screenshots a month, no card required.
9. Troubleshooting common screenshot problems
| Symptom | Likely cause | Fix |
|---|---|---|
| No Visual Logs in Automate | Debug/Visual Logs are disabled by default. | Enable the documented debug capability or SDK setting, then start a new session. |
| Screenshot is not on the CI machine | Visual Logs live in the dashboard; explicit file capture was not used. | Call the test framework’s screenshot API and upload the resulting file as an artifact. |
| Artifact disappears after CI | The runner was ephemeral and stopped before transfer. | Copy or upload the image before teardown; use unique paths for parallel jobs. |
| Screenshot call fails for a protected app | Platform security may block screen capture, including Android FLAG_SECURE. |
Check app security configuration and platform restrictions; capture may not be permitted for that screen. |
| Espresso image is missing from dashboard | Debug screenshot capture may not be enabled, or the name contains spaces/invalid characters. | Enable debugscreenshots as documented and use a valid, simple name. |
| API request is rejected | Wrong credentials, unsupported plan, or stale request schema. | Check username/access key handling, confirm an Automate plan with browsers, and use the current API docs. |
| Screenshot captures the wrong state | Capture runs before navigation, rendering, or the required interaction is complete. | Wait for a specific selector or app condition before invoking the capture; avoid relying on a short arbitrary delay. |
| Screenshot file is corrupted or empty | Response/error text was saved as image bytes, or a write was interrupted. | Check the command result and file size before treating it as an image; preserve the original error response for diagnosis. |
10. Performance, reliability, and cost considerations
Automatic logs create evidence at many command points, which is convenient for debugging but can produce more images to inspect than a single targeted capture. Explicit screenshots keep capture timing under test control and make artifact handling predictable. For full-page browser shots, account for longer or taller pages and lazy content: wait until the relevant content has loaded, and choose the viewport or full-page mode deliberately.
For repeatable results, capture after a meaningful condition such as a visible selector, completed navigation, or known test step. Keep credentials out of source code and logs, make filenames unique in parallel CI runs, and transfer images before temporary workers disappear. BrowserStack’s API requires authentication and is plan-dependent; check eligibility before building a pipeline around it. The cited BrowserStack documentation provides no independently verified performance benchmark or cost comparison, so select capacity and spend from your plan and workload rather than an assumed capture rate.
11. Frequently asked questions
Can I take multiple screenshots in BrowserStack?
Yes in test-driven workflows: call the screenshot method at multiple points or configure multiple viewports. Bug Capture is a product-specific exception; its current FAQ says multiple screenshots are not supported there.
Can I capture an entire page?
Playwright supports a full-page screenshot option. Bug Capture’s screenshot FAQ describes viewport-only capture. Other workflows depend on the framework and tool, so check the corresponding documentation.
Where are BrowserStack screenshots saved?
Visual Logs and documented session screenshots are viewed in BrowserStack’s dashboard. An explicit test-script screenshot is saved where your code writes it, typically on the runner, and must be exported by CI if you need durable storage.
Can I use the Screenshots API with a Live-only subscription?
BrowserStack says the API is available on Automate plans that include browsers, not on Live-only subscriptions. Confirm current eligibility in the API documentation.
Can I capture a browser page and an app screen with the same method?
The underlying idea is similar, but the integration differs: use browser automation or the Screenshots API for web pages and Appium or Espresso support for app testing.


