How to Capture a Web Page Screenshot in Chrome DevTools
Capture viewport, full-page, element, area, loading, and performance screenshots in Chrome DevTools with exact steps and troubleshooting.
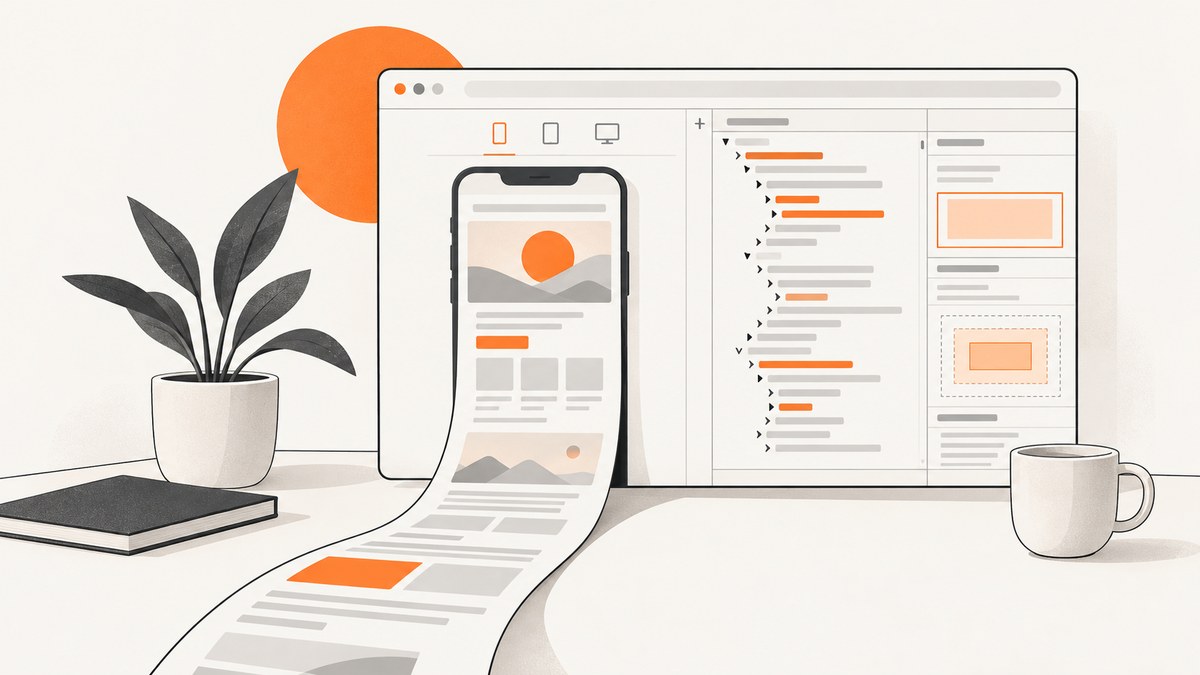
Chrome DevTools can save several different kinds of web page screenshots. Use Capture screenshot for the visible emulated viewport, Capture a full size screenshot for the entire page, Capture node screenshot for one DOM element, and Inspect Element Mode for a selected rectangle. DevTools can also capture a sequence of images while a page loads or while a Performance recording runs.
The correct workflow depends on the scope you need: viewport, whole page, element, area, or time-linked frames. This guide gives the exact menu paths, keyboard modifiers, practical fixes for common failures, and an automation option when you need repeatable captures.
Choose the screenshot method first
| Goal | DevTools workflow | Result |
|---|---|---|
| Save what is visible | Device mode → More options → Capture screenshot | The current emulated viewport |
| Save the whole page | Device mode → More options → Capture a full size screenshot | Content below the fold is included |
| Save one component | Elements → select node → Command Menu → Capture node screenshot | The selected DOM node |
| Save a rectangle | Inspect Element Mode → hold Command or Control while selecting | The selected viewport area |
| See images during loading | Network settings → Capture screenshots → reload | Thumbnails tied to loading activity |
| Pair images with performance data | Performance → Screenshots → record | A frame capture for each recorded frame |
Capture the visible viewport
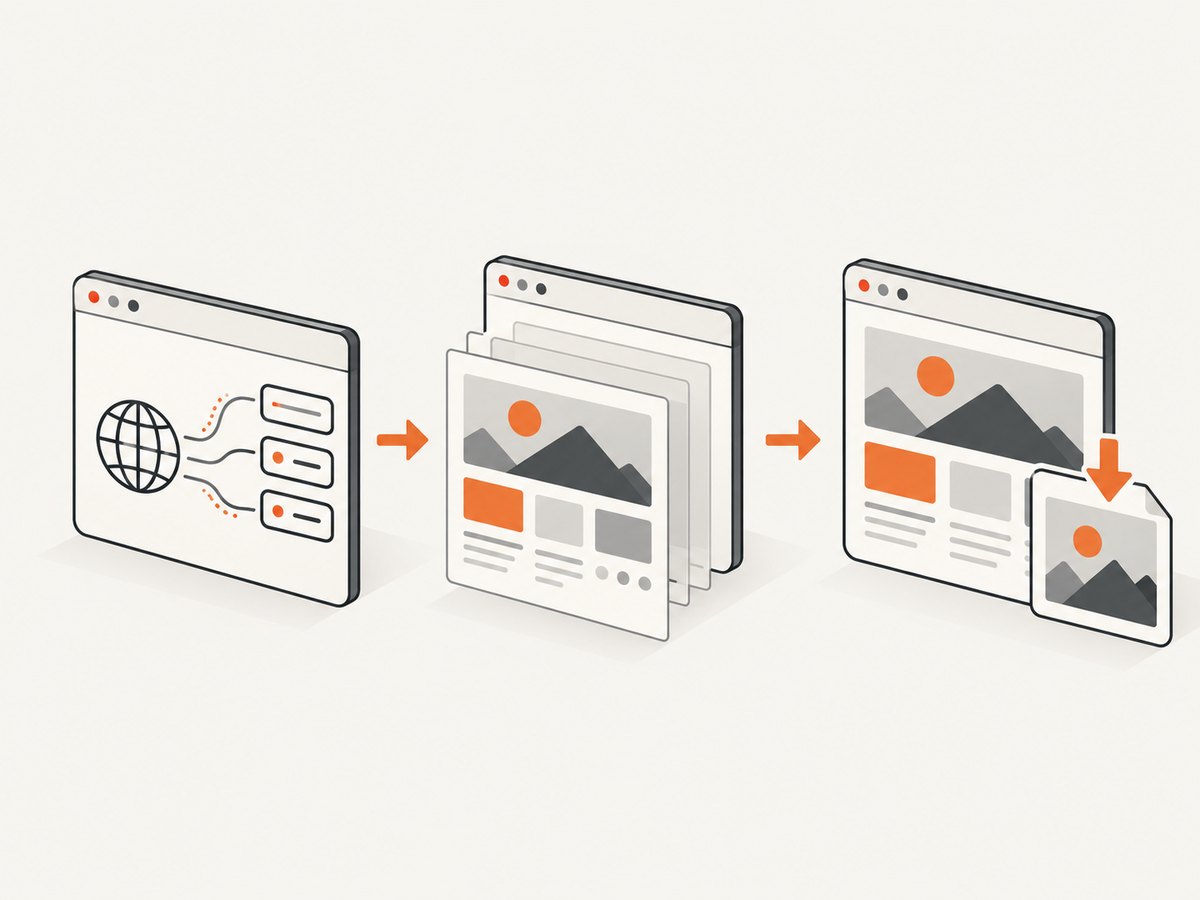
This saves the page exactly as it appears in the emulated viewport, including the selected device dimensions and zoom scale.
- Open the page in Chrome.
- Open DevTools with F12, Control+Shift+I on Windows/Linux, or Command+Option+I on macOS.
- Turn on Device mode by clicking the phone-and-tablet icon, or press Control+Shift+M (Windows/Linux) or Command+Shift+M (macOS).
- Choose a device preset or enter custom width and height.
- Open More options in the Device mode toolbar.
- Choose Capture screenshot.
Chrome downloads an image of the visible emulated viewport. Scroll position matters: content outside the viewport is not included.
Include a device frame
If you want a phone or tablet outline around the emulated page, enable Show device frame in the Device mode toolbar before choosing Capture screenshot. The frame must be visible before capture; enabling it afterward cannot add it to an already downloaded image.
Capture a full-page screenshot
For a complete page image, use Device mode’s full-size command:
- Enable Device mode.
- Set the viewport and device scale you want represented.
- Open More options.
- Choose Capture a full size screenshot.
This captures content outside the visible viewport, including sections below the fold. It is the normal DevTools solution for a long landing page, article, or documentation page. Chrome may need to render lazy content as it expands the page; if a section is still missing, scroll through the page once, wait for images to finish loading, and capture again.
Full-page capture checklist
- Wait for fonts, images, and client-side content to finish loading.
- Dismiss overlays that cover the page unless you intentionally need them.
- Check that lazy-loaded sections have been rendered by scrolling through the page.
- Confirm the emulated viewport width before capturing; responsive breakpoints change the layout.
- Use a normal page zoom when comparing captures over time.
Capture one HTML element
Use node capture for a card, header, chart, modal, or other specific DOM element. Chrome’s documented workflow starts in Elements and uses the Command Menu.
- Open DevTools and select the Elements panel.
- Click the element you want in the DOM tree. You can also use Inspect Element Mode to select it on the page.
- Open the Command Menu with Control+Shift+P (Windows/Linux) or Command+Shift+P (macOS).
- Type
node. - Choose Capture node screenshot.
DevTools downloads an image of the selected node. Node captures can include content extending below the viewport, but exact behavior can vary with the current Chrome build, CSS overflow, and transformed elements. If the result is clipped, inspect the node’s computed dimensions and temporarily remove restrictive height, max-height, or overflow rules to identify the cause.
Capture a selected rectangular area
Area capture is useful when you need only part of the visible page and do not want to select a DOM node.
- Enter Inspect Element Mode by clicking the inspect icon in DevTools.
- Alternatively press Command+Shift+C on macOS or Control+Shift+C on Windows/Linux.
- Hold Command on macOS, or Control on Windows/Linux.
- Click and drag across the desired rectangle in the viewport.
- Release the mouse. DevTools downloads the selected area.
The modifier key is platform-specific. Holding the wrong key selects an element instead of drawing a rectangle.
Capture screenshots while a page loads
Network screenshots show how the page changes during a reload and associate thumbnails with network activity.
- Open the Network panel.
- Open Network panel settings. In the panel’s toolbar, enable Capture screenshots.
- Keep the Network panel focused and reload the page.
- Watch the screenshot thumbnails appear in the Overview timeline.
Hover a thumbnail to mark its capture point on the timeline. Click a thumbnail to filter out requests that occurred afterward. Double-click a thumbnail to zoom it. This is useful for finding when a hero image, consent dialog, layout shift, or error screen appeared.
Capture frames during a Performance recording
Performance screenshots are tied to a trace rather than a simple download.
- Open the Performance panel.
- Enable the Screenshots checkbox before recording.
- Click Record, reproduce the interaction or load you want to study, and stop the recording.
- Inspect the screenshots track alongside scripting, rendering, painting, and network activity.
DevTools captures a screenshot of every frame during the recording. Use this workflow to correlate visual changes with long tasks, layout work, and resource loading. It is not the quickest way to save one static image.
Control the output before you capture
Viewport and responsive layout
Changing width can activate different CSS breakpoints, navigation states, and image crops. Record the viewport dimensions and device preset when screenshots need to be reproducible. A full-size screenshot uses the page layout produced by that emulated viewport; it does not represent every responsive breakpoint at once.
Device scale and sharpness
Device mode’s device pixel ratio affects the number of physical pixels in the output. A high scale produces a sharper image but a larger file. For visual regression, keep the preset, viewport, scale, browser zoom, and font availability constant.
Dynamic and lazy content
Wait for asynchronous content before capturing. Scroll through long pages to trigger lazy images and intersection-observer components. If a page continually animates, pause animations in the Console or add temporary CSS such as * { animation: none !important; transition: none !important; } through the Styles pane. Remove temporary changes before sharing the result.
Privacy and authentication
DevTools captures the page in your current browser session. Make sure the account, cookies, and personal data shown are appropriate for the destination where you will store the image. For a reproducible team workflow, use a test account and a clean profile.
Or skip the browser setup
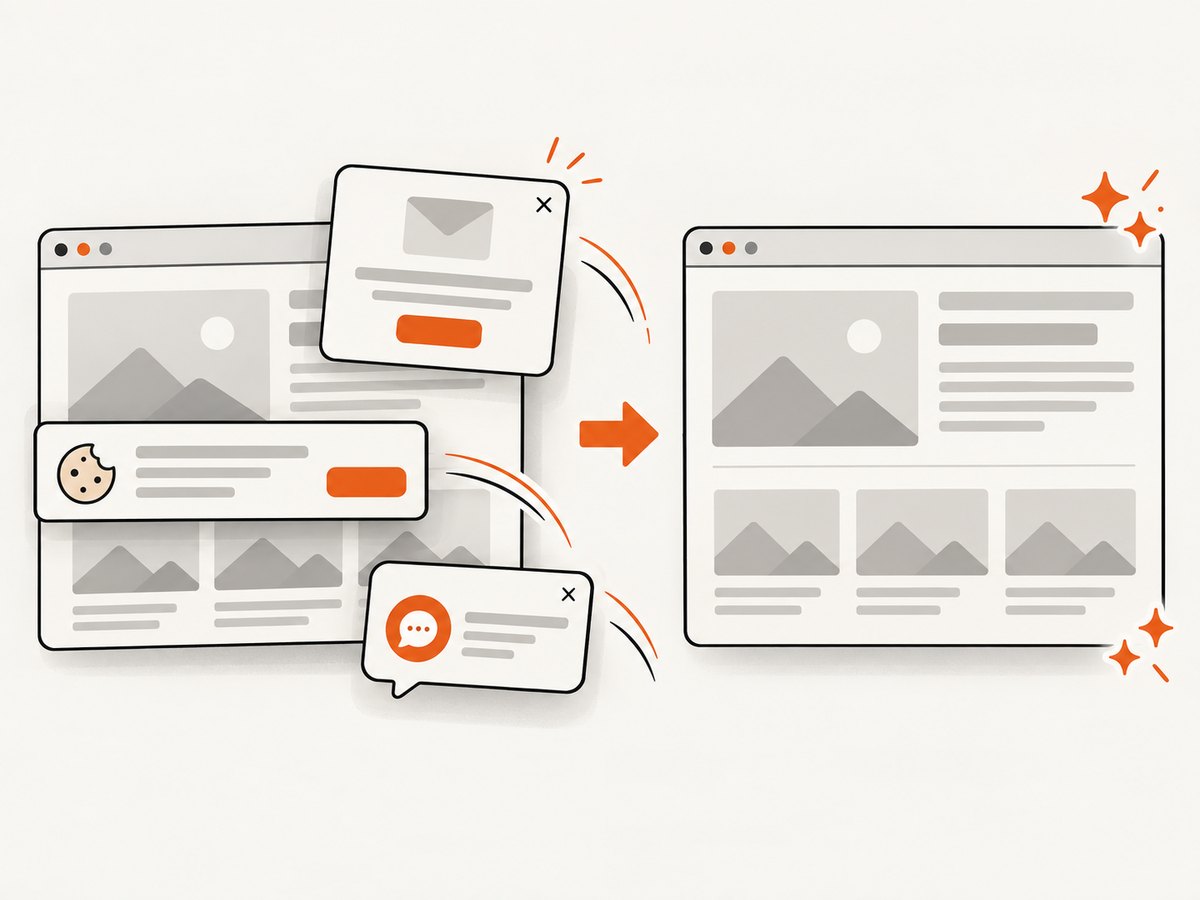
For repeatable captures, CI jobs, documentation pipelines, or many URLs, ScreenshotNeo provides a website screenshot API and MCP server. A single GET request returns PNG, JPEG, WebP, or PDF. It can accept cookie and consent banners like a visitor, then remove more than 60 known consent platforms, newsletter popups, and chat widgets before capture. Each step can be turned off.
Only clean shots are billed. Bot checks or CAPTCHAs, blank pages, timeouts, failed loads, and cache hits cost nothing, and the response identifies the result with X-Page-Verdict and X-Billed headers. Its MCP server exposes take_screenshot, get_page_info, and capture_pdf for Claude, Cursor, and other MCP clients.
See the ScreenshotNeo API documentation for the complete parameter list. The basic request is:
curl -G "https://api.screenshotneo.com/v1/shot" -d access_key=YOUR_API_KEY --data-urlencode url=https://stripe.com -o shot.webpimport requests
r = requests.get(
"https://api.screenshotneo.com/v1/shot",
params={"access_key": "YOUR_API_KEY", "url": "https://stripe.com"},
timeout=90,
)
r.raise_for_status()
open("shot.webp", "wb").write(r.content)const q = new URLSearchParams({ access_key: 'YOUR_API_KEY', url: 'https://stripe.com' });
const res = await fetch(`https://api.screenshotneo.com/v1/shot?${q}`);
if (!res.ok) throw new Error(`Screenshot failed: ${res.status}`);
const fs = await import('node:fs/promises');
await fs.writeFile('shot.webp', Buffer.from(await res.arrayBuffer()));ScreenshotNeo also supports full-page capture with lazy images loaded, CSS-selector element capture, dark mode, 12 device presets or custom viewports, retina scale, custom CSS and JavaScript, clicks, waits for selectors, delays or network idle, blocked ads and resource types, custom headers, cookies, user agents and Authorization, timezone and geolocation, transparent backgrounds, resizing, chosen cache TTLs, signed links, asynchronous jobs with signed webhooks, bulk capture of up to 100 URLs per call, a usage API, and an OpenAPI specification. Parameter names used by other screenshot APIs also work, which helps when migrating.
The Free plan includes 1,000 screenshots per month with no card. Paid plans start at $5 for 3,000 shots; yearly billing gives two months free, and every feature is available on every plan. Create a free ScreenshotNeo account and start with the 1,000 monthly screenshots.
Troubleshooting DevTools screenshots
| Problem | Likely cause | Fix |
|---|---|---|
| “Capture a full size screenshot” is missing | Device mode is not enabled, or the toolbar is narrow | Enable Device mode, then open More options. Widen DevTools or use its overflow menu. |
| The image contains only the visible area | You chose Capture screenshot | Choose Capture a full size screenshot for content below the fold. |
| Node capture is unavailable | No DOM node is selected, or focus is outside Elements | Select the element in Elements, then reopen the Command Menu and search for node. |
| Area selection selects an element | The platform modifier was not held | Hold Command on macOS or Control on Windows/Linux while dragging. |
| Images or sections are blank | Lazy loading, blocked requests, or capture happened too early | Wait, scroll through the page, inspect Network for failures, and capture again. |
| Text wraps differently | Viewport, device scale, browser zoom, or fonts differ | Match those settings and ensure the same fonts are available. |
| Sticky headers repeat or cover content | The page uses position: sticky or fixed elements | Capture after checking the visual result; temporarily disable the sticky rule in DevTools if a clean document image is required. |
| Screenshot thumbnails do not appear in Network | Capture screenshots was enabled after reload or Network was not focused | Enable it first, focus Network, then reload. |
| Performance recording has no screenshots | Screenshots was not enabled before recording | Stop, enable Screenshots, and record again. |
Performance, reliability, and cost considerations
DevTools
DevTools is free and ideal for one-off inspection. It uses the current browser session, so extensions, cached resources, logged-in state, consent choices, and local overrides can change the result. For reliable comparisons, use a dedicated profile, fixed viewport, fixed device scale, stable network conditions, and a repeatable wait point. Very long pages require more memory and can produce large image files; capture only the needed node or area when a full document is unnecessary.
Automated capture
An API is easier to run in CI, scheduled jobs, documentation builds, and bulk workflows. Set explicit timeouts, wait conditions, viewport settings, and output formats. Cache stable pages where appropriate, and inspect verdict and billing headers so failed or non-page responses are handled separately from successful captures. Keep API keys server-side and avoid placing them in public browser code.
FAQ
Can DevTools capture a page longer than the viewport?
Yes. Enable Device mode and choose Capture a full size screenshot. It includes content outside the visible viewport.
Can I capture just a card or component?
Yes. Select its DOM node in Elements, open the Command Menu, search for node, and choose Capture node screenshot.
Which key selects a rectangle?
Hold Command on macOS and Control on Windows/Linux while using Inspect Element Mode.
Why would I use Network screenshots instead of a normal capture?
Network screenshots show when visual states appeared during a reload and let you relate them to requests on the timeline.
Are Performance screenshots the same as a full-page screenshot?
No. Performance screenshots are frame captures during a recording. They help explain visual changes over time.
Can I automate the same result for many URLs?
DevTools is designed for interactive inspection. For repeatable or bulk jobs, use an automation tool or ScreenshotNeo’s API and configure viewport, waits, selectors, output, and authentication explicitly.


