How to Check What Technology a Website Is Built With
Use Wappalyzer or BuiltWith for a quick scan, then verify the clues in page source, scripts, cookies, and response headers.

To check what technology a website is built with, start with a Wappalyzer or BuiltWith lookup, then verify important findings in the page source, rendered page, browser console, cookies, scripts, and Network response headers. A detector can reveal public clues about a CMS, framework, ecommerce platform, analytics tool, or infrastructure, but it cannot prove what hidden backend services the site uses.
For a quick first pass, use the Wappalyzer technology checker or its browser extension. For a second opinion, run the same domain through BuiltWith lookup. If you need a defensible answer, record the specific signal and when you observed it, and describe uncertain results as “likely” rather than certain.
1. What a technology check can tell you
A website is usually a collection of technologies, not one product. Its visible page might use one frontend framework, a separate content management system, an ecommerce platform, analytics scripts, a CDN, and server software. A useful check separates these categories rather than reducing the result to “built with X.”
| Category | What it describes | Possible public evidence |
|---|---|---|
| CMS | How site content is managed and published | Generator metadata, asset paths, cookies, recognizable scripts |
| Frontend framework | How the browser interface is rendered | Script bundles, DOM patterns, JavaScript globals |
| Ecommerce | Storefront, cart, and checkout platform | Platform scripts, cookies, globals, checkout links |
| Analytics and marketing | Measurement, advertising, and tag services | Loaded third-party scripts and network requests |
| Infrastructure | Web server, CDN, proxy, or hosting clues | Document response headers, DNS or publicly exposed assets |
These are observations of what a page exposes. A frontend marker does not establish which language or framework powers the backend, and a CDN header may identify an intermediary rather than the origin server.
2. Fastest method: scan with Wappalyzer and BuiltWith
- Open the Wappalyzer online lookup or install its browser extension, then check the exact domain or page you care about. Wappalyzer says it inspects public signals such as source code, HTTP headers, cookies, and JavaScript variables. It reports detected technologies by category.
- Run the same domain through BuiltWith. BuiltWith describes its detections as based on signals websites emit. A match from both services is useful corroboration, but still record the underlying clue if the answer matters.
- Note the page URL, date, detected technology, and evidence category. Repeat the scan on a representative route such as a product page or checkout if the homepage is not the page you need to understand.
- Follow up manually for consequential conclusions, disagreements, or technologies that scanners may not see.
Scanners are efficient for broad category coverage and checking many domains. Wappalyzer documents lookup, bulk analysis, and API workflows; its API documentation distinguishes cached results from live recursive crawling. A cached result may be useful for a quick overview, while a freshness-sensitive investigation should use a live mode where available. BuiltWith also offers domain lookup. Check each service’s current product documentation for access and mode details.
Neither service sees private source code or necessarily knows about components hidden behind a proxy, loaded only after interaction, restricted by geography, or absent from its detection database. If Wappalyzer and BuiltWith disagree, do not pick the answer that looks more plausible: inspect the page for a reproducible signal.
3. Verify a CMS or framework in page source
- Open the target page in a desktop browser.
- Open its page source using the browser’s “View Page Source” command or context menu.
- Search the source for terms tied to a candidate: the product name, “generator,” recognizable asset directories, script names, or HTML comments.
- Save the exact matching line or asset URL with the page URL and date.
- Compare a second page on the same site. Different routes can use different templates or even separate applications.
A generator meta tag is a direct clue when present. Wappalyzer’s guide gives this historical example: <meta name="generator" content="WordPress 4.9.8" />. It demonstrates the kind of marker to search for; it is not a statement about current WordPress versions. Sites can omit, alter, or leave stale generator values, so corroborate a marker before relying on it.
Asset paths and bundle names can suggest a platform or build system, but they are clues rather than guarantees. Build pipelines can rename files, bundle several packages together, or leave generic paths. A custom site may use a familiar frontend framework without exposing an obvious label.
4. Inspect the rendered page, scripts, and cookies
Page source is the initial HTML response. The rendered DOM reflects changes made after scripts run, so use both when investigating a JavaScript-heavy page.
- Open Developer Tools and select the Elements panel to inspect the rendered DOM.
- In Sources or Network, inspect loaded JavaScript files. Note domains and filenames associated with the page, and distinguish first-party bundles from third-party services.
- Open the Console and check for a candidate global only when you have a reason to test that platform.
- Inspect the browser’s storage or Application panel for cookies associated with the domain.
- Reload and repeat if the page requires consent, login, or interaction before loading relevant code.
For example, Wappalyzer documents the presence of a Shopify JavaScript global as evidence that Shopify code is present on a page. Treat that as evidence of code, not proof that every part of the shop or its backend is hosted by Shopify. A loaded script can also be used by a site in a limited way.
Cookies and scripts can reveal analytics or ecommerce integrations, but a cookie may be set by a third party, and scripts can be conditionally loaded. Record the exact cookie name or script host rather than inferring an entire stack from a category label.
5. Check Network response headers
- Open Developer Tools and choose the Network panel.
- Reload the page with the panel open.
- Select the first document request for the page, rather than an image or script request.
- Inspect its response headers and record any relevant values, especially
Serverand CDN-related headers.
A Server response header may name software such as Apache or Nginx, or an intermediary such as Cloudflare, Akamai, or Amazon CloudFront. Headers are optional and can be changed or removed. If there is no Server header, that does not identify the backend. If a CDN is present, the response may describe the edge service and say nothing conclusive about the origin.
6. Use a repeatable evidence record
For an audit, competitor review, migration assessment, or technical report, use a small evidence log. It prevents a detector label from turning into an unsupported claim and makes later re-checks possible.
| Field | What to capture |
|---|---|
| Page | Exact URL and route checked |
| Time | Date and time, including timezone if relevant |
| Finding | Technology and category reported |
| Evidence | Source line, script URL, cookie, global, or response header |
| Method | Wappalyzer, BuiltWith, browser inspection, or more than one |
| Confidence | Observed, likely, or unconfirmed, with a short reason |
Prefer “The response includes a Cloudflare header” over “The site runs on Cloudflare.” Prefer “A Shopify global and Shopify script were observed on this product page” over “The entire site is built with Shopify.” The first statement in each pair describes evidence; the second makes a broader claim that may not follow from it.
7. Choose a method by speed, coverage, and freshness
| Method | Best for | Limit |
|---|---|---|
| Wappalyzer lookup or extension | Quick category scan; checking a page while browsing | Detected technologies depend on visible signals and detection coverage |
| BuiltWith lookup | Second opinion on a domain and its emitted signals | Does not expose private implementation details |
| View Source and DevTools | Verifiable evidence for a specific page | Manual work; route, region, and timing can change what loads |
| Wappalyzer API or bulk workflow | Checking many domains or integrating lookup into a workflow | Confirm whether cached or live crawling fits the freshness requirement |
For one site, run a detector and manually verify the finding that matters. For a list of domains, use a supported bulk or API workflow, then sample results manually. For a changing site or a time-sensitive question, save dated evidence and repeat the lookup. There is no need to claim a universal accuracy percentage: detection depends on the site’s public signals and the service’s database.
8. Common errors and how to fix them
The detector says “unknown”
Cause: The site exposes few recognizable signals, uses a custom build, or the service has no matching detection rule. Fix: Inspect source, rendered scripts, cookies, and headers. Report what you observed and leave the framework or CMS unconfirmed if there is no reproducible clue.
Two services return different stacks
Cause: They may use different databases, crawl times, or detection logic; the site may also vary by route. Fix: Check the same exact page in each service, note dates, and verify candidates manually. Do not treat either label as proof.
A framework name appears only in a bundle
Cause: Bundled code may include a library without the site being primarily built with it, or the filename may be generic or stale. Fix: Look for additional signals in the rendered DOM, loaded resources, and related pages. Phrase the result as a detected script or likely framework unless stronger evidence exists.
The source has no useful clues
Cause: Many sites remove generator tags, minify assets, or render most content client-side. Fix: Inspect the rendered DOM after load, Network requests, cookies, and response headers. Some backend components will remain unknowable from public browser evidence.
The Server header is missing or names a CDN
Cause: The origin may suppress the header, or an edge service may answer requests on its behalf. Fix: Record the header as seen. Do not infer an origin server from its absence or identify a hidden origin from a CDN value alone.
The site gives different results from different locations
Cause: Regional routing, consent state, experiments, or deployment differences can change the response. Fix: Record region and browser state if relevant, compare the same route, and keep conclusions scoped to the page and conditions observed.
9. Performance, reliability, and cost notes
A one-page detector lookup is usually the least manual starting point; source and DevTools inspection take longer but provide evidence you can cite and re-check. At larger scale, bulk and API options reduce repetitive manual work, but freshness and access details depend on the service and plan. Check the current provider documentation before designing an automated workflow.
Technology detection is an inference problem, not a guarantee of complete inventory. Public markers can disappear after a redesign, vary across templates, or identify a service that is only one part of the stack. For reliable reporting, save the date and exact signal, use a second detector when useful, and phrase conclusions at the same level of certainty as the evidence.
For a basic check, you can do this without paying for a screenshot product: use the browser’s built-in source, Console, and Network tools. Screenshot capture is useful when the question also involves what a page visibly rendered at a particular moment—for example, whether a consent banner or client-rendered widget appeared. A screenshot documents appearance; it does not independently prove which technology generated it.
10. Or skip the browser setup
If you want a screenshot alongside your inspection, ScreenshotNeo is a website screenshot API and MCP server for developers. It does not identify a website’s stack; it captures the rendered page so you can inspect or document what appeared. The do-it-yourself method above is still the way to verify source, scripts, cookies, and headers.
One GET request returns an image or PDF. The example below saves the response as a WebP file; see the ScreenshotNeo API documentation for formats and request options.
curl -G "https://api.screenshotneo.com/v1/shot" -d access_key=YOUR_API_KEY --data-urlencode url=https://stripe.com -o shot.webpimport requests
r = requests.get(
"https://api.screenshotneo.com/v1/shot",
params={"access_key": "YOUR_API_KEY", "url": "https://stripe.com"},
timeout=90,
)
r.raise_for_status()
with open("shot.webp", "wb") as f:
f.write(r.content)const q = new URLSearchParams({ access_key: 'YOUR_API_KEY', url: 'https://stripe.com' });
const res = await fetch(`https://api.screenshotneo.com/v1/shot?${q}`);
if (!res.ok) throw new Error(`Screenshot request failed: ${res.status}`);
const image = Buffer.from(await res.arrayBuffer());
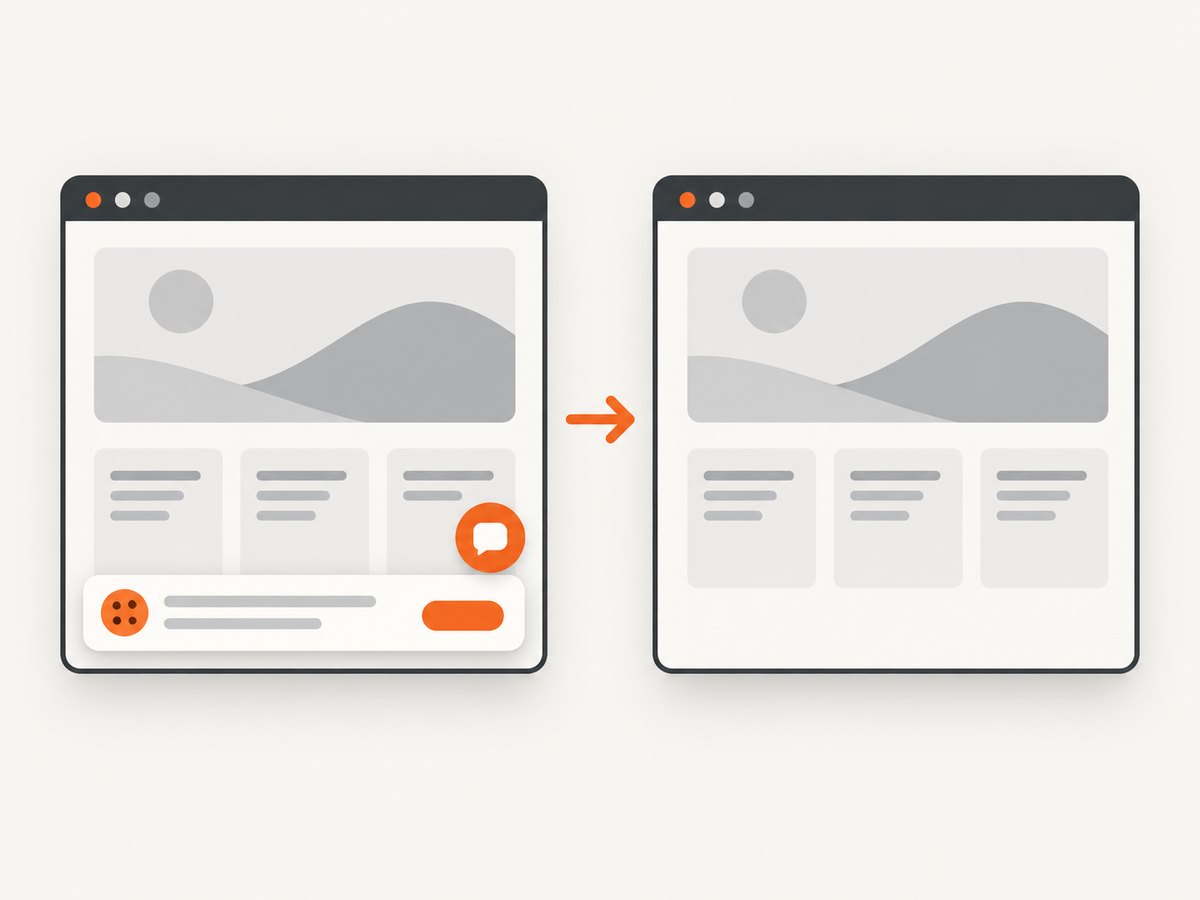
await import('node:fs/promises').then(fs => fs.writeFile('shot.webp', image));- Cookie and consent banners are accepted before capture, and 60+ known consent platforms, newsletter popups, and chat widgets are removed; each step can be turned off.
- Bot checks, blank pages, timeouts, failed loads, and cache hits cost nothing. Responses indicate the page verdict and billing status in headers.
- An MCP server provides
take_screenshot,get_page_info, andcapture_pdftools for Claude, Cursor, and other MCP clients. - The free plan includes 1,000 screenshots per month with no card; paid plans start at $5 for 3,000. Every feature is available on every plan.
Create a free ScreenshotNeo account and get 1,000 screenshots a month with no card.
11. FAQ
Can I tell whether a website is custom-built?
You can sometimes find clues that a familiar CMS or framework is present, but the absence of a marker does not prove the site is custom. “No recognizable public framework signal found” is a more supportable conclusion.
Can I discover a site’s backend language?
Only if it exposes evidence. A frontend script or CDN header does not establish the backend language, and many sites deliberately hide server details.
Does a scanner result prove that the whole site uses a platform?
No. It indicates a detected signal on the inspected page or domain. Check the route and evidence, then limit the claim to what the signal supports.
What should I do if I need to check hundreds of domains?
Use a detector’s documented bulk or API workflow, retain dates and result details, and manually review a sample plus any findings that drive a decision.
Can a screenshot tell me what framework a page uses?
A screenshot records rendered pixels, not source code or network behavior. Use it as visual documentation and inspect the browser evidence separately.