How to Capture a Screenshot Using the Chrome DevTools Console
Chrome’s documented screenshot workflow uses the DevTools Command Menu, not the Console. Capture an area, full page, DOM node, or page-load state with the right workflow.
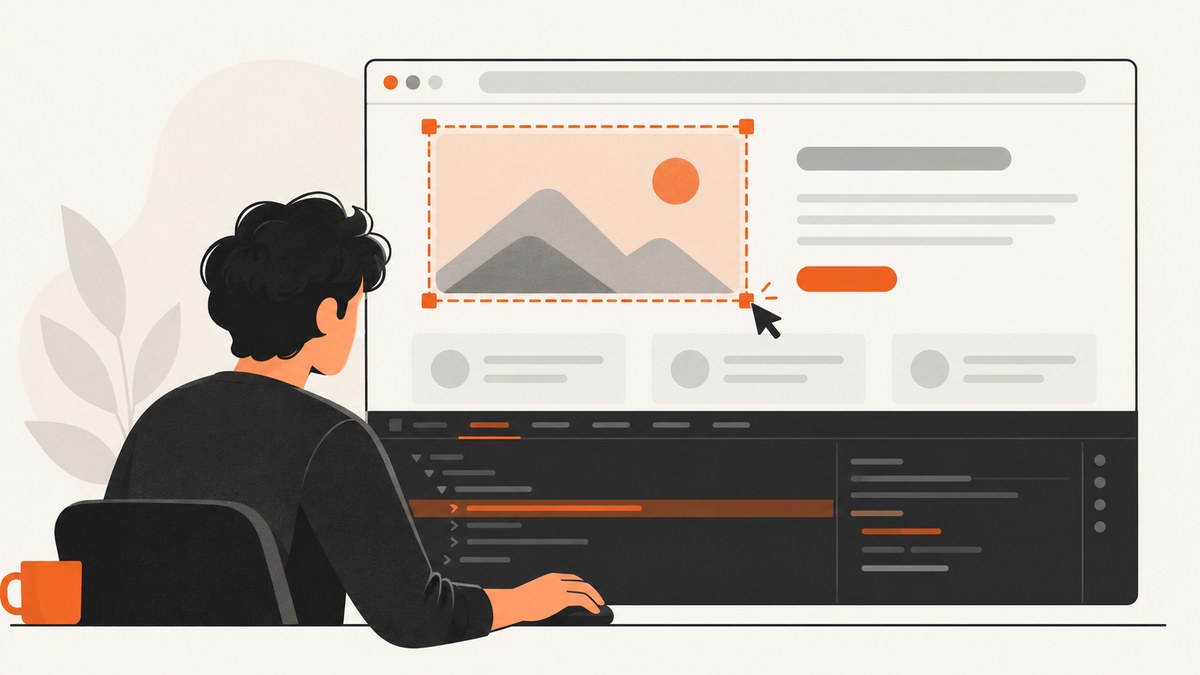
To capture a screenshot of part of a page in Chrome, open DevTools’ Command Menu with Ctrl+Shift+P on Windows or Linux, or Command+Shift+P on Mac. Type screenshot, choose Capture area screenshot, then drag over the page. DevTools must be docked for area capture.
The Chrome DevTools Console is a JavaScript REPL; Chrome’s documented screenshot workflow is not a Console command. You can open the Console directly with Ctrl+Shift+J on Windows, Linux, or ChromeOS, or Command+Option+J on Mac, but use the Command Menu or the relevant DevTools panel to save a screenshot.
1. Capture a selected area with the Command Menu
- Open the page you want to capture in Chrome.
- Open DevTools. You can use F12 or Ctrl+Shift+I on Windows/Linux, or Command+Option+I on Mac. You can also open the Console using its shortcut above.
- Open the Command Menu: Ctrl+Shift+P on Windows/Linux, or Command+Shift+P on Mac.
- Type
screenshotto filter available commands. - Select Capture area screenshot.
- Drag a rectangle around the desired part of the webpage. Chrome saves the resulting screenshot through the browser’s download flow.
If you do not see or cannot use area capture, dock DevTools to the browser window. Chrome documents that area capture does not work while DevTools is undocked.
2. Pick the DevTools capture method that matches the target
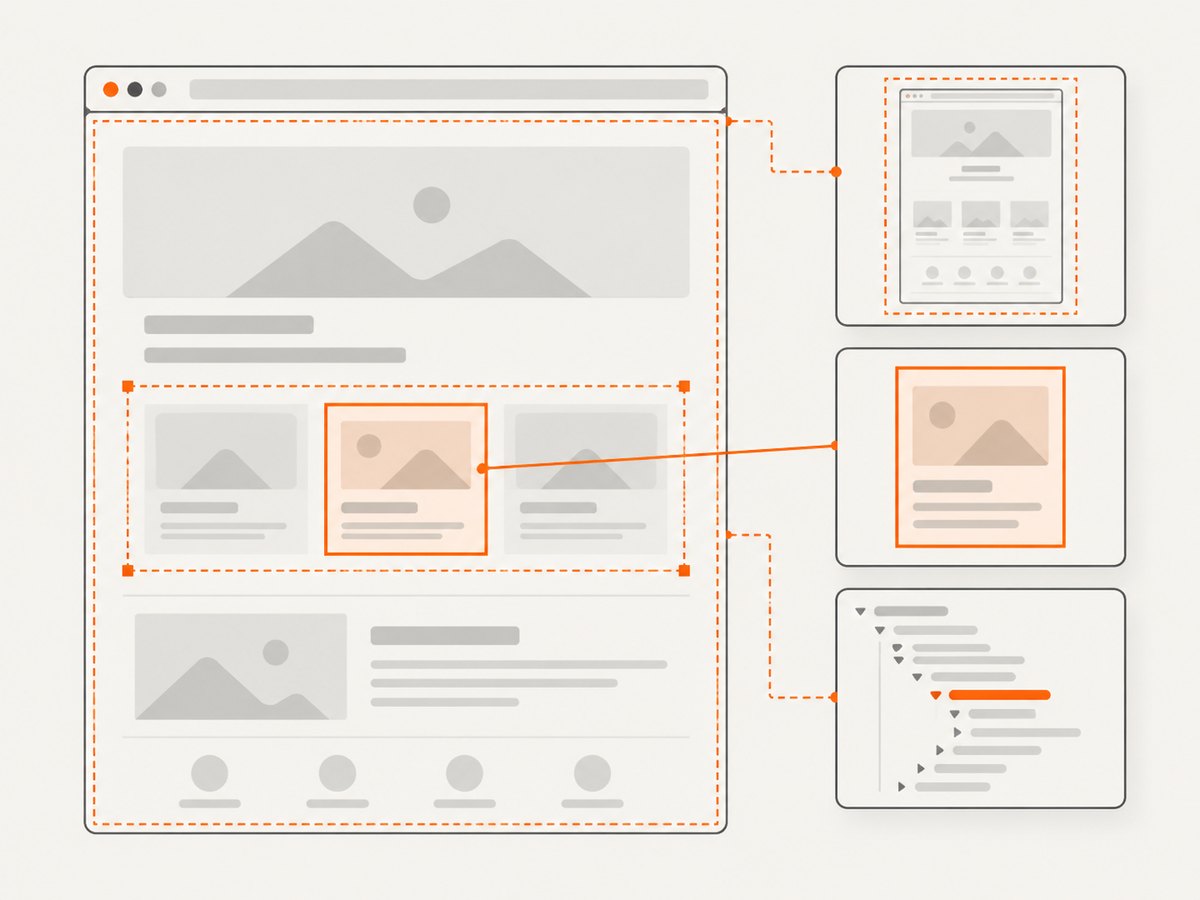
Chrome has several screenshot workflows. They are accessed through different DevTools commands or panels, so choose by what you need to capture:
| Goal | Use | What to know |
|---|---|---|
| A rectangular part of the visible page | Command Menu → Capture area screenshot | Drag to select; DevTools must be docked. |
| One element | Elements panel → select the DOM node → capture node screenshot | Useful for a component or image; the selected node determines the capture target. |
| A node larger than the viewport | Elements panel node screenshot | Can capture the selected node beyond the visible screen area. |
| The whole page | Command Menu → Capture full size screenshot | Captures the full page rather than only the current viewport. |
| A mobile-emulated page | Enable Device Mode, choose the device and use the screenshot command | DevTools can include a device frame where supported by the selected workflow. |
| Frames during page load | Network panel → enable Capture screenshots → reload | Produces a sequence associated with loading, rather than one manually selected region. |
| Frames during a performance recording | Performance panel → record with screenshots enabled | Useful for correlating visual changes with recorded performance activity. |
Chrome’s official guide, 4 ways to capture screenshots with DevTools, walks through the available capture targets. For the Command Menu mechanics and area-capture limitation, see Run commands in the Command Menu.
3. What the Console can and cannot do
The Console evaluates JavaScript in the context of the page and helps inspect or change page state. For example, you can inspect the current page URL:
location.hrefThat does not save a screenshot. Chrome’s documented screenshot commands live in the Command Menu, Elements panel, Network panel, and Performance panel. If you need a screenshot, use one of those workflows rather than expecting a built-in screenshot() Console function.
You can still use the Console before capturing to inspect page state or make temporary DOM changes. Keep in mind that those changes affect what is rendered in the browser, so capture only after the page looks as intended.
4. Troubleshooting
| Symptom | Likely cause | Fix |
|---|---|---|
| Capture area screenshot is missing or unavailable | DevTools is undocked, or the wrong menu is open. | Dock DevTools to the Chrome window, open the Command Menu with Ctrl/Command+Shift+P, and search for screenshot. |
| Typing “screenshot” in Console returns an error | The Console treats input as JavaScript; screenshot commands are not documented there as Console functions. | Use the Command Menu or the capture workflow for the relevant panel. |
| The screenshot contains only the visible viewport | You used area capture or another viewport-sized capture. | Use the full-size screenshot command for a whole-page capture, or capture the desired DOM node in Elements. |
| The result is not a sequence of loading states | A manual screenshot command captures a single result. | In Network, enable Capture screenshots and reload; for performance analysis, use screenshot capture in a Performance recording. |
| The mobile screenshot has the wrong dimensions | Device Mode or its viewport settings were not configured before capture. | Set the emulated device and viewport first, then capture again. |
5. Performance, reliability, and cost
DevTools is built into Chrome, and the documented manual workflows do not require a screenshot service or special hardware. They are practical for one-off debugging, documentation, and page inspection. For repeatable captures across many URLs, a manual browser workflow requires opening pages and selecting capture commands each time; DevTools’ Network and Performance screenshot features are intended to show page states during analysis, not to act as a hosted batch screenshot API.
For reliable manual captures, wait until the page reaches the state you want, verify the right viewport or DOM target, and choose the command that matches the output. Screenshots of dynamic pages can differ as content loads or changes. DevTools has no per-screenshot service charge; ordinary browser and machine resource use still applies.
Or skip the browser setup
ScreenshotNeo is a website screenshot API and MCP server for developers. One GET request returns a PNG, JPEG, WebP, or PDF. See the ScreenshotNeo API documentation for the parameters and options.
curl -G "https://api.screenshotneo.com/v1/shot" -d access_key=YOUR_API_KEY --data-urlencode url=https://stripe.com -o shot.webpimport requests
r = requests.get(
"https://api.screenshotneo.com/v1/shot",
params={"access_key": "YOUR_API_KEY", "url": "https://stripe.com"},
timeout=90,
)
open("shot.webp", "wb").write(r.content)const q = new URLSearchParams({ access_key: 'YOUR_API_KEY', url: 'https://stripe.com' });
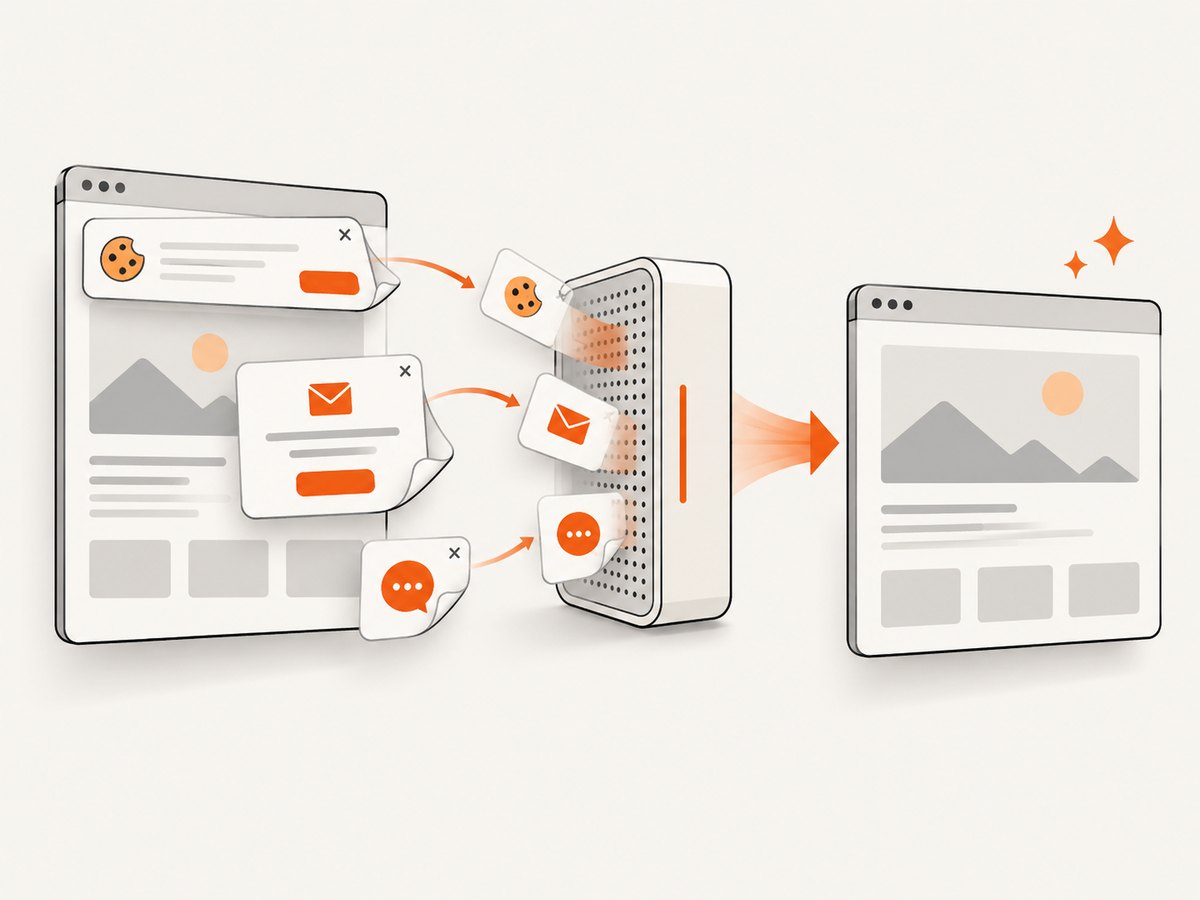
const res = await fetch(`https://api.screenshotneo.com/v1/shot?${q}`);ScreenshotNeo accepts cookie and consent banners and removes more than 60 known consent platforms, newsletter popups, and chat widgets before capture; each of those steps can be turned off. Bot checks, blank pages, timeouts, failed loads, and cache hits cost nothing, and response headers identify the page verdict and billing status. Its MCP server provides take_screenshot, get_page_info, and capture_pdf for Claude, Cursor, and other MCP clients. The Free plan includes 1,000 screenshots per month with no card; paid plans start at $5 for 3,000 screenshots. All features are available on every plan.
Create a free ScreenshotNeo account to get 1,000 screenshots a month with no card.
FAQ
Can I take a screenshot directly from the Chrome Console?
Chrome’s documented screenshot procedure uses DevTools commands and panels. The Console runs JavaScript, but it is not the documented entry point for these screenshot workflows.
What is the shortcut to open the Console?
Use Ctrl+Shift+J on Windows, Linux, or ChromeOS, or Command+Option+J on Mac.
What is the shortcut for the screenshot Command Menu?
Use Ctrl+Shift+P on Windows/Linux or Command+Shift+P on Mac.
Can I capture a full-page screenshot in Chrome?
Yes. Use DevTools’ full-size screenshot command from the Command Menu; for a particular element, use the node screenshot workflow in Elements.


