How to Configure Chrome’s Remote Debugging Port With Selenium
Attach Selenium to an existing Chrome session with debuggerAddress, avoid profile collisions, fix unsupported commands, and troubleshoot every common port error.
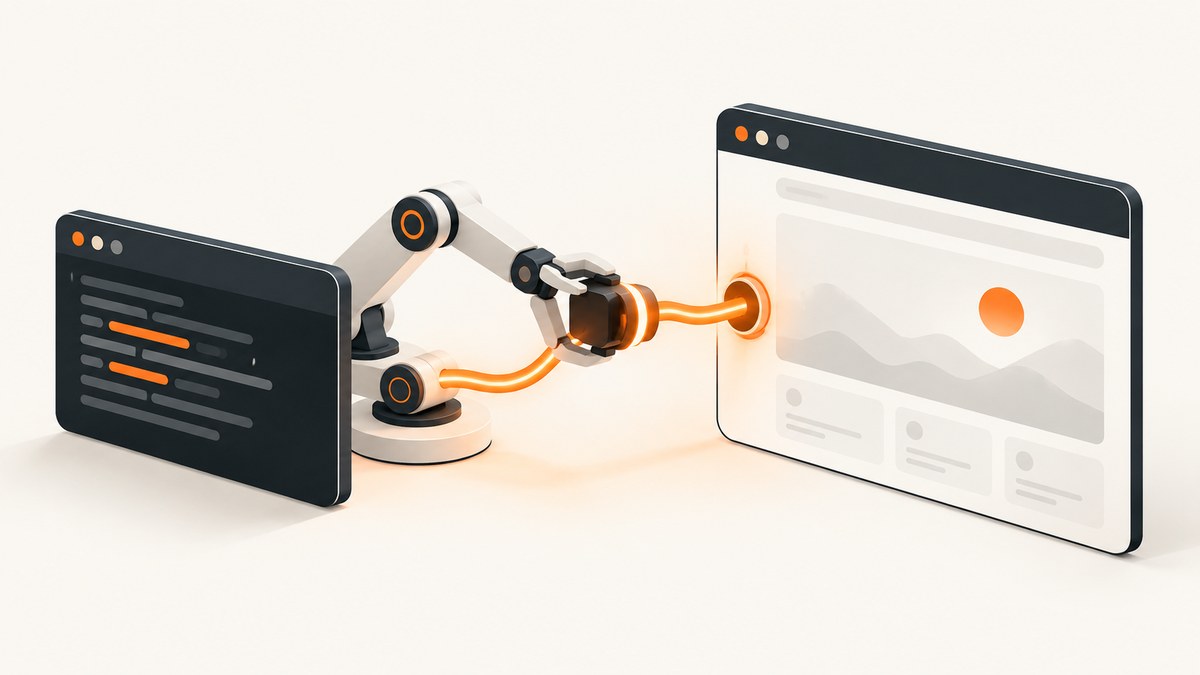
Direct answer: start a dedicated Chrome process with --remote-debugging-port=9222 and a separate --user-data-dir, then set Selenium’s Chrome option debuggerAddress to 127.0.0.1:9222. Selenium attaches to that existing browser instead of launching a new one.
google-chrome --remote-debugging-port=9222 --user-data-dir=/tmp/chrome-debugfrom selenium import webdriver
from selenium.webdriver.chrome.options import Options
options = Options()
options.add_experimental_option("debuggerAddress", "127.0.0.1:9222")
# Equivalent in current Selenium Python bindings:
# options.debugger_address = "127.0.0.1:9222"
driver = webdriver.Chrome(options=options)
driver.get("https://example.com")
print(driver.title)
driver.quit()The address must use hostname:port form. Chrome has to expose the endpoint before Selenium starts, and ChromeDriver and Chrome should use matching major versions. Attaching is useful for a manually prepared profile, an interactive login, or a browser started by another process. It also has limitations: because ChromeDriver did not start the browser, its automation extension was not loaded, so some WebDriver commands are unavailable.
What the remote debugging port does
Chrome’s remote debugging port exposes a DevTools endpoint that another process can use to inspect and control the running browser. Selenium hands the endpoint to ChromeDriver through the debuggerAddress Chrome option. Selenium documents the value as an address such as localhost:9222 in its documentation.
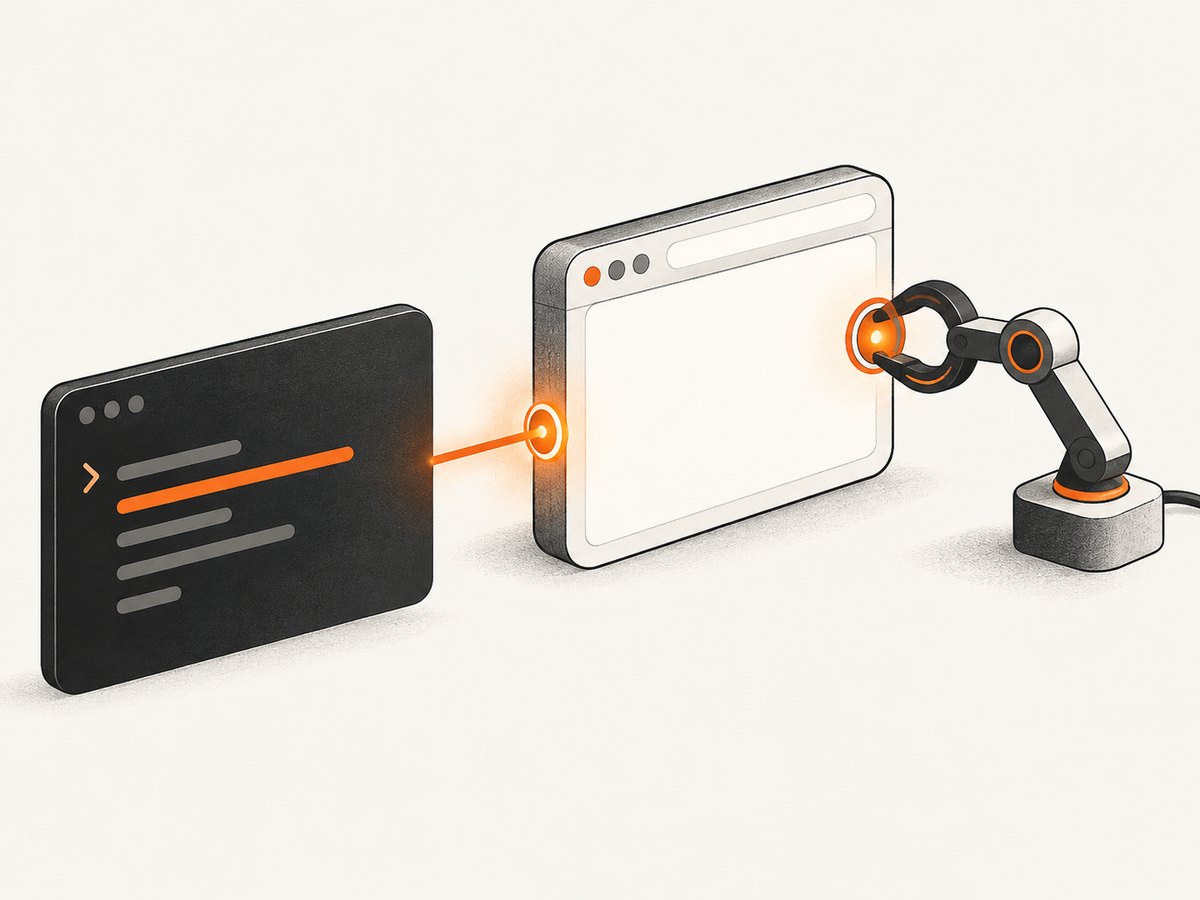
This is an attach workflow, not the normal Selenium workflow. In a normal session, Selenium asks ChromeDriver to launch Chrome, ChromeDriver adds its automation extension, and Selenium receives a new session. With remote debugging, Chrome is already running and Selenium connects to it.
The port is local by default when you use 127.0.0.1. If you make it reachable from another machine, treat it as a privileged control interface and protect it with a secure tunnel or network boundary.
Step 1: Launch an isolated Chrome instance
Close the Chrome window you do not want to automate, or start a separate instance with its own profile. A dedicated profile prevents an existing Chrome process from taking over the command and avoids changing your everyday browsing profile.
Linux
google-chrome \
  --remote-debugging-port=9222 \
  --user-data-dir=/tmp/chrome-debug
On distributions that use Chromium, replace google-chrome with the installed executable, such as chromium or chromium-browser.
macOS
/Applications/Google\ Chrome.app/Contents/MacOS/Google\ Chrome \
  --remote-debugging-port=9222 \
  --user-data-dir=/tmp/chrome-debug
Windows
& "C:\Program Files\Google\Chrome\Application\chrome.exe" `
  --remote-debugging-port=9222 `
  --user-data-dir="$env:TEMP\chrome-debug"
Choose a different port if 9222 is occupied, then use that same port in Selenium. For example, if you launch with --remote-debugging-port=9333, set debuggerAddress to 127.0.0.1:9333.
Why --user-data-dir matters
Chrome normally reuses an already-running process for a profile. When that happens, a second command can appear to succeed while the original process keeps running without the debugging flag. A unique directory forces Chrome to create an isolated profile and accept the debugging configuration.
The profile can contain cookies, local storage, extensions, and other state. Use a disposable directory for automation, and do not put real credentials in a profile that will be shared with other processes.
Step 2: Verify that the endpoint is available
Before debugging Selenium, confirm that Chrome is listening on the expected port. A simple HTTP request should return DevTools metadata:
curl http://127.0.0.1:9222/json/versionIf the command cannot connect, Chrome was not started with the flag, the wrong executable was used, the port is occupied, or a firewall is blocking access. Check the launch command and process list before changing Selenium code.
You can also inspect the list of pages:
curl http://127.0.0.1:9222/json/listStart with a page already open if you want Selenium to work with that tab. Otherwise, Selenium can navigate the attached browser to a new URL after connecting.
Step 3: Attach Selenium with debuggerAddress
Python
from selenium import webdriver
from selenium.webdriver.chrome.options import Options

options = Options()
options.add_experimental_option("debuggerAddress", "127.0.0.1:9222")

driver = webdriver.Chrome(options=options)
try:
    driver.get("https://example.com")
    print(driver.title)
finally:
    driver.quit()
Current Selenium Python bindings also expose the property form:
options = Options()
options.debugger_address = "127.0.0.1:9222"
driver = webdriver.Chrome(options=options)
Install or upgrade Selenium with python -m pip install -U selenium. Selenium Manager can obtain a compatible driver in supported setups, but Chrome and ChromeDriver still need compatible major versions.
Java
import org.openqa.selenium.WebDriver;
import org.openqa.selenium.chrome.ChromeDriver;
import org.openqa.selenium.chrome.ChromeOptions;

public class AttachChrome {
    public static void main(String[] args) {
        ChromeOptions options = new ChromeOptions();
        options.setExperimentalOption("debuggerAddress", "127.0.0.1:9222");

        WebDriver driver = new ChromeDriver(options);
        try {
            driver.get("https://example.com");
            System.out.println(driver.getTitle());
        } finally {
            driver.quit();
        }
    }
}
JavaScript with Selenium WebDriver
const { Builder } = require('selenium-webdriver');
const chrome = require('selenium-webdriver/chrome');

(async () => {
  const options = new chrome.Options();
  options.addArguments('--debuggerAddress=127.0.0.1:9222');

  const driver = await new Builder()
    .forBrowser('chrome')
    .setChromeOptions(options)
    .build();

  try {
    await driver.get('https://example.com');
    console.log(await driver.getTitle());
  } finally {
    await driver.quit();
  }
})();
Use the option API provided by your Selenium language binding. The important value remains the same: a reachable host and the port used when Chrome started.
Port mode versus pipe mode
A debugging port and a debugging pipe are different launch configurations. Port mode exposes a TCP endpoint and supports the attach workflow described in this guide. Pipe mode uses an operating-system pipe between ChromeDriver and Chrome. Selenium’s Python options include --remote-debugging-pipe, but pipe mode is intended for a browser launched as part of that session; it is not an alternate spelling for attaching to an existing browser at 127.0.0.1:9222.
If you need to connect to a browser that another process already started, use a port. If you control the entire browser lifecycle and want ChromeDriver and Chrome to communicate without a listening TCP port, use the pipe configuration instead.
What works after attaching, and what may not
Navigation, element lookup, clicks, JavaScript execution, screenshots, and many standard WebDriver operations normally work after attachment. The browser keeps its existing tabs, cookies, authentication state, extensions, and profile data.
The limitation comes from startup order. ChromeDriver did not load its automation extension when Chrome launched. ChromeDriver’s help documentation states that some commands, including browser-window resizing, require that extension. If you see operation not supported when using remote debugging, rewrite the test to let ChromeDriver launch a fresh session.
Use this decision rule:
- Need an existing login or manually prepared state? Attach with
debuggerAddress. - Need every WebDriver command, including extension-dependent commands? Remove
debuggerAddressand let ChromeDriver launch Chrome. - Need repeatable CI runs? Prefer a fresh, isolated ChromeDriver session with a temporary profile.
Configuration options that commonly matter
| Setting | Example | Use |
|---|---|---|
| Remote port | --remote-debugging-port=9222 |
TCP port Chrome exposes for DevTools clients. |
| Profile directory | --user-data-dir=/tmp/chrome-debug |
Prevents collisions with an existing Chrome profile. |
| Debugger address | 127.0.0.1:9222 |
Endpoint Selenium passes to ChromeDriver. |
| Pipe mode | --remote-debugging-pipe |
Private ChromeDriver-to-Chrome communication for a launched session. |
Keep the host and port explicit in scripts. Avoid relying on a default port, because another local service may already use it. For parallel jobs, allocate a unique port and profile directory to each browser.
Remote machines and port forwarding
If Chrome runs on another machine, Selenium must reach the debugging endpoint from its own environment. The safest pattern is to forward the remote port through an authenticated tunnel, then use the forwarded local address in debuggerAddress. For example, a tunnel may expose the remote 9222 endpoint locally as 19222; Selenium would then use 127.0.0.1:19222.
Do not expose an unauthenticated Chrome debugging port to the public internet. Anyone who can reach it may be able to control the browser, inspect pages, or access profile state.
Common errors and fixes
“cannot connect to chrome at 127.0.0.1:9222”
Cause: Chrome is not running with that port, the host or port is wrong, or the endpoint is blocked.
Fix: run curl http://127.0.0.1:9222/json/version, confirm the launch command, and make the Selenium address exactly match it.
The normal Chrome window opens instead
Cause: Chrome reused an existing profile process, so the new flags were not applied.
Fix: close the original Chrome process and launch with a distinct --user-data-dir.
Session not created: version mismatch
Cause: ChromeDriver and Chrome have incompatible major versions.
Fix: inspect both version numbers, install a compatible ChromeDriver, and keep the browser and driver updated together. Selenium’s documentation identifies a version mismatch as a driver startup error.
“operation not supported when using remote debugging”
Cause: the command requires ChromeDriver’s automation extension, which was not loaded when the existing browser started.
Fix: remove debuggerAddress and let ChromeDriver launch a new Chrome session. This is the documented solution for extension-dependent commands.
Selenium attaches to the wrong tab
Cause: the debugging browser has multiple pages or targets.
Fix: inspect /json/list, close unwanted tabs, or navigate the attached driver explicitly before interacting with elements.
Port already in use
Cause: another process owns 9222, or a previous Chrome instance is still running.
Fix: identify and stop the old process, or select another port and update both commands.
Works locally but fails in CI
Cause: CI starts no browser, uses a locked profile, runs in a different network namespace, or cannot access the chosen port.
Fix: start Chrome explicitly in the job with a temporary profile, verify the endpoint from the same container or host as Selenium, and assign unique ports for parallel jobs.
Performance and reliability practices
- Reuse deliberately: one attached browser avoids repeated startup cost, but long-lived sessions accumulate tabs, cookies, memory, and stale state.
- Reset between tests: close tabs and clear application state when isolation matters. For strict reproducibility, launch a fresh profile per test group.
- Use unique resources in parallel: each worker needs its own profile directory and debugging port.
- Wait for readiness: poll
/json/versionbefore creating the Selenium driver instead of assuming Chrome started immediately. - Keep versions aligned: pin or manage Chrome and ChromeDriver together in build images.
- Limit remote exposure: keep the port on localhost or inside a protected tunnel.
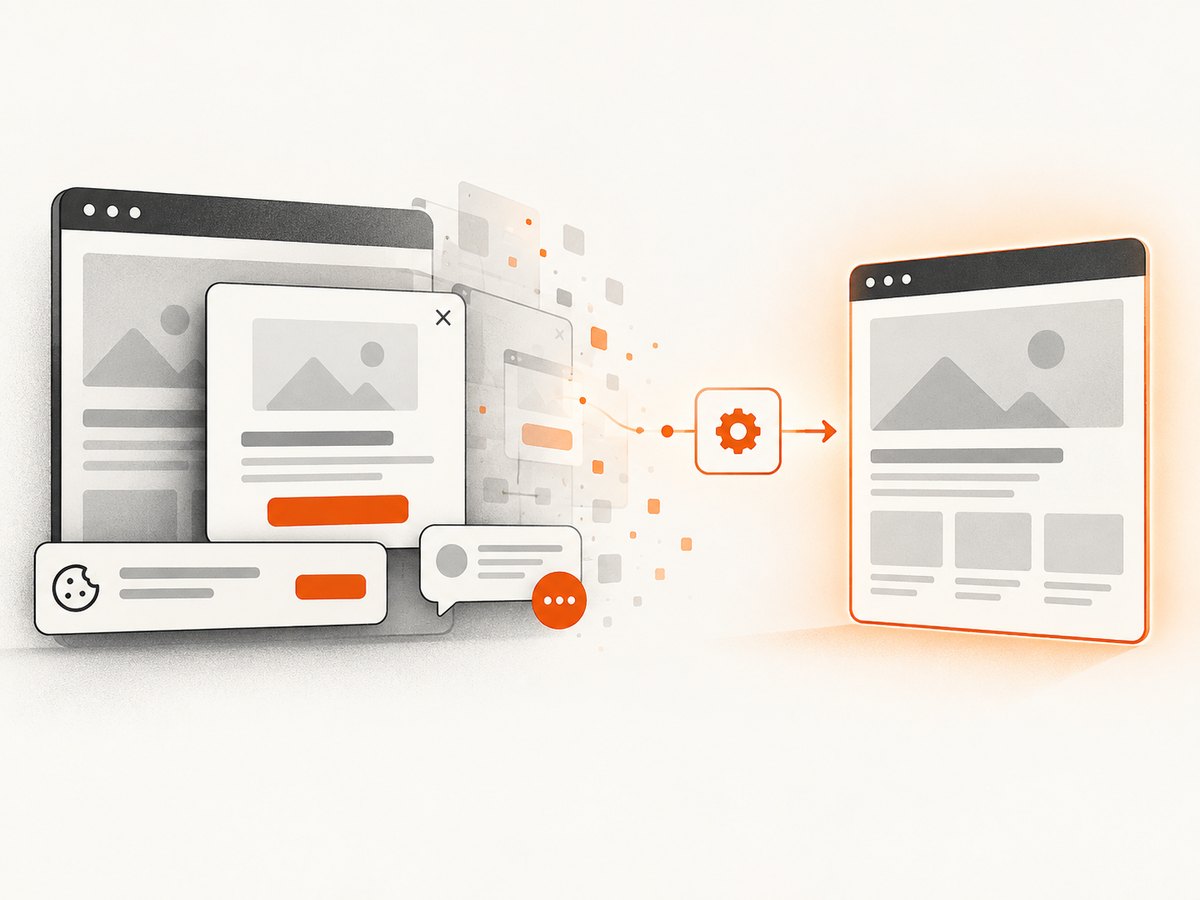
Attachment itself does not guarantee a clean page state. A profile may contain consent banners, popups, chat widgets, or authentication prompts that affect screenshots and element interactions.
Or skip the browser setup
If your goal is a reliable website screenshot rather than browser-session control, ScreenshotNeo provides a single API request. Its capture service accepts consent banners before the shot and removes more than 60 known consent platforms, newsletter popups, and chat widgets; each step can be turned off. Bot checks, blank pages, timeouts, failed loads, and cache hits are not billed, and responses identify the result with X-Page-Verdict and X-Billed headers.
Read the full parameter reference in the ScreenshotNeo documentation.
cURL
curl -G "https://api.screenshotneo.com/v1/shot" \
  -d access_key=YOUR_API_KEY \
  --data-urlencode url=https://example.com \
  -o shot.webp
Python
import requests

r = requests.get(
    "https://api.screenshotneo.com/v1/shot",
    params={"access_key": "YOUR_API_KEY", "url": "https://example.com"},
    timeout=90,
)
r.raise_for_status()
open("shot.webp", "wb").write(r.content)
Node.js
const q = new URLSearchParams({
  access_key: 'YOUR_API_KEY',
  url: 'https://example.com'
});
const res = await fetch(`https://api.screenshotneo.com/v1/shot?${q}`);
if (!res.ok) throw new Error(`Screenshot failed: ${res.status}`);
const buffer = Buffer.from(await res.arrayBuffer());
require('fs').writeFileSync('shot.webp', buffer);
ScreenshotNeo also supports full-page captures with lazy images loaded, CSS-selector element captures, dark mode, device presets, custom viewports, retina scale, PDF output, custom CSS and JavaScript, clicks, selector or network-idle waits, request blocking, headers, cookies, user agents, authorization, timezone, geolocation, transparent backgrounds, resizing, configurable caching, signed links, asynchronous jobs, signed webhooks, bulk capture of up to 100 URLs per call, usage reporting, and an OpenAPI specification. An MCP server provides take_screenshot, get_page_info, and capture_pdf tools for Claude, Cursor, and other MCP clients.
The Free plan includes 1,000 screenshots per month with no card. Paid plans start at $5 for 3,000 screenshots, and every feature is available on every plan. Create a free ScreenshotNeo account and start with the monthly free allowance.
FAQ
Can I attach to Chrome on another computer?
Yes. Forward the debugging port securely, then use the forwarded host and port in debuggerAddress. The Selenium process must be able to reach that endpoint.
Can I use my regular Chrome profile?
You can, but a separate profile is safer and more predictable. Existing Chrome processes may ignore flags, and automation can alter cookies or other browsing state.
Does debuggerAddress create a new browser?
No. It tells ChromeDriver to connect to an already-running Chrome instance. Chrome must be started separately with a debugging endpoint.
Should I use a port or a pipe?
Use a port to attach to an existing browser. Use a pipe when ChromeDriver launches and owns the browser lifecycle.
Why does resizing fail after attachment?
Some commands depend on ChromeDriver’s automation extension. That extension was not loaded into a browser started independently, so launch a fresh ChromeDriver session when those commands are required.
How do I choose a port for parallel tests?
Assign each worker a free port and a unique --user-data-dir. Verify each endpoint before connecting Selenium.


