How to Convert HTML With SVG Charts to PDF
Render HTML and SVG charts accurately by waiting for data, fonts, and layout before printing with Puppeteer, Chrome, or wkhtmltopdf.
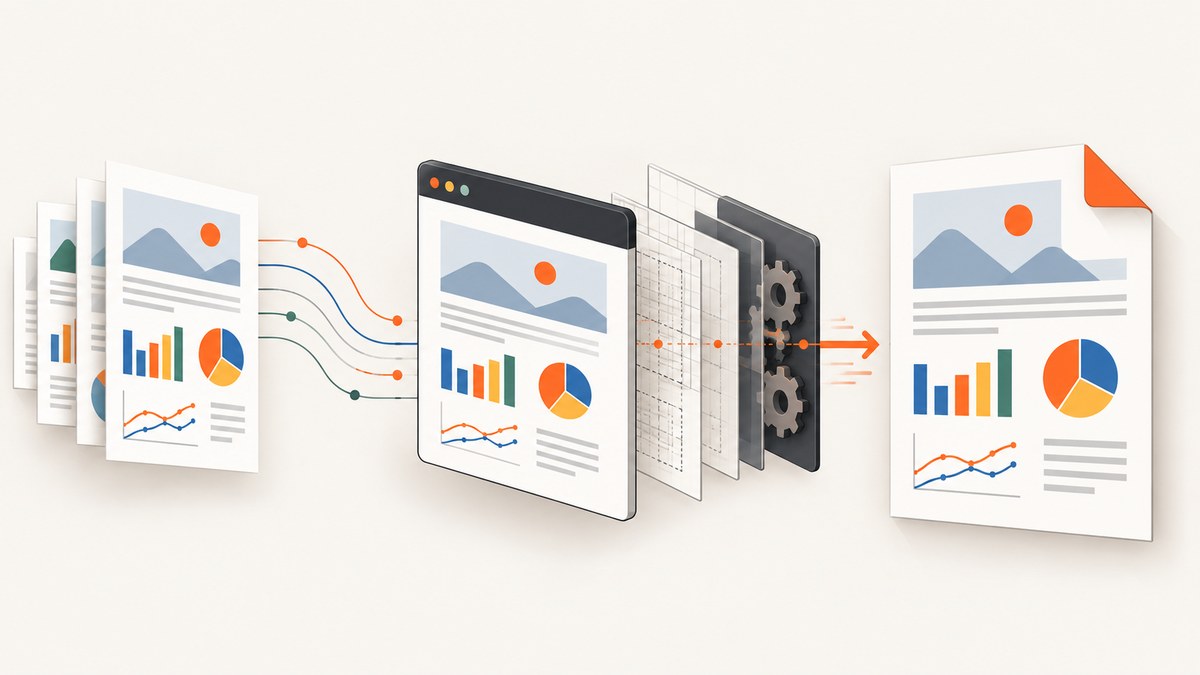
Use a browser renderer that executes the page’s JavaScript, waits for the chart’s own ready state, and then prints the page to PDF. For modern SVG libraries and Chart.js, Chromium through Puppeteer is usually the safest starting point because it runs the same browser code that created the chart. Headless Chrome provides a concise CLI alternative. wkhtmltopdf can work for legacy pages, but its older Qt WebKit engine must be validated against your chart code.
1. The reliable conversion sequence
- Load the HTML in a real browser engine.
- Wait for data requests, SVG layout, transitions, images, and web fonts.
- Expose an application-specific readiness flag such as
window.chartReady = true. - Select print or screen media deliberately.
- Configure page size, margins, backgrounds, scale, and pagination.
- Write the PDF and inspect representative pages in CI.
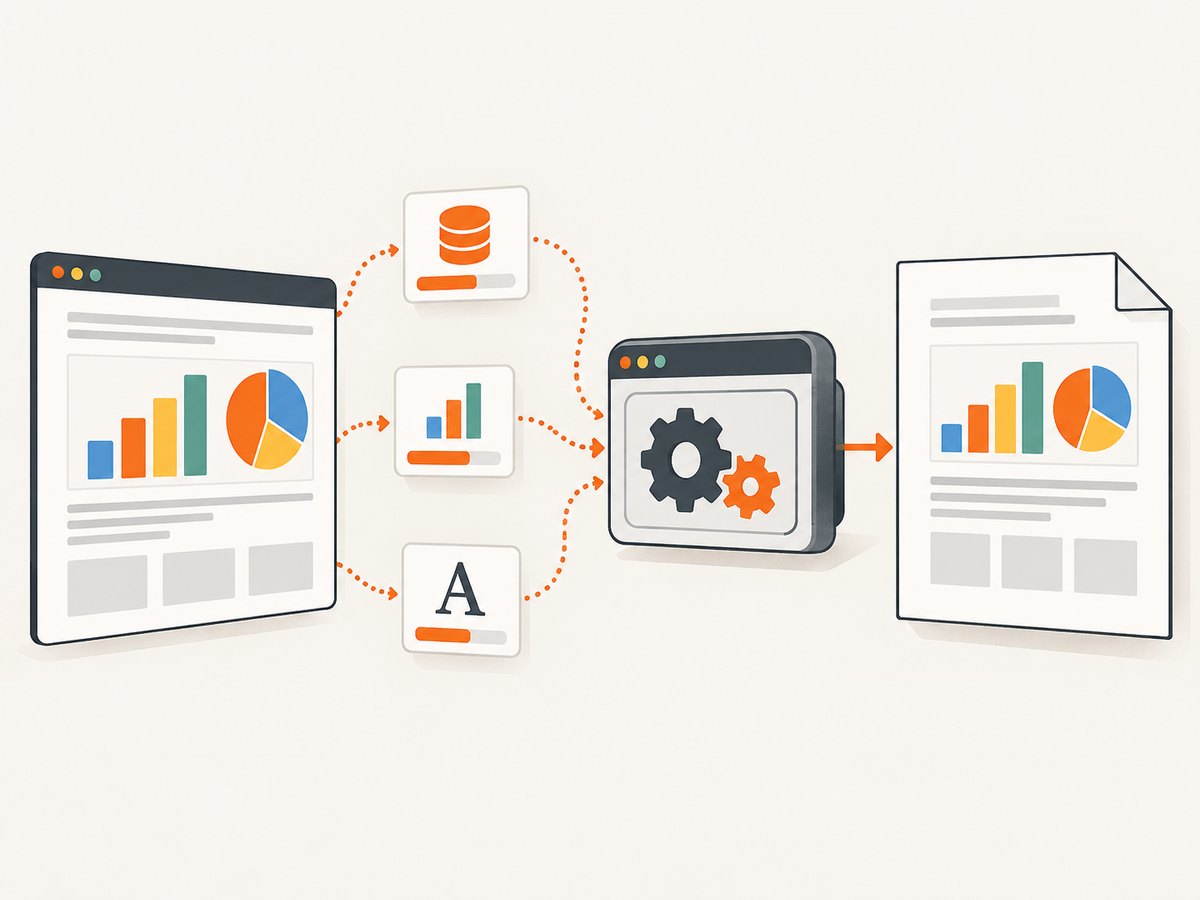
A fixed sleep can hide race conditions. A deterministic readiness condition is the important part: set the flag only after your chart library has finished fetching data, calculating scales, drawing SVG elements, completing transitions, and measuring fonts.
2. Make the page print-ready
Give every chart a predictable print-time size. Avoid responsive containers whose width is unknown until after printing begins.
<div id="sales-chart" class="chart"></div>
<script type="module">
  await renderSalesChart();
  await document.fonts.ready;
  window.chartReady = true;
</script>
@page {
size: A4 landscape;
margin: 12mm;
}
.chart, .legend, .plot-area {
break-inside: avoid;
-webkit-print-color-adjust: exact;
print-color-adjust: exact;
}
.chart {
width: 100%;
min-height: 260px;
}
@media print {
.animation, .loading-indicator { display: none; }
}Use explicit SVG width and height or a stable viewBox. Disable animations during capture, because a PDF can otherwise contain a partially transitioned chart. Make sure the renderer can reach external fonts, images, JavaScript bundles, and data endpoints.
3. Puppeteer: complete Node.js example
Puppeteer navigates with Chromium, waits for network activity and your application flag, then calls page.pdf(). Its guide documents waiting for fonts by default; setting waitForFonts explicitly makes the intent clear. The example uses print media. If your chart is styled only for the screen, change the media type as shown below.
import puppeteer from 'puppeteer';

const browser = await puppeteer.launch({ headless: true });
try {
  const page = await browser.newPage();
  await page.setViewport({ width: 1440, height: 900, deviceScaleFactor: 1 });

  await page.goto('https://example.test/report', {
    waitUntil: 'networkidle2',
    timeout: 60_000
  });

  await page.waitForFunction(
    () => window.chartReady === true,
    { timeout: 30_000 }
  );

  // Use this when your chart has screen-only styles.
  // await page.emulateMediaType('screen');
  await page.emulateMediaType('print');

  await page.pdf({
    path: 'report.pdf',
    format: 'A4',
    landscape: true,
    printBackground: true,
    preferCSSPageSize: true,
    waitForFonts: true,
    margin: {
      top: '12mm',
      right: '12mm',
      bottom: '12mm',
      left: '12mm'
    }
  });
} finally {
  await browser.close();
}
Install and run it with:
npm install puppeteer
node export-report.mjs
networkidle2 is a useful baseline, not proof that a chart is complete. Keep the application-specific flag. If a page has long polling or analytics requests, network idle may never occur; in that case use waitUntil: 'domcontentloaded' and rely on chartReady.
4. Chrome command line
For a static URL or a job that does not need custom application logic, headless Chrome can print directly:
chrome --headless --print-to-pdf=report.pdf \
  --no-pdf-header-footer \
  --timeout=10000 \
  https://example.test/report
When timers must advance before the chart appears, add a virtual-time budget:
chrome --headless --print-to-pdf=report.pdf \
  --no-pdf-header-footer \
  --virtual-time-budget=10000 \
  https://example.test/report
Chrome’s timeout or virtual-time budget is a scheduling control, not a chart correctness guarantee. Prefer a page-level readiness hook whenever you control the application.
5. wkhtmltopdf for legacy pages
wkhtmltopdf is an open-source LGPLv3 command-line tool that renders through Qt WebKit and runs without a display service. A basic invocation is:
wkhtmltopdf --enable-javascript --javascript-delay 2000 \
  report.html report.pdf
--javascript-delay is only a fallback for pages without a deterministic readiness signal. Modern SVG libraries may depend on browser APIs or CSS behavior that differs from Qt WebKit, so compare the generated PDF with a Chromium version before standardizing this path.
6. PDF layout and SVG fidelity options
| Concern | What to configure |
|---|---|
| Media styles | Puppeteer uses print media by default. Call page.emulateMediaType('screen') when the chart’s correct styles exist only under screen media. |
| Backgrounds | Set printBackground: true and use print-color-adjust: exact when fills, grid bands, or gradients matter. |
| Paper geometry | Choose format, width, height, landscape, margins, and scale deliberately. |
| CSS page size | Set preferCSSPageSize: true when the @page rule should control the paper size. |
| Pagination | Use break-inside: avoid on charts and legends; use page-break rules around report sections. |
| Fonts | Wait for document.fonts.ready; ensure the font files are reachable from the renderer. |
| External assets | Make data APIs, images, fonts, and scripts reachable and authenticated in the rendering environment. |
| SVG sizing | Use explicit dimensions and a stable viewBox. Avoid measuring a hidden or zero-width element. |
7. Waiting for charts, data, and fonts
Set readiness after every dependency is complete:
async function renderReport() {
  const response = await fetch('/api/report-data');
  const data = await response.json();
  drawSvgChart(document.querySelector('#sales-chart'), data);
  await document.fonts.ready;
  await new Promise(requestAnimationFrame);
  document.documentElement.classList.add('ready-for-export');
  window.chartReady = true;
}

renderReport().catch(error => {
  window.chartError = String(error);
});
In Puppeteer, fail clearly if the page reports an error:
await page.waitForFunction(
  () => window.chartReady === true || window.chartError,
  { timeout: 30_000 }
);
const chartError = await page.evaluate(() => window.chartError);
if (chartError) throw new Error(`Chart failed: ${chartError}`);
8. Common failures and fixes
| Symptom | Likely cause | Fix |
|---|---|---|
| Blank chart area | Capture ran before data or SVG layout completed. | Expose window.chartReady after rendering and wait for it. |
| SVG missing but HTML is present | JavaScript failed, an API was blocked, or the chart container had zero size. | Capture console and page errors, verify network access, and set explicit dimensions. |
| Wrong colors or no grid fills | Print CSS suppresses backgrounds. | Use printBackground: true and print-color-adjust: exact. |
| Fonts change chart labels | Web fonts were not loaded before measurement. | Await document.fonts.ready and keep waitForFonts: true. |
| Chart is clipped | Responsive width, overflow, or an unsuitable paper orientation. | Set a stable width, inspect overflow, use landscape, or adjust margins and scale. |
| Two charts split across pages | Normal pagination breaks the chart container. | Apply break-inside: avoid; reduce the chart’s height if it cannot fit. |
| External image is absent | Authentication, CORS, mixed content, or an unreachable URL. | Make the asset reachable to Chromium and check the page’s failed requests. |
| Puppeteer hangs on navigation | Long polling prevents network idle. | Use domcontentloaded plus the application readiness flag. |
| wkhtmltopdf output differs | Qt WebKit does not match current Chromium behavior. | Use Chromium for modern charts or validate every chart feature on wkhtmltopdf. |
9. Debugging and reproducibility
Log browser console messages, page errors, failed requests, the final viewport, and the readiness state. Save an HTML snapshot and a PDF from the same revision when investigating a mismatch. Pin the browser version in CI, use stable data fixtures, and disable animations. Compare PDFs at the page level because a chart can be correct while pagination is wrong.
10. Performance, reliability, and cost
- Reuse a browser process for batches, but create an isolated page for each URL.
- Set navigation and readiness timeouts separately so a slow API does not consume an unbounded job.
- Block analytics and unnecessary third-party resources when they are not part of the report.
- Cache immutable assets such as fonts and chart bundles while keeping report data explicit.
- Use a queue for large batches and retry only transient navigation or network failures.
- Choose paper size and scale once and keep them consistent to make output reproducible.
Rendering cost is driven by browser startup, page complexity, asset loading, and chart computation. Measure your own workload rather than assuming a fixed delay or a particular engine will be faster.
11. Or skip the browser setup
ScreenshotNeo provides a website capture API that can return a PDF from a URL, while handling browser setup and capture options. See the ScreenshotNeo documentation for the complete parameter reference.

curl -G "https://api.screenshotneo.com/v1/shot" -d access_key=YOUR_API_KEY --data-urlencode url=https://example.test/report -o report.pdfimport requests
r = requests.get("https://api.screenshotneo.com/v1/shot", params={"access_key": "YOUR_API_KEY", "url": "https://example.test/report"}, timeout=90)
r.raise_for_status()
open("report.pdf", "wb").write(r.content)const q = new URLSearchParams({ access_key: 'YOUR_API_KEY', url: 'https://example.test/report' });
const res = await fetch(`https://api.screenshotneo.com/v1/shot?${q}`);
if (!res.ok) throw new Error(`HTTP ${res.status}`);
const fs = await import('node:fs/promises');
await fs.writeFile('report.pdf', Buffer.from(await res.arrayBuffer()));ScreenshotNeo removes cookie and consent banners, newsletter popups, and chat widgets before the shot. Bot checks, blank pages, timeouts, failed loads, and cache hits are not billed, and the response identifies the page verdict and billing status in X-Page-Verdict and X-Billed headers. Its MCP server lets Claude, Cursor, and other MCP clients call take_screenshot, get_page_info, and capture_pdf. The free plan includes 1,000 shots each month with no card; paid plans start at $5 for 3,000 shots. Create a free ScreenshotNeo account.
12. FAQ
Can an SVG chart be converted without JavaScript?
Yes, if the SVG is already present in the HTML. If JavaScript creates or updates it, use a browser renderer and wait for the chart’s ready state.
Should I use print or screen media?
Use print media for dedicated print CSS. Use screen media when the chart’s colors and layout are defined only for the screen.
Is a two-second delay enough?
No. It may work for one run and fail when data, fonts, or network timing changes. A readiness signal is more reliable.
Why does the PDF have a different page count?
Paper size, margins, scale, font metrics, and print CSS all affect pagination. Declare them explicitly and keep browser versions consistent.
When is wkhtmltopdf appropriate?
It can suit simple or legacy pages when its Qt WebKit output matches your HTML. Validate modern SVG features before adopting it.