How to Create and Analyze a HAR File in Chrome and Firefox
Learn how to capture, export, inspect, and safely share HAR files from Chrome DevTools and Firefox Network Monitor.

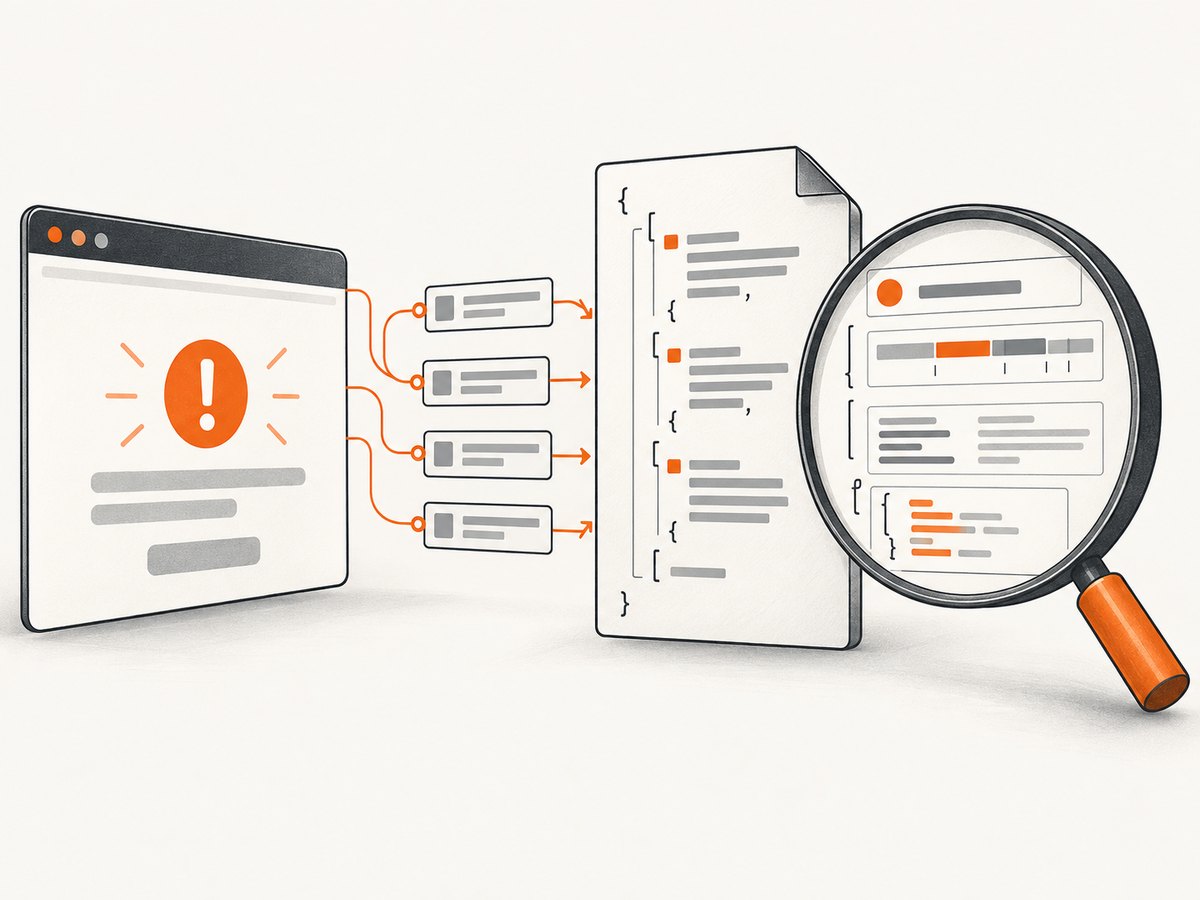
A HAR file is a JSON export of browser network activity. To create one, open Chrome DevTools or Firefox Network Monitor before reproducing the problem, preserve the request list across navigation when needed, then export the captured requests. To analyze it, start with the request associated with the visible failure and inspect its status, method, URL, timing, size, headers, redirects, and response content.
What a HAR file contains
HAR (HTTP Archive) is a JSON-based format for recorded HTTP and network sessions. A capture can include request and response URLs, methods, status codes, headers, transferred sizes, timing data, initiators, and response content. It describes the conditions of one recording; it does not automatically prove the root cause of a problem.
How to create a HAR file in Chrome
- Open the page where the problem occurs.
- Open DevTools and select the Network panel before reproducing the issue. Chrome records requests while DevTools is open.
- If the issue requires a reload or navigation, enable Preserve log. This keeps requests from earlier page loads in the list.
- Reproduce the failure or slow behavior. Wait until the relevant request, error, redirect, or timeout appears.
- Export the capture. Use Export HAR (sanitized) in the Network panel, or right-click a request and choose Copy > Save all [listed] as HAR (sanitized).
- Save the
.harfile with a name that identifies the page and reproduction, such ascheckout-timeout-chrome.har.
Chrome documents sanitized export as the default. It excludes sensitive header examples such as Cookie, Set-Cookie, and Authorization. If a support team explicitly requires those headers, open Settings > Preferences > Network, enable Allow to generate HAR with sensitive data, and then choose the sensitive-data export option. Treat that file as confidential.
Open an existing HAR in Chrome
Drag the file into the Network request table or use Import HAR. Imported requests can show initiators, which helps identify the script or document that caused a request.
Chrome DevTools Network reference
How to create a HAR file in Firefox
- Open Web Developer Tools and select Network Monitor. Firefox begins monitoring when the tool opens and records while the Toolbox remains open.
- If you must reload or navigate, enable Persist Logs. Firefox clears the request list on navigation or reload by default.
- Reproduce the issue and wait for the request or failure to appear.
- Open the HAR menu and choose Save All as HAR.
- Save the file with a descriptive
.harname.
Copy All as HAR copies the listed requests to the clipboard instead of writing a file. To inspect a supplied capture, open the Network Monitor actions menu and choose Import HAR.
Firefox Network Monitor toolbar documentation · How Firefox Network Monitor records traffic
How to analyze a HAR file
1. Find the request tied to the symptom
Start with the request made at the time the visible error occurred. Use the URL, domain, request type, or timestamp to narrow the list. In Chrome, use Network filters and inspect request initiators. In Firefox, filter by URL or properties and search request headers, response headers, and response content.
2. Check the request table
| Field | What to check | Possible lead |
|---|---|---|
| Status | 4xx, 5xx, redirects, or a missing response | Authentication, routing, server, or connectivity problem |
| Method | GET, POST, PUT, DELETE, and so on | Wrong operation or an unexpected retry |
| URL and domain | Host, path, query string, and redirect target | Wrong environment, endpoint, or redirect chain |
| Timing | Long connection, waiting, download, or total duration | Slow server, dependency, or network path |
| Transferred size | Large or repeated responses | Oversized assets, retries, or inefficient payloads |
| Headers | Authorization, cookies, cache, content type, and response headers | Session, caching, CORS, or content negotiation issue |
| Response content | Error body, empty body, or unexpected format | Application-level failure hidden behind a successful transport |
| Initiator | The document or script that triggered the request | Unexpected code path or third-party dependency |
These observations are investigative leads. A single HAR captures one browser, account, network, and time; reproduce the issue more than once when you need to distinguish an intermittent failure from a consistent one.
3. Investigate redirects and missing responses
- Follow each redirect and verify that the final host and path are expected.
- Look for a request that remains pending or never receives a response.
- Compare successful and failed captures to identify the first request that diverges.
- Check whether a resource is blocked, repeated, or initiated by an unexpected script.
4. Inspect Firefox timelines and search
Firefox exposes status, method, URL, transferred size, and a per-request timeline. Its Network Monitor supports full-text search across request and response headers and response content. Use those tools to locate an error string, a missing header, or a slow phase without reading every entry.
Firefox request list and HAR actions
Analyze a HAR with Python
The following script prints failed requests, slow requests, redirects, and requests with no response. It uses only Python’s standard library.
#!/usr/bin/env python3
import json
import sys
from pathlib import Path

if len(sys.argv) != 2:
    raise SystemExit(f"usage: {Path(sys.argv[0]).name} capture.har")

har = json.loads(Path(sys.argv[1]).read_text(encoding="utf-8"))
entries = har.get("log", {}).get("entries", [])

for entry in entries:
    request = entry.get("request", {})
    response = entry.get("response", {})
    status = response.get("status", 0)
    time_ms = entry.get("time", 0)
    method = request.get("method", "?")
    url = request.get("url", "?")
    transferred = response.get("_transferSize", response.get("bodySize", 0))

    if status == 0 or status >= 400 or time_ms >= 1000 or 300 <= status < 400:
        print(f"{status or 'NO RESPONSE':>11} {time_ms:8.1f} ms {transferred:10} bytes {method:6} {url}")
Run it with:
python3 inspect_har.py capture.harPrivate HAR formats can contain browser-specific fields, so treat missing or vendor-prefixed fields as normal. The script is a triage aid; confirm conclusions in the browser’s request and response details.
Capture quality checklist
- Open the Network panel or Network Monitor before reproducing the issue.
- Clear unrelated requests when possible so the relevant sequence is easy to identify.
- Enable Chrome Preserve log or Firefox Persist Logs only when navigation would otherwise remove necessary entries.
- Export immediately after the behavior occurs.
- Record the browser, operating system, reproduction time, steps, and visible symptom beside the HAR.
- Repeat the capture if the behavior is intermittent.
Privacy and safe sharing
A HAR can reveal browsing paths, URLs, headers, query parameters, and request or response content. Inspect it before sharing. Remove unrelated traffic and redact secrets where feasible. Chrome’s sanitized export excludes documented sensitive headers, but that does not guarantee that every sensitive value elsewhere in the file is removed. Use Chrome’s sensitive-data export only when it is necessary and approved, and send the result through an approved channel.
Troubleshooting
The request list is empty
Open DevTools or Network Monitor before reproducing the problem. Reload after opening the panel, and verify that no filter is hiding the requests.
Requests disappeared after reload
Enable Chrome Preserve log or Firefox Persist Logs before navigating. Firefox clears the list by default.
The HAR does not include the failing request
Reproduce the issue with the panel already open, remove restrictive filters, and export again immediately. Some failures occur before the page you expected is loaded, so inspect document, navigation, and redirect requests too.
The exported file is too large to share
Capture only the reproduction window, remove unrelated traffic if your support process allows it, and use sanitized export. Do not remove entries needed to explain the failure.
A support team asks for cookies or authorization headers
Confirm the request through an approved channel, enable Chrome’s sensitive-data export preference only when required, and handle the resulting file as confidential. Never post it in a public issue.
The HAR shows a 200 response but the page still fails
Inspect the response body, content type, client-side console errors, initiator, and subsequent requests. HTTP success only describes that request; application code can still reject its contents.
Timing looks slow but the cause is unclear
Compare the connection, waiting, download, and total timing phases, then compare a successful capture. Check for redirects, repeated requests, large transfers, and third-party resources before assigning a cause.
Performance, reliability, and cost notes
HAR capture adds little operational cost because it is built into Chrome and Firefox, but recording every request can produce large files and more difficult analysis. Keep captures focused, use persistent logs only across the navigation that matters, and reproduce under the same conditions when comparing runs. A HAR is evidence from one session, so use multiple captures for intermittent problems and preserve the surrounding reproduction notes.
Or skip the browser setup
If your goal is a clean visual capture after diagnosing a page, ScreenshotNeo returns a screenshot or PDF with one request. Its browser automation accepts consent banners before capture and removes more than 60 known consent platforms, newsletter popups, and chat widgets. Bot checks, blank pages, failed loads, timeouts, and cache hits are not billed, and the response identifies the page verdict and billing result.

See the ScreenshotNeo API documentation for the complete options, including full-page and element capture, device presets, dark mode, custom CSS and JavaScript, waits, request blocking, headers, cookies, geolocation, PDF settings, caching, signed links, asynchronous jobs, webhooks, bulk capture, and usage reporting.
curl -G "https://api.screenshotneo.com/v1/shot" -d access_key=YOUR_API_KEY --data-urlencode url=https://stripe.com -o shot.webpimport requests
r = requests.get("https://api.screenshotneo.com/v1/shot", params={"access_key": "YOUR_API_KEY", "url": "https://stripe.com"}, timeout=90)
open("shot.webp", "wb").write(r.content)const q = new URLSearchParams({ access_key: 'YOUR_API_KEY', url: 'https://stripe.com' });
const res = await fetch(`https://api.screenshotneo.com/v1/shot?${q}`);An MCP server lets Claude, Cursor, and other MCP clients call take_screenshot, get_page_info, and capture_pdf. The free plan includes 1,000 screenshots a month with no card; paid plans start at $5 for 3,000. Create a free ScreenshotNeo account.
FAQ
Is a HAR a screenshot?
No. A HAR records network requests and responses as JSON. It does not replace a visual screenshot.
Can I edit a HAR before sharing it?
Yes, but preserve the entries and fields needed to reproduce the problem. Redact secrets and unrelated personal data, then document what was removed.
Which browser is better for HAR analysis?
Both support export and import. Chrome documents sanitized export and an opt-in sensitive-data mode; Firefox provides persistent logs, HAR save/import controls, request timelines, and full-text search.
Does importing a HAR replay the requests?
Importing displays the recorded requests for inspection. It is not the same as sending the requests again to the original servers.


