How to Debug Cypress Requests Missing from the Command Log
Find out why Cypress requests are missing from the Command Log, and how to distinguish hidden browser traffic from Node-side `cy.request()` calls.
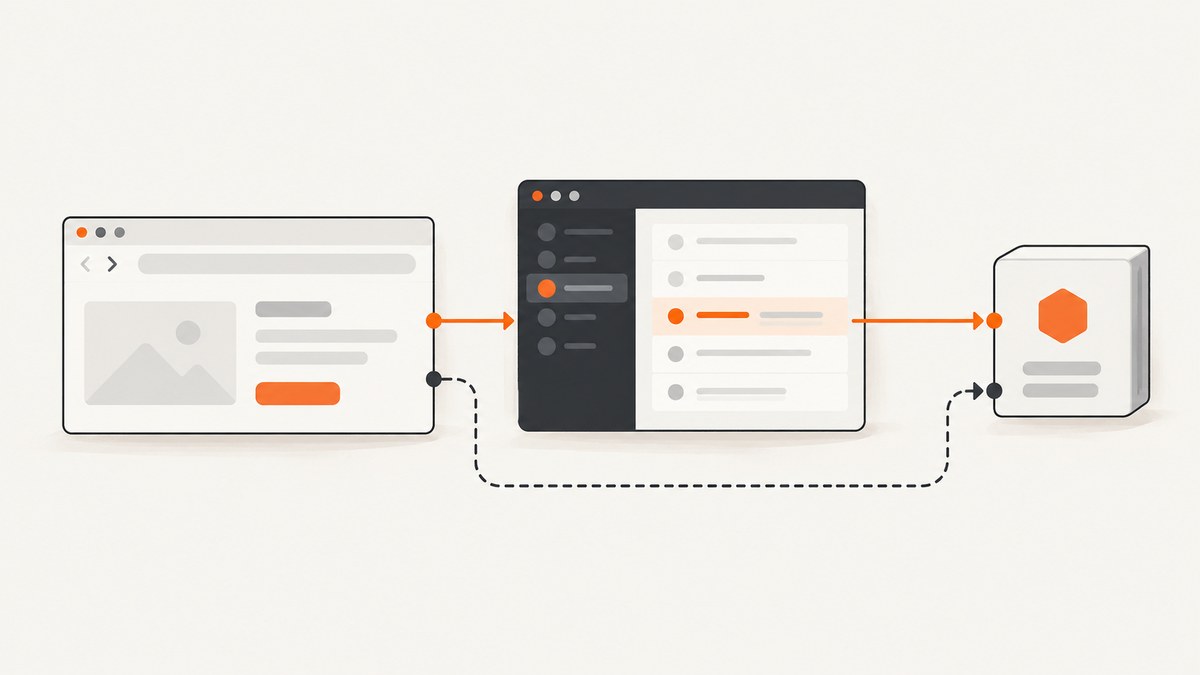
When a request seems missing from the Cypress Command Log, check three things first: whether HTTP entries are hidden in Open Mode, whether Command Log output is disabled, and whether the request came from the application browser or from Cypress’s Node process. Cypress normally shows application XMLHttpRequest and fetch traffic. A cy.request() call is different: it runs from Node, bypasses the browser traffic proxy used by cy.intercept(), and will not appear in the browser’s Network tab.
Use the steps below to identify which case you have, then inspect or assert on the request in the right place. Hiding HTTP entries is a display setting: it does not stop requests or remove them from assertions and interception tooling.
1. Show HTTP request entries in Open Mode
In Cypress Open Mode, look at the Command Log header’s Options menu and enable Show HTTP Requests. This setting controls whether XHR and fetch entries are displayed alongside commands. If it was off, the application request could still have happened; it was simply omitted from the visible log. Cypress documents that hiding HTTP requests does not change how tests run. [Cypress Open Mode]
- Open the test in Cypress’s interactive runner.
- Open the Command Log’s Options menu.
- Turn on Show HTTP Requests.
- Re-run the test or trigger the request, then inspect the log.
This setting is useful for reducing noise during normal test work. It is not a network filter and does not change what the application sends.
2. Check whether the whole Command Log is disabled
If commands as well as network entries are absent, check how Cypress was launched. The CYPRESS_NO_COMMAND_LOG=1 environment variable disables Command Log output. The --no-runner-ui CLI option skips rendering the runner UI, including its usual log updates. Those settings are sometimes used when isolating performance issues, but make the interactive log unavailable. [Cypress troubleshooting]
# macOS/Linux: launch without the no-command-log setting
unset CYPRESS_NO_COMMAND_LOG
npx cypress open

# Or run headed with the runner UI
npx cypress run --headed
In a CI job or shell script, inspect the environment and Cypress arguments rather than changing the test’s intercept logic first. If the variable is set by a CI configuration, remove it for a diagnostic run.
3. Identify the request’s origin
The key question is whether the browser application made the request or the Cypress test called cy.request(). Application XHR and fetch traffic is normally visible in the Command Log and can pass through cy.intercept(). Cypress documents that cy.request() executes from the Node process, outside the application browser’s proxy path. It therefore does not match a browser intercept and does not show up in the browser’s Network panel. [Cypress FAQ]
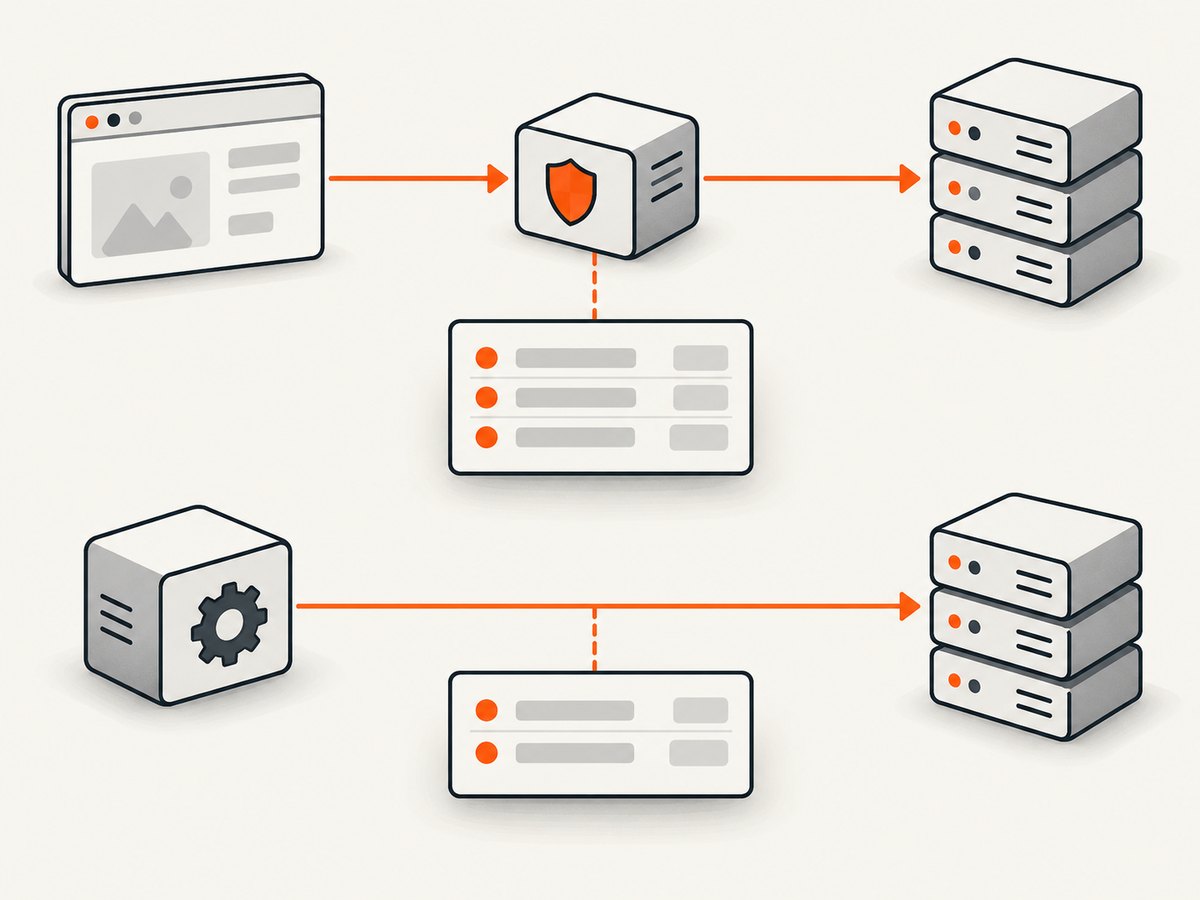
| Request source | Where to inspect | Does browser cy.intercept() observe it? |
|---|---|---|
Application fetch() or XHR |
Command Log; browser Network panel | Usually, when route criteria match |
cy.request() |
Click the command entry; inspect details in the browser console | No; the request originates in Node |
For example, this application request is browser-originated and can be intercepted:
cy.intercept('GET', '/api/profile').as('profile')
cy.visit('/account')
cy.wait('@profile').its('response.statusCode').should('eq', 200)
This call is a Cypress command that makes an HTTP request from Node. Use its own command entry to inspect details:
cy.request('GET', 'https://example.com/api/profile').then((response) => {
  expect(response.status).to.eq(200)
  expect(response.body).to.have.property('id')
})
Click the cy.request() entry in the Command Log to print its request and response details in the browser console. For a failed CI run, Cypress documents Test Replay as a way to inspect cy.request() information after the run. [Cypress FAQ]
4. Review intercepts that can hide matching requests
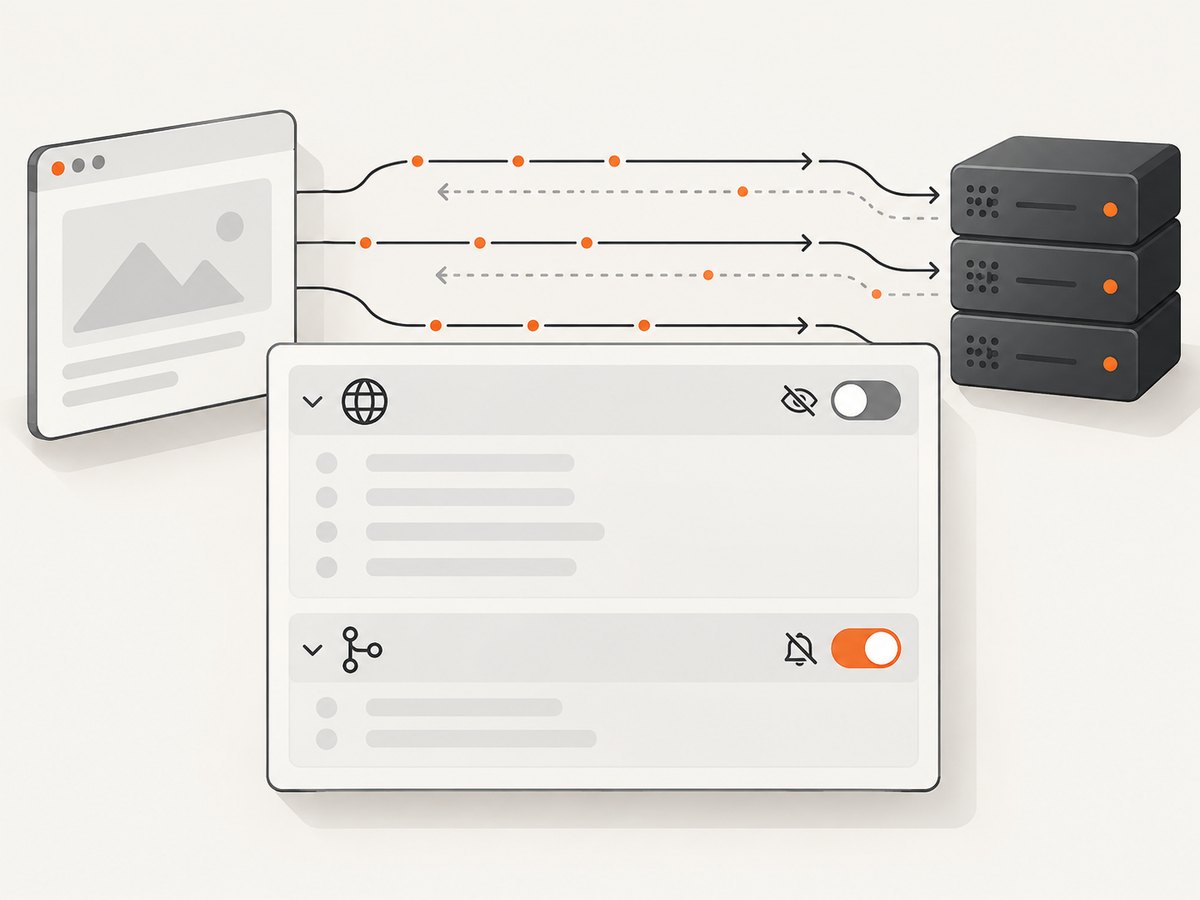
Requests matching cy.intercept() are logged by default. An intercept response can opt out of logging with { log: false }. A broad intercept for XHR and fetch can consequently make many application requests seem to have vanished. Open the Routes panel and check the registered routes and their matching-request counts; verify the HTTP method and URL pattern as well as any logging option. [Cypress cy.intercept() API]
// This matching stub is deliberately hidden in the Command Log
cy.intercept('GET', '/api/catalog', {
  log: false,
  statusCode: 200,
  body: [{ id: 'item-1', name: 'Notebook' }],
})
To restore the entry, remove log: false:
cy.intercept('GET', '/api/catalog', {
  statusCode: 200,
  body: [{ id: 'item-1', name: 'Notebook' }],
}).as('catalog')

cy.visit('/catalog')
cy.wait('@catalog').its('response.statusCode').should('eq', 200)
Also search shared support code and test setup for broad route handlers. A route can match a request even if its method or URL is broader than intended. The Routes panel helps establish whether it matched; a count of zero points toward a pattern mismatch, a request that never ran, or traffic outside the browser interception path.
5. Verify the request in Cypress, not only in DevTools
On Cypress’s legacy network path, browser tooling can report a request before Cypress modifies it. That can make the browser Network panel’s view differ from the request Cypress actually sends. When checking an intercept, verify the outgoing request and response through the Cypress alias after cy.wait(). [Cypress intercept documentation]
cy.intercept('POST', '/api/orders', (req) => {
  req.headers['x-test-mode'] = '1'
}).as('createOrder')

cy.get('[data-testid="submit-order"]').click()
cy.wait('@createOrder').then(({ request, response }) => {
  expect(request.headers).to.have.property('x-test-mode', '1')
  expect(response.statusCode).to.eq(201)
})
This checks the request object Cypress observed at the intercept, plus the response. Use a focused assertion like this when the question is whether an intercept changed a header, body, or URL. Treat the browser panel as a useful view of browser activity, but confirm Cypress-side modifications in Cypress.
6. Turn on Cypress diagnostics when the runner itself is unclear
If the request source, display option, and intercept setup all look correct, use Cypress’s documented runner diagnostics. In the browser DevTools console, set localStorage.debug = 'cypress*', then enable Verbose logs as described in the troubleshooting guide. Reopen or reload the runner if needed for the debug setting to take effect. Cypress also documents CYPRESS_NO_COMMAND_LOG=1 as a way to isolate Command Log performance problems; remember that this disables the very log you are investigating. [Cypress troubleshooting guide]
// Enter in the Cypress runner's browser DevTools console
localStorage.debug = 'cypress*'
Use this after simpler checks because verbose runner logging creates more output. Capture the relevant console messages around a single reproducible request rather than trying to reason from a full test suite’s entire log.
7. A compact debugging checklist
- Only HTTP entries are missing? Enable Show HTTP Requests in the Command Log Options menu.
- Commands are missing too? Check
CYPRESS_NO_COMMAND_LOGand whether Cypress was started with--no-runner-ui. - Is the test calling
cy.request()? Inspect its Command Log command entry and browser console details; don’t expect it in the browser Network panel or a browser intercept. - Is it application XHR or fetch? Check the Routes panel, route match count, method and URL, and any
log: false. - Did Cypress modify the request? Assert against the request after
cy.wait('@alias'). - Is this a CI-only failure? Use the available Cypress run artifacts; Test Replay can expose request details for
cy.request()debugging.
Common errors and fixes
| Symptom | Likely cause | Fix |
|---|---|---|
| Application fetch is absent, but the page works | HTTP request display is hidden | Enable Show HTTP Requests; rerun and inspect. |
| No commands appear in the runner | Command Log disabled or runner UI omitted | Remove CYPRESS_NO_COMMAND_LOG=1 and run with the runner UI. |
cy.intercept() does not catch a cy.request() |
The command executes in Node and bypasses the browser proxy | Assert on the cy.request() result directly; inspect its command details. |
cy.request() is missing in browser DevTools Network |
It is not browser-originated traffic | Click the Cypress command entry; use Test Replay when diagnosing a CI run. |
| One matching route does not appear in the log | log: false is set on its response |
Remove the option if you want the route logged. |
| Intercept alias never receives a request | Route pattern mismatch, request did not run, or traffic came from Node | Check route method/URL and Routes panel count; classify the request origin. |
| Network panel differs from the intercepted request | Browser view may precede Cypress modification on the legacy network path | Inspect the request through cy.wait('@alias') and assert its fields. |
Performance, reliability, and cost
For a local debugging pass, prefer the narrowest evidence that answers the question: enable HTTP entries, inspect one alias, or click one cy.request() command. A broad application-wide intercept can make logs harder to read and can affect what Cypress displays if it suppresses logging. Verbose runner diagnostics are useful when the runner behavior itself is the problem, but should be focused on a reproducible case.
The documented troubleshooting steps use Cypress’s built-in runner, browser DevTools, assertions, and—when available for CI—Test Replay. The research sources do not establish a price or performance benchmark for these debugging paths, so none is needed to choose among them. If you are separately capturing a page screenshot to compare a visual state, keep that task distinct from Cypress request inspection: a screenshot shows rendered output, while the Command Log and intercept assertions show request activity.
Or skip the browser setup
If the debugging task also needs a clean screenshot of the page, ScreenshotNeo can return one image from a single GET request. It is a website screenshot API and MCP server for developers. See the ScreenshotNeo site and API documentation for request options.
curl -G "https://api.screenshotneo.com/v1/shot" \
  -d access_key=YOUR_API_KEY \
  --data-urlencode url=https://stripe.com \
  -o shot.webp
Cookie banners are accepted and removed before capture, along with 60+ known consent platforms, newsletter popups, and chat widgets. Bot checks, blank pages, timeouts, failed loads, and cache hits are not billed; response headers say which page verdict applied and whether it was billed. An MCP server lets AI agents use take_screenshot, get_page_info, and capture_pdf. The Free plan includes 1,000 shots a month with no card; paid plans start at $5 for 3,000 shots. Each step that cleans the page can be turned off.
Create a free ScreenshotNeo account for 1,000 screenshots a month with no card.
FAQ
Why doesn’t cy.intercept() match cy.request() calls?
cy.intercept() observes application traffic that passes through the browser proxy. cy.request() runs in Cypress’s Node process, so it does not pass through that proxy.
Why don’t Cypress cy.request() calls appear in the browser’s Network tab?
The browser Network panel records browser traffic. A cy.request() call originates in Node; inspect its Cypress Command Log entry instead.
Does hiding HTTP requests prevent them from reaching the server?
No. The Open Mode setting hides entries in the display. It does not change test execution, requests, or their availability to assertions and interception tools.
Where can I check a request that was changed by an intercept?
Wait on the route alias and inspect its request object. Cypress notes that browser tooling may show the request before Cypress’s modification on the legacy network path.


