How to Debug Cypress Tests That Pass Locally but Fail in CI
When Cypress passes locally but fails in CI, compare the environments, synchronize on real application state, and capture evidence before changing the test.
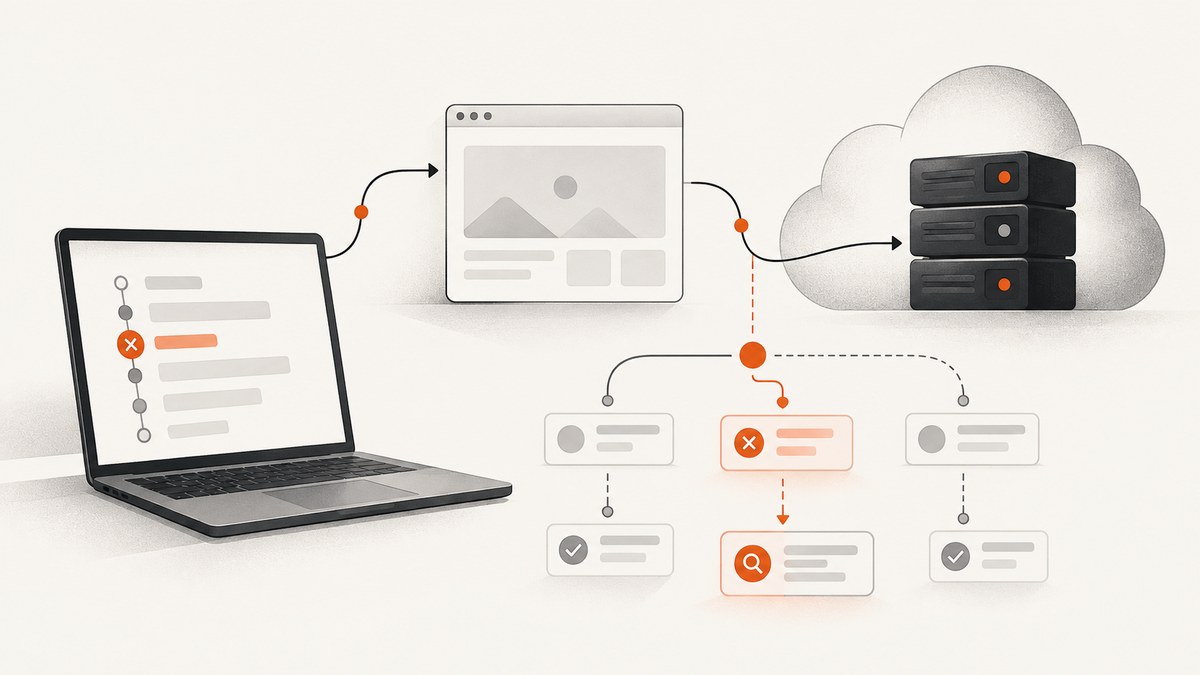
A Cypress test that passes locally but fails in CI usually points to one of two things: the test depends on an environment detail that differs between the two runs, or the CI run has exposed a real application or build failure. Compare the browser, operating system, viewport, timezone, data, feature flags, build artifact, server readiness, timing, and available resources. Then reproduce the CI conditions and gather evidence from the failing run before changing the test.
Start with the same commit and test. Check whether the failure is repeatable or intermittent. Replace guessed waits with assertions and network synchronization, verify the app is ready before Cypress starts, and retain screenshots or video. If your team needs a reliable record of what happened, Cypress Cloud’s recorded runs and Test Replay can provide run history and inspectable DOM, network, console, and JavaScript error details.
1. Classify the failure before debugging
First decide whether you are looking at a likely regression, an environment mismatch, or a flaky test. A failure that repeats at the same assertion on the same commit and data deserves investigation as a possible product regression. A test that alternates between pass and fail is a flake candidate, though it may still be exposing a real race or unstable dependency.
- Record the commit, spec, test name, browser, and the first failed assertion.
- Rerun that exact CI job without changing the commit, if possible.
- Compare the result with recent runs: did this test start failing after a particular commit, or does it vary between attempts?
- Check whether other tests or jobs fail at the same time. A shared failure can point to a service, build, or environment problem.
Keep the original failure details. A retry can help reveal variation, but editing the test before preserving evidence can make the cause harder to see. Recorded-run history is useful here because it can show retries, prior outcomes, artifacts, and commits associated with a change.
2. Confirm the CI command, build, and server readiness
CI must run the intended build, start the application, and wait until its URL is reachable before invoking Cypress. A process that was started is not necessarily ready to receive requests. If Cypress launches early, the test may encounter a connection error, a partial page, or state that varies with machine speed.
Use a readiness wait in the job rather than relying on a fixed pause. Cypress documents patterns using wait-on and concurrently; adapt the commands to your package scripts and CI provider. For example, a shell job can build, start the app, wait for its local URL, and then run Cypress:
npm ci
npm run build
npm run start:test &
npx wait-on http://127.0.0.1:3000
npx cypress run --browser chrome
This assumes your project has a start:test script that serves the built app on port 3000 and that Chrome is installed in the runner. Substitute the actual script, URL, and browser used by your project. If startup runs in a separate job or container, make sure Cypress can reach the service across that boundary; 127.0.0.1 in one container may not identify the app in another.
Check that CI tests the same artifact you intend to ship
Compare the build command, build mode, environment variables, generated assets, and working directory between local and CI runs. A missing variable can change the app’s routes, API endpoint, or feature behavior. A stale artifact can make the test exercise different code than the commit suggests. Print safe, non-secret configuration identifiers in the job log, and verify that the server is serving the just-built output.
3. Match the browser and machine conditions
Local and CI runs often differ in browser and browser version, operating system, viewport, timezone, CPU resources, and environment variables. Cypress also identifies Electron-specific issues and browser updates as possible sources of variation. If CI uses Chrome, reproduce with Chrome locally rather than relying only on the interactive Electron run.
# Run Cypress using Chrome installed on this machine
npx cypress run --browser chrome

# Open the Cypress runner in Chrome
npx cypress open --browser chrome
Use the browser name or path supported by your installed Cypress version and machine. For reproducibility, standardize the CI image and browser version when practical, and record the versions in job output. Evergreen Chrome changes can affect automation, so pin or control the browser image when a moving version makes failures difficult to reproduce.
Also compare the configured viewport and operating system. A responsive layout can expose a real defect at a narrower width; operating-system font rendering can change wrapping and element positions. Timezone, seed data, and feature flags can alter date-sensitive pages or which UI is present. Compare those inputs explicitly instead of assuming “same test” means “same conditions.”
4. Replace timing guesses with state-based synchronization
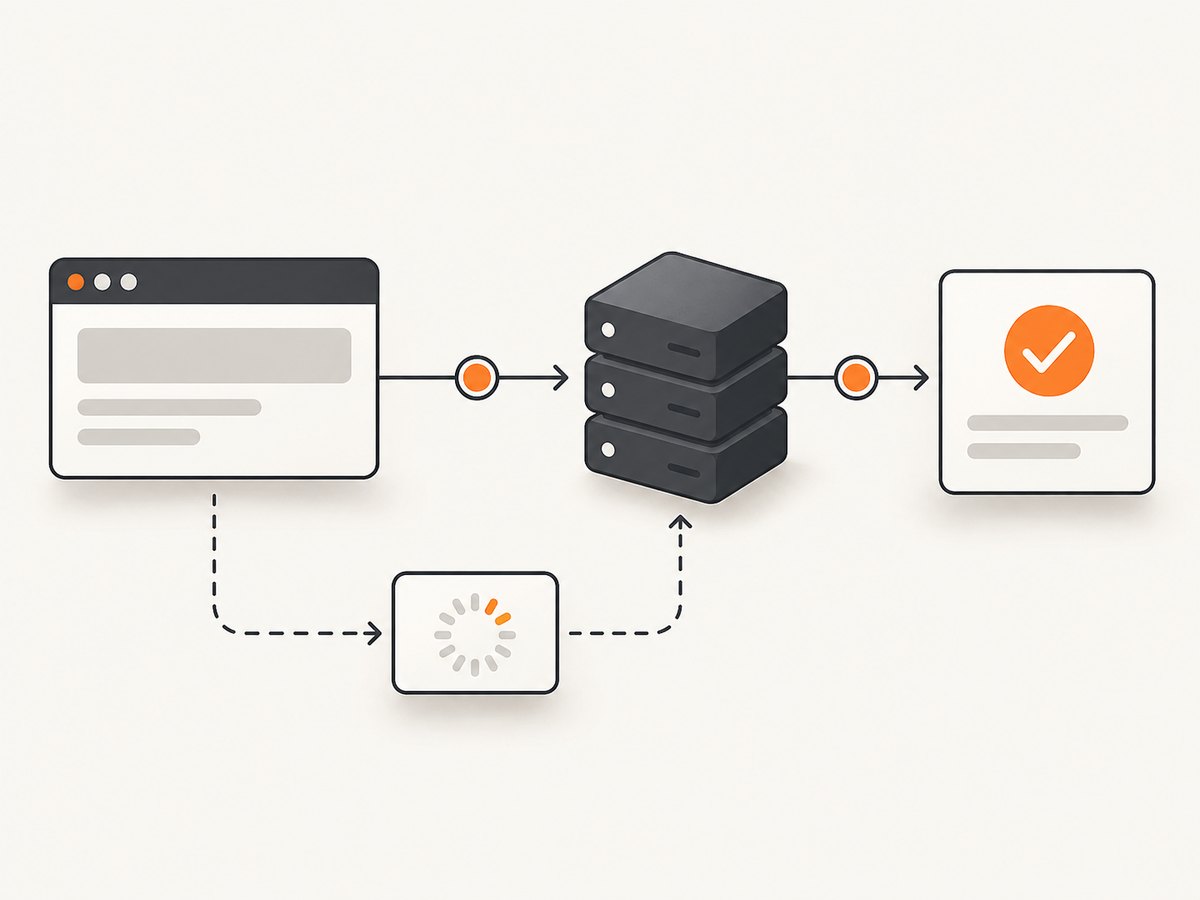
A fixed delay such as cy.wait(2000) assumes the app will finish within an arbitrary interval. That assumption can hold on a fast laptop and fail on a busy runner, or waste time on every successful run. Wait for a specific request or visible application state, then assert the condition required by the next step.
describe('search results', () => {
  it('shows results after searching', () => {
    cy.intercept('GET', '/api/search*').as('search')

    cy.visit('/search')
    cy.get('[data-cy=search-input]').type('cypress{enter}')

    cy.wait('@search')
      .its('response.statusCode')
      .should('eq', 200)

    cy.get('[data-cy=results]').should('be.visible')
    cy.get('[data-cy=result]').should('have.length.greaterThan', 0)
  })
})
Adjust the route pattern and selectors to your app. The test waits for the request the page depends on, checks its response, and then verifies the resulting UI. A successful response alone does not prove the app rendered the right state, so retain the DOM assertion. Conversely, if the UI is driven by a websocket, polling, or client-side work rather than that request, synchronize on the visible state that expresses readiness.
Cypress recommends assertions around actions and network requests before moving to the next assertion. Those checkpoints reduce timing sensitivity and show where the expected behavior first diverged. Avoid adding assertions that merely restate implementation details; assert the user-observable condition needed by the next step.
5. Compare hidden inputs and test data
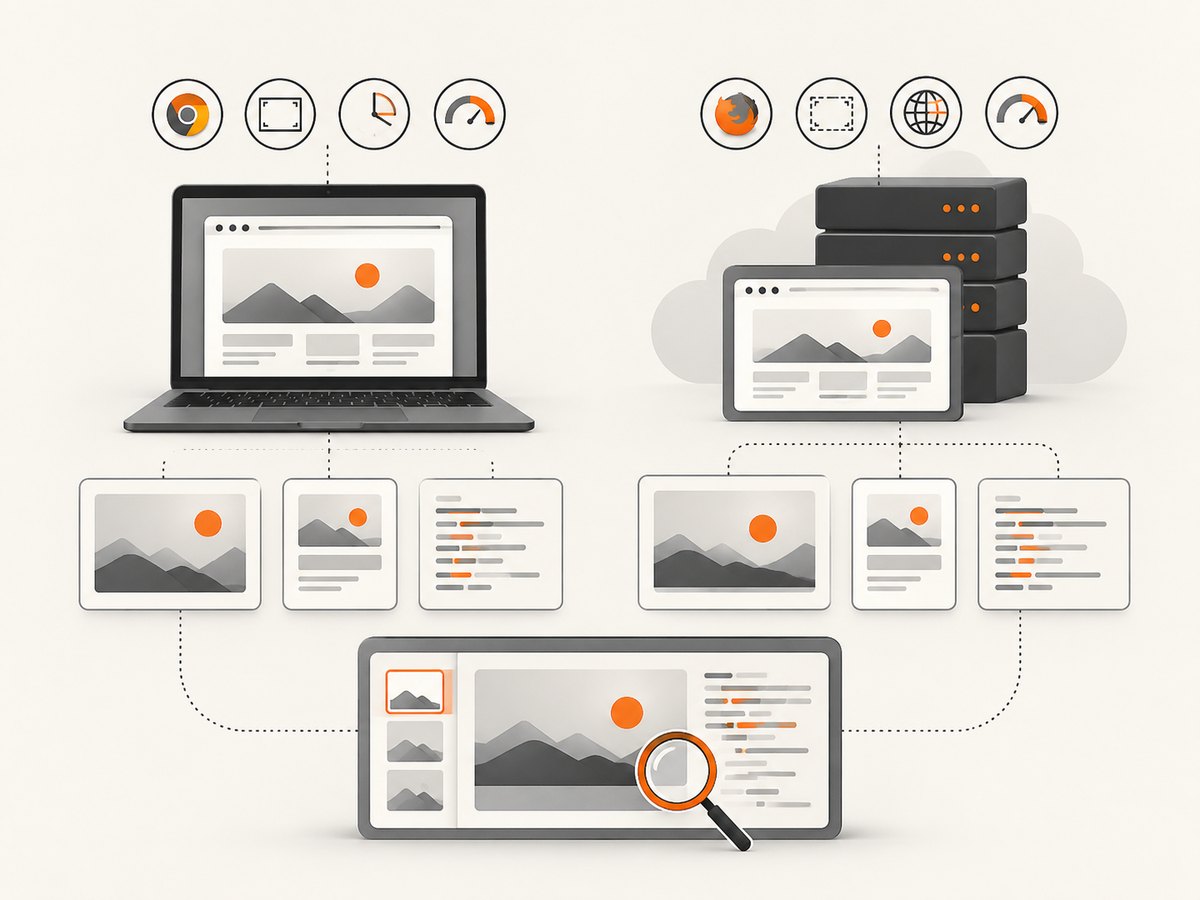
Make a short environment comparison table for a failing test. Capture the values in CI and reproduce the relevant ones locally:
| Input | What to compare | Typical clue |
|---|---|---|
| Browser | Name and version | Failure only in one browser or after an image update |
| Viewport and OS | Configured dimensions and runner platform | Element is covered, clipped, or laid out differently |
| Timezone and locale | Runner settings and app configuration | Date, number, or text expectations differ |
| Seed data | Fixture/database state and reset behavior | Missing, duplicated, or stale records |
| Flags and environment | Feature flags and required variables | Different route, component, or API endpoint |
| Build and server | Build command, artifact, URL, readiness | Old code, failed startup, or unavailable dependency |
| Resources | Runner CPU and memory pressure | Slow commands, frozen video, or dropped frames |
Use deterministic fixtures where possible, and reset state between tests when their outcomes depend on shared data. Check that beforeEach establishes the assumptions the test needs. Don’t put credentials in logs while comparing environment variables; report whether a required variable is present and, where useful, a safe non-secret mode or endpoint identifier.
6. Capture useful evidence from CI
Enable Cypress screenshots and video for the failing run so you can inspect the browser state near the failure. A screenshot provides a point-in-time view; video provides surrounding context, although video can freeze or drop frames under CPU pressure. Store artifacts so they are available after the runner exits.
When using Cypress Cloud, recorded runs add history and artifacts, and Test Replay can expose the DOM, network requests and responses, console logs, and JavaScript errors at points during the CI run. This can help distinguish “the request never completed” from “the request completed but the UI did not update.” Use the narrowest artifact or diagnostic output that answers the question, and avoid exposing secrets in captured pages or logs.
For local diagnostic output, Cypress supports its debug logging through the DEBUG environment variable. The process-profiler stream can also help inspect Cypress CPU and memory usage when the runner appears overloaded. Treat verbose logs as temporary investigation aids: they can be large and may include details that should not be retained indiscriminately.
# Enable Cypress debug output for one run
DEBUG=cypress:* npx cypress run --browser chrome
7. Use retries as a diagnostic signal
Retries are disabled by default. Cypress lets you configure retry counts separately for interactive and run modes, so CI can retry without changing the open-mode behavior. Two configured run-mode retries allow up to three total attempts. A retry that passes after an earlier failure is evidence of variation, not proof that the test is healthy.
// cypress.config.js
const { defineConfig } = require('cypress')

module.exports = defineConfig({
  retries: {
    openMode: 0,
    runMode: 2,
  },
})
Use the retry result to investigate timing, shared state, resource contention, or unstable dependencies. Each retry reruns beforeEach and afterEach, so hooks must tolerate repeated execution and restore state reliably. Retries will not repair a broken build, a missing variable, a failed deployment, or an unavailable service. Keep them from hiding persistent failures by tracking which tests retry and addressing the cause.
8. Troubleshooting common CI-only failures
| Symptom | Likely cause | What to do |
|---|---|---|
| Connection refused on visit | App did not start, or Cypress started before readiness | Check server logs and wait for the actual test URL to respond before running Cypress. |
| Element not found intermittently | Page state or data arrives later than the test assumes | Wait for the relevant request or user-visible state; verify the expected data exists. |
| Element is covered or not actionable | Overlay, responsive layout, animation, or viewport difference | Inspect the CI screenshot and viewport; test the intended layout and dismiss real overlays through the app flow. |
| Works in Electron but not Chrome | Browser-specific behavior or version change | Run locally in the CI browser, compare versions, and isolate browser-specific behavior. |
| Dates or text expectations differ | Timezone, locale, or environment configuration mismatch | Compare runner and app settings; make test inputs and expected formatting explicit. |
| Retry passes, first attempt fails | Race, shared state, unstable service, or runner pressure | Inspect both attempts’ artifacts and determine which prerequisite was missing or delayed. |
| Video freezes or drops frames | Insufficient CPU resources in the container | Check runner load and Cypress process profiling; use DOM/network/error evidence alongside video. |
| CI behavior differs after a commit | Regression, build change, or changed flags/data | Compare the built artifact and inputs, then use the first failing assertion and run history to narrow the change. |
9. Keep the CI suite reliable and affordable
Every arbitrary wait adds elapsed time, while an overly aggressive resource-constrained runner can make the whole suite slower and less stable. Prefer request and state synchronization, remove duplicated setup, and keep fixtures focused. Don’t increase parallelism without checking whether tests share mutable data or overload a dependent service; more workers can increase contention rather than reduce total time.
Capture artifacts for the runs where they have diagnostic value, and check their retention and storage cost in your CI or Cypress Cloud configuration. No single retry count is right for every suite: retries consume runner time and can conceal flake if nobody examines them. Track recurring retry failures and use artifacts to decide whether the fix belongs in the test, app, build, or runner setup.
10. Or skip the browser setup
If you need a rendered page image as part of a debugging workflow, [ScreenshotNeo](https://screenshotneo.com) offers a one-request screenshot API. It does not replace Cypress assertions or reproduce your test runner, but it can capture a page without setting up browser automation. See the [ScreenshotNeo API docs](https://screenshotneo.com/docs/) for request options.
curl -G "https://api.screenshotneo.com/v1/shot" -d access_key=YOUR_API_KEY --data-urlencode url=https://stripe.com -o shot.webpCookie banners, popups, and chat widgets are removed before the shot. Bot checks, blank pages, and failed loads are never billed. An MCP server lets AI agents take screenshots, and 1,000 screenshots a month are free with no card; paid plans start at $5 for 3,000. [Create a free ScreenshotNeo account](https://screenshotneo.com/account/sign-up/).
FAQ
Should I add a longer wait when CI is slower?
Usually, wait for the request or application state the test needs. A longer fixed delay can mask a race and still fail on a slower run.
Does a passing retry mean the bug is fixed?
No. It shows that a later attempt passed. Compare the attempts and investigate the unstable prerequisite or shared state.
Is a CI-only failure always a test problem?
No. The cause may be a product regression, an incorrect build, a missing environment variable, a server startup issue, or a difference in browser, data, or machine resources.
What should I preserve first?
Keep the commit and job details, the first failed assertion, browser and environment information, and the available screenshot, video, or recorded-run evidence.


