How to Debug Headless Browser Automation
Find out why headless browser automation fails by making the session observable, saving replayable evidence, and separating timing, code, browser, and CI problems.
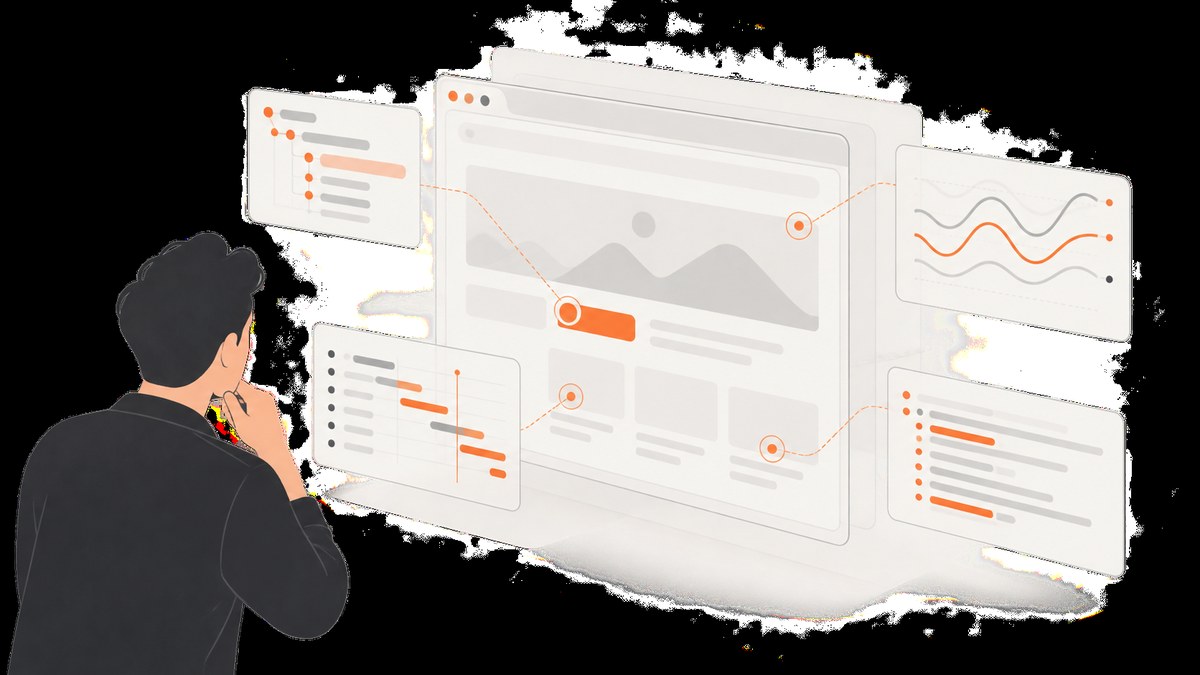
When browser automation fails in headless mode, first make the session observable. Reproduce the failure with the same inputs, inspect the browser at the failing action, save a screenshot and logs, and classify the evidence before changing selectors or adding retries. The cause is usually a page-state or timing issue, test-code issue, browser or driver issue, DevTools-protocol issue, or host-environment difference.
This guide shows how to debug Playwright, Puppeteer, Selenium, and raw headless Chrome. It covers a repeatable workflow, runnable diagnostic examples, CI artifact collection, common failure fixes, and ways to distinguish a flaky test from a browser launch problem.
1. Freeze the failure before changing anything
Debugging gets harder if each run changes the conditions. Record enough information to reproduce the same browser state locally and in CI. Save the exact command and failing action, not just the test name.
- Framework and version, browser version, driver version if applicable, operating system, and container image.
- URL, viewport, locale, timezone, authentication state, and relevant environment variables.
- The exact action that fails and the error text, including whether the browser exited, the target closed, or an assertion timed out.
- Whether the same input fails locally, in CI, in headed mode, and in another supported browser.
Reduce the test to the shortest sequence that still fails. If a page needs authentication or a particular network response, preserve that state in the reproduction. Changing several things at once—selector, timeout, browser flags, and CI image—may make the failure disappear without showing its cause.
2. Make the browser visible
Headless runs hide the rendered browser window, but the page state can still be inspected. A headed run is a diagnostic comparison, not proof that headless and headed environments behave identically. Use the framework’s pause and inspection tools to stop at the failing step and look at the DOM, frames, visibility, and actionability state.
Playwright: Inspector, pause, and API logs
Run a test under the Inspector:
npx playwright test --debugOr add await page.pause() immediately before the failing action, then run the test with the Inspector enabled. The Inspector can show actionability logs and lets you inspect or pick locators. To compare against a visible browser, configure the test to launch headed and optionally slow down operations. Playwright is headless by default.
import { test, expect } from '@playwright/test';

test('submit checkout', async ({ page }) => {
  await page.goto('https://example.com/checkout');
  await page.pause(); // Inspect state immediately before the action.
  await page.getByRole('button', { name: 'Continue' }).click();
  await expect(page.getByText('Order summary')).toBeVisible();
});
For action-level API logs, set DEBUG=pw:api in the environment. Use the output to see what Playwright waited for and which action timed out.
DEBUG=pw:api npx playwright testPlaywright’s official guide covers debugging tests, Inspector use, and trace recording. When a failure is intermittent, record a trace and open it in Trace Viewer so you can inspect the actions and page state around the error.
Puppeteer: headed launch, browser output, and protocol errors
Launch a visible browser when your environment supports a display. Add dumpio: true to forward browser-process output to the Node process, and enable Puppeteer’s debug namespace when investigating protocol activity.
import puppeteer from 'puppeteer';

const browser = await puppeteer.launch({
  headless: false,
  slowMo: 100,
  dumpio: true
});
try {
  const page = await browser.newPage();
  page.on('console', message => console.log('PAGE CONSOLE:', message.type(), message.text()));
  page.on('pageerror', error => console.error('PAGE ERROR:', error));
  page.on('requestfailed', request => console.error('REQUEST FAILED:', request.url(), request.failure()?.errorText));
  await page.goto('https://example.com', { waitUntil: 'domcontentloaded' });
  await page.screenshot({ path: 'debug.png', fullPage: true });
} finally {
  await browser.close();
}
Run with protocol debugging enabled:
NODE_DEBUG="puppeteer:*" node debug.mjsPuppeteer also exposes browser.debugInfo.pendingProtocolErrors, which can help identify commands still pending when a call hangs or a target closes. Consult the official Puppeteer debugging and troubleshooting guides for details.
Selenium: capture browser evidence and raise logging
Selenium’s WebDriver API can capture screenshots. Configure Selenium logging at DEBUG level and write it to a file so driver and command details survive a CI run. A minimal Python example that records the URL, screenshot, and page source when an operation fails:
from selenium import webdriver
from selenium.webdriver.common.by import By
from selenium.webdriver.support.ui import WebDriverWait
from selenium.webdriver.support import expected_conditions as EC

options = webdriver.ChromeOptions()
options.add_argument('--headless')
driver = webdriver.Chrome(options=options)
try:
    driver.get('https://example.com')
    try:
        button = WebDriverWait(driver, 10).until(
            EC.element_to_be_clickable((By.CSS_SELECTOR, 'button.continue'))
        )
        button.click()
    except Exception:
        print('URL at failure:', driver.current_url)
        driver.save_screenshot('failure.png')
        with open('failure.html', 'w', encoding='utf-8') as f:
            f.write(driver.page_source)
        raise
finally:
    driver.quit()
Use the Selenium troubleshooting guide, wait strategies, and logging documentation for the applicable binding and version. Selenium’s documentation calls poor synchronization its most common related error.
Raw Chrome: attach DevTools to a headless session
For headless Chrome itself, launch with an ephemeral remote debugging port and read the WebSocket endpoint from standard output. In a separate headed Chrome window, open chrome://inspect, configure the remote endpoint, and inspect the target. Keep the endpoint and debugging session restricted to a trusted local environment.
chrome --headless --remote-debugging-port=0 https://example.comExact executable names and launch requirements vary by platform and installation. Follow Chrome’s headless documentation for the installed version. Chrome’s developer guide describes remote inspection as a way to investigate an otherwise invisible headless session.
3. Save evidence that another run can explain
A screenshot is useful, but it is only one view of the failure. Capture evidence at the point of failure, before the browser closes or the next action changes the page.
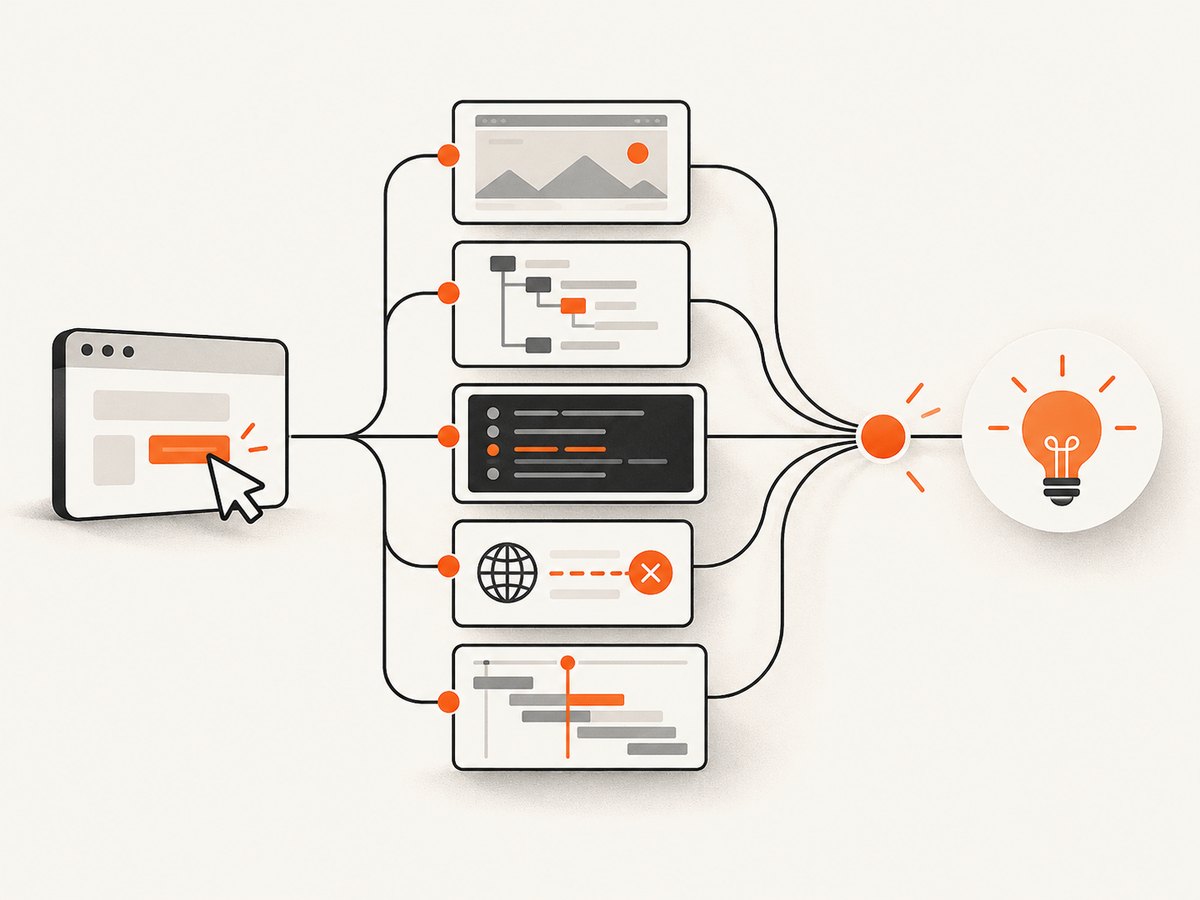
- Screenshot: capture the viewport and, where useful, the full page. This reveals overlays, blank content, unexpected navigation, and layout shifts.
- Page state: record the current URL and HTML or a focused DOM excerpt. Check whether the target is in an iframe or shadow root.
- Browser errors: collect console messages and uncaught page errors.
- Network failures: record failed requests and responses relevant to the page’s content or scripts.
- Trace or protocol details: save a Playwright trace or framework-specific protocol logs for the events around the failed action.
- Launch output: retain browser stdout and stderr, especially if the process fails before the first page action.
In CI, upload these files as job artifacts even when the test fails. Keep logs scoped to the failing test where possible; large traces and full HTML files can contain credentials or personal data, so apply the same access and retention controls as for other test artifacts.
4. Classify the evidence and choose a fix
| Evidence | Likely class | Next check |
|---|---|---|
| Element absent, hidden, disabled, covered, or in another frame | Locator or page state | Inspect DOM, frame, visibility, and actionability at the failure point. |
| Same action succeeds on a slower run or fails while content is changing | Timing or race | Wait for the specific state that permits the action. |
| Browser exits before navigation or first command | Browser process or host | Read launch output; check executable, permissions, sandbox, and resources. |
| Target closes, command hangs, or protocol callbacks remain pending | Protocol or connection | Inspect protocol logs, pending errors, and browser process lifetime. |
| CI fails while a matching local run passes | Environment | Compare versions, fonts, locale, network, proxy, filesystem, and limits. |
| Failure follows one browser/driver combination | Browser or driver | Check compatibility and reproduce in another supported browser. |
5. Fix synchronization without hiding the bug
Automation often reaches an element before the application is ready. A selector can be valid while the element is not attached, visible, enabled, in the expected frame, or within the viewport. Inspect which condition is missing and wait for that condition. Avoid responding to every timeout by raising a global timeout; it can lengthen failures without fixing the race.
Prefer framework actionability checks or an explicit condition wait with a bounded timeout. Selenium’s WebDriverWait example above waits for clickability rather than sleeping for an arbitrary number of seconds. Fixed sleeps can be too short on a slow run and waste time on a fast run. Selenium also warns against mixing implicit and explicit waits because the combined wait behavior can be unpredictable.
Log the condition being awaited and how long it took. If the application never reaches that state, the failure is informative: inspect failed requests, page errors, authentication redirects, and loading indicators instead of retrying the click indefinitely.
6. Isolate browser, driver, and host problems
If the process exits before the test reaches the page, focus on launch conditions rather than selectors. Verify that the browser executable exists, the driver is compatible with the browser, the process can access its profile and temporary directories, and the container has enough shared memory and process capacity. Capture startup stdout and stderr.
In Linux containers, sandbox configuration and permissions can prevent Chrome from starting. Puppeteer’s troubleshooting documentation describes the “No usable sandbox!” failure and launch conflicts caused by extension policies. Treat --no-sandbox as an emergency, environment-specific workaround only when the execution boundary is trusted and the security effect is understood; prefer fixing the container’s sandbox support.
Puppeteer documents that chrome-headless-shell needs --enable-gpu for GPU acceleration. Check the exact browser build and feature involved before adding flags: a flag for one build or environment may not apply to another. Also inspect fonts, certificates, proxy and DNS settings, network policy, and display assumptions in CI. Compare the smallest failing action across supported browsers to help separate application/test defects from a particular driver.
7. Keep failures diagnosable in CI
When local runs pass and CI runs fail, compare the full environment rather than assuming “headless” is the difference. Record browser and framework versions, container image, viewport, locale, timezone, fonts, environment variables, proxy and DNS configuration, network policy, and memory/process limits.
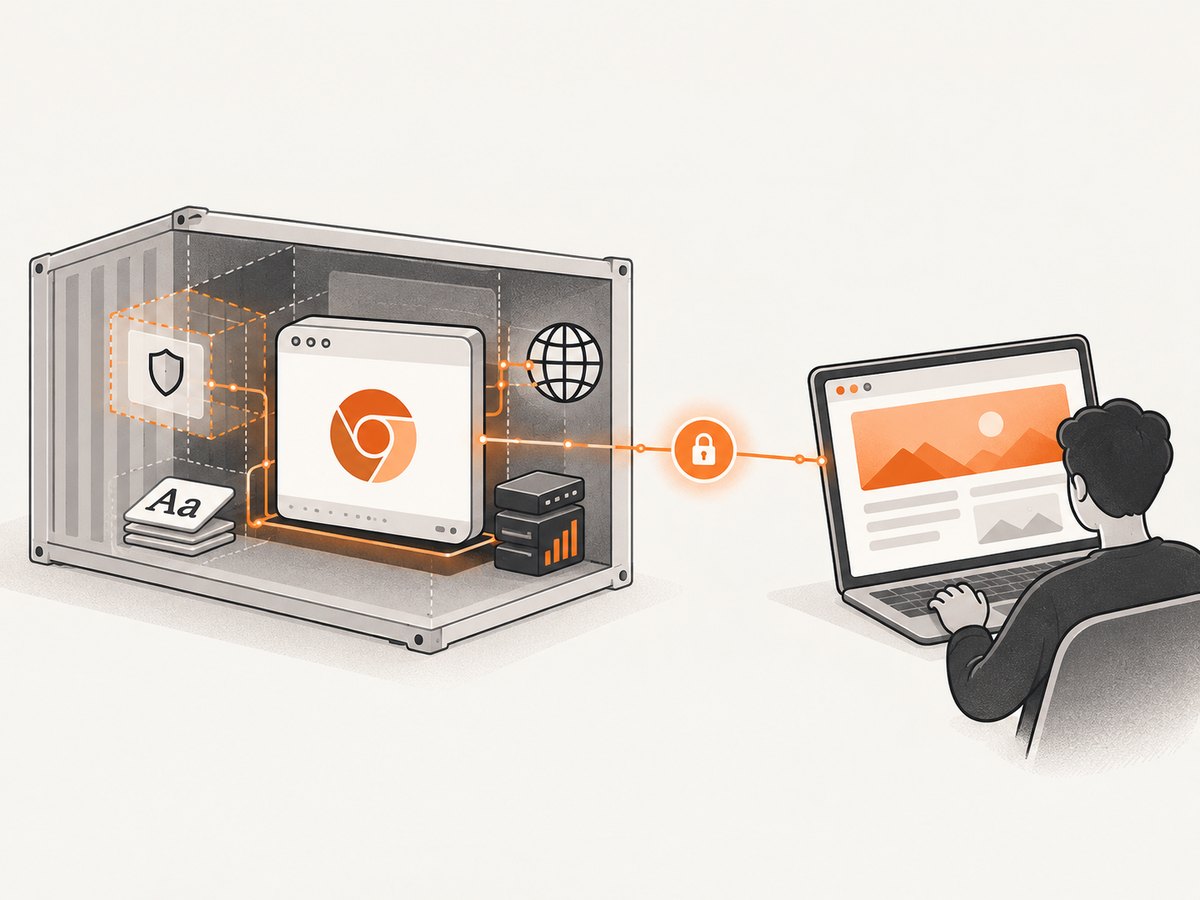
- Preserve screenshot, trace, console output, network failures, and browser stderr on failure.
- Run the same command and input locally when possible, including the same browser version.
- Use a headed diagnostic job if a display server is available, then compare its state with the headless failure.
- Check for environment-specific auth, rate limits, bot checks, unavailable resources, and missing certificates.
- Make retries a last diagnostic aid, not a substitute for captured evidence or a deterministic wait.
8. Performance, reliability, and cost
Diagnostic runs are slower by design when they collect traces, screenshots, verbose logs, or slow-motion playback. Enable the detailed capture on retries or failed tests if the framework supports it, and retain ordinary lightweight logs on passing runs. For high-volume suites, limit trace retention and artifact size to the cases that need investigation.
Reliability comes from reproducible inputs and condition-based synchronization. Pin compatible browser and driver versions in CI, use the same viewport and locale, and wait for the application state your next action depends on. Broad retries may reduce visible failures while concealing real regressions; preserve the first failure’s artifacts so a later passing attempt does not erase useful evidence.
Cost is mainly engineering and CI time: repeated full-suite reruns, unnecessary fixed sleeps, and huge retained artifacts all add up. Reduce the reproduction, collect focused evidence, and run expensive diagnostic modes only where they answer a specific question.
9. Get a page image without maintaining a browser session
When the task is to inspect or save a page image rather than automate interactions, a screenshot API can avoid browser installation, driver matching, and CI display setup. ScreenshotNeo is a website screenshot API and MCP server from Yorker Media: one GET request returns a PNG, JPEG, WebP, or PDF. It accepts cookie and consent banners and removes more than 60 known consent platforms, newsletter popups, and chat widgets before capture; each step can be turned off. Only clean shots are billed: bot checks or CAPTCHAs, blank pages, timeouts, failed loads, and cache hits cost nothing, and responses identify the page verdict and billing status in headers.
Or skip the browser setup
For a straightforward page capture, make one request. See the ScreenshotNeo API documentation for supported parameters.
curl -G "https://api.screenshotneo.com/v1/shot" -d access_key=YOUR_API_KEY --data-urlencode url=https://stripe.com -o shot.webpimport requests
r = requests.get("https://api.screenshotneo.com/v1/shot", params={"access_key": "YOUR_API_KEY", "url": "https://stripe.com"}, timeout=90)
open("shot.webp", "wb").write(r.content)const q = new URLSearchParams({ access_key: 'YOUR_API_KEY', url: 'https://stripe.com' });
const res = await fetch(`https://api.screenshotneo.com/v1/shot?${q}`);Cookie banners, popups, and chat widgets are removed before the shot. Bot checks, blank pages, and failed loads are never billed. An MCP server lets Claude, Cursor, and other MCP clients use screenshot tools. The free plan includes 1,000 screenshots a month with no card; paid plans start at $5 for 3,000. Create a free ScreenshotNeo account to try it.
10. Troubleshooting: common errors and fixes
| Symptom | Likely cause | Fix |
|---|---|---|
| Click or locator times out | Element is absent, hidden, disabled, covered, or in a different frame. | Pause at the action, inspect actionability and frame context, then wait for the required visible/enabled state. |
| It passes with a sleep added | A race or incomplete page-state wait. | Replace the sleep with a bounded wait for the exact condition; inspect why that condition is late. |
| Browser reports “No usable sandbox!” | Linux sandbox support or permissions are missing. | Fix the container’s sandbox configuration. Use --no-sandbox only as a considered emergency workaround in a trusted boundary. |
| Browser exits before the first action | Executable, permissions, extension policy, resources, or launch arguments. | Retain launch output, verify browser/driver compatibility, permissions, shared memory, process limits, and the smallest launch command. |
| Target closes or protocol call hangs | Browser process exited, target was closed, or protocol callback is pending. | Inspect browser logs and Puppeteer pending protocol errors; check the process lifetime and remote debugging connection. |
| CI fails but local passes | Different browser build, fonts, locale, certificates, proxy/DNS, auth, or resource limits. | Compare environment facts and preserve CI screenshots, traces, console and stderr output. |
| Screenshot is blank or incomplete | Navigation was considered complete before app content rendered, or requests failed. | Inspect URL, DOM, console and network evidence; wait for the app’s meaningful ready state rather than assuming navigation completion is enough. |
11. Short FAQ
Why does headless fail when headed mode works?
The environments may differ in timing, fonts, display assumptions, browser build, resource limits, or network access. Compare state and environment values, then inspect the headless failure’s evidence.
How can I see what a headless browser is doing?
Use Playwright Inspector or Trace Viewer, Puppeteer browser and protocol logs, Selenium logging and screenshots, or attach Chrome DevTools to a remote debugging endpoint.
Should I add retries?
Retries can help reveal intermittency, but they do not identify its cause. Save the first attempt’s artifacts and fix the missing condition or environment difference.
What should I save from a failed CI run?
At minimum, the screenshot, current URL, console/page errors, failed requests, browser launch output, exact command, and a trace where available.
Do I need headed mode to debug?
No. Headed mode is one useful comparison. Inspector tools, traces, screenshots, and protocol logs can expose headless state without treating the visible run as identical to CI.