How to Debug PhantomJS Scripts with a GUI
Use PhantomJS’s remote Web Inspector to pause scripts, set breakpoints, debug page JavaScript, and diagnose legacy runtime issues.
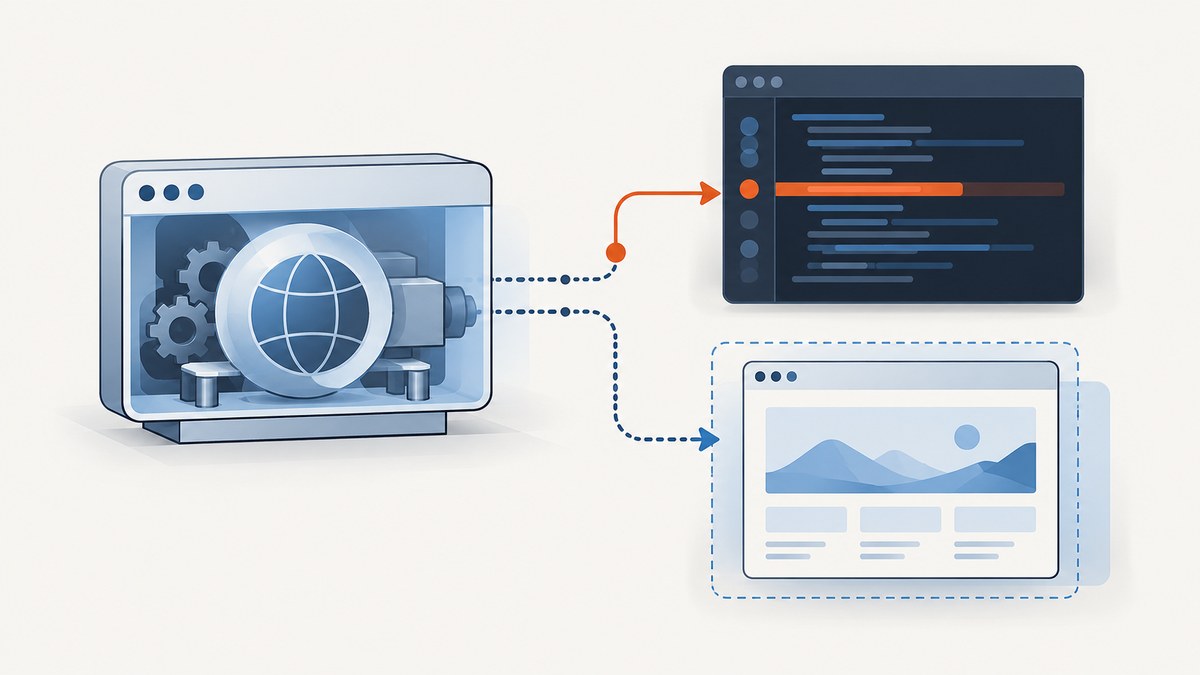
Yes, PhantomJS scripts can be debugged with a graphical interface. PhantomJS stays headless, while a separate WebKit-based browser opens its remote Web Inspector. You start PhantomJS with a debugging port, open the inspector locally, choose the script target, set breakpoints, and run the paused script from the Console.
This is a documented legacy workflow. PhantomJS’s project site says, “Important: PhantomJS development is suspended until further notice.” The remote debugger was also described as Linux-only when introduced, and the reviewed documentation does not guarantee compatibility with current Chrome, Chromium, Safari, operating systems, or PhantomJS builds. Keep the endpoint local while developing.
Quick answer: start PhantomJS’s GUI debugger
- Save your automation as
test.js. - Start PhantomJS with a local remote-debugger port:
phantomjs --remote-debugger-port=9000 test.js- Open
http://127.0.0.1:9000in Safari, Chrome, or Chromium on the same machine. - Choose the inspector target for your script. It may appear as
about:blank. - Open the Scripts tab, select the script URL, and click a line number to set a breakpoint.
- Open the inspector Console and run:
__run()The script starts and pauses when it reaches the breakpoint. To start immediately without typing __run(), add the autorun flag:
phantomjs --remote-debugger-port=9000 --remote-debugger-autorun=yes test.jsThese steps follow PhantomJS’s official troubleshooting guide (PhantomJS troubleshooting).
What the remote inspector actually debugs
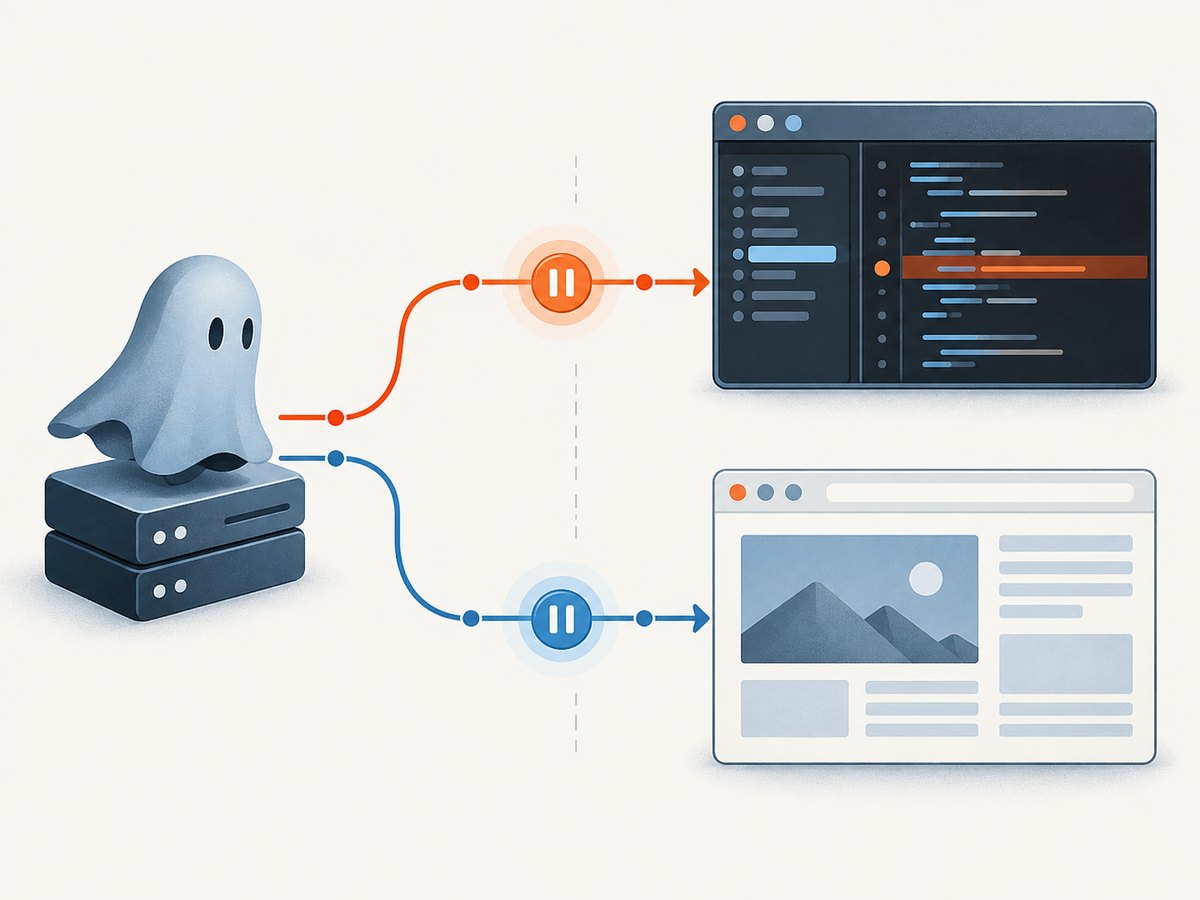
There are two JavaScript worlds in a PhantomJS run:
| Context | What it contains | Inspector target |
|---|---|---|
| PhantomJS script | Your automation code: creating pages, calling page.open, evaluating functions, writing files, and deciding when to exit. |
The script target shown by the remote-debugger portal. |
| Page JavaScript | Code running inside the website loaded by page.open. |
A separate page target, often listed beside the script target. |
A breakpoint in your PhantomJS file cannot directly pause JavaScript inside the website. Page code needs its own inspector target. This separation explains why a breakpoint can appear correct but never fire: you may be looking at the wrong context.
Complete working example
Create test.js:
var page = require('webpage').create();
var system = require('system');

page.onConsoleMessage = function (message) {
  console.log('[page]', message);
};

page.onResourceRequested = function (request) {
  console.log('request:', request.url);
};

page.onResourceError = function (error) {
  console.log('resource error:', error.errorString, error.url);
};

page.open('https://example.com', function (status) {
  debugger; // Set a breakpoint here or use the inspector's line breakpoint.

  if (status !== 'success') {
    console.log('Open failed:', status);
    phantom.exit(1);
    return;
  }

  var title = page.evaluate(function () {
    return document.title;
  });

  console.log('Title:', title);
  phantom.exit();
});
Run it with the debugger:
phantomjs --remote-debugger-port=9000 test.jsOpen http://127.0.0.1:9000, select the script target, and run __run(). When execution stops, inspect local variables in the Scope panel and use the Console to evaluate expressions in the paused script context.
Debugging JavaScript inside the loaded page
Use two debugger; statements and two inspector tabs when you need to move from automation code into page code. The official example uses page.evaluateAsync; the same principle applies to synchronous evaluation.
var page = require('webpage').create();

page.open('https://example.com', function (status) {
  debugger; // Inspector 1: PhantomJS script context

  page.evaluateAsync(function () {
    debugger; // Inspector 2: page context
    var heading = document.querySelector('h1');
    console.log(heading ? heading.textContent : 'No heading');
  });

  phantom.exit();
});- Start PhantomJS with
--remote-debugger-port=9000. - Open the first inspector target and run
__run(). - When the first
debugger;pauses, open a second portal entry for the page target in another inspector tab. - Continue execution in Inspector 1.
- The page target pauses at the second
debugger;; inspect DOM values and page-local variables there.
The two tabs matter because the script and page run in separate debugging targets. Continuing the first context triggers the pause in the second.
Breakpoints and useful inspector controls
- Line breakpoint: click a line number in the Scripts panel. Execution pauses before that line runs.
debugger;statement: place it in code when you need a reliable pause at a specific point.- Exception breakpoints: if the embedded inspector exposes them, enable pauses on thrown exceptions. Older PhantomJS inspectors may not provide every modern WebKit option.
- Continue: resumes until the next breakpoint.
- Step over: executes the current line without entering a called function.
- Step into: enters a called function.
- Step out: finishes the current function and returns to its caller.
- Console evaluation: inspect variables or call functions while paused. Use the Console belonging to the selected target.
WebKit documentation describes line, debugger-statement, and exception breakpoints, but PhantomJS embeds an older WebKit inspector. Treat feature availability as build-dependent (WebKit Web Inspector documentation).
Remote debugger options and safe defaults
| Option | Example | Use |
|---|---|---|
| Debugger port | --remote-debugger-port=9000 |
Opens the inspector portal on the chosen port. |
| Autorun | --remote-debugger-autorun=yes |
Starts execution immediately instead of waiting for __run(). |
| Script path | test.js |
The PhantomJS program to inspect. |
Choose an unused port if 9000 is occupied. The documentation describes a loopback URL, so use 127.0.0.1 and avoid exposing the debugger to a shared network. The sources do not define an authentication layer or a secure remote deployment mode.
When the inspector portal is blank
If the portal loads but the target link is empty, use the documented direct inspector URL:
http://127.0.0.1:9000//webkit/inspector/inspector.html?page=1Replace 9000 if you selected another port. If that page also fails, check the following:
- PhantomJS is still running in the terminal.
- The port is not already used by another process.
- You opened the URL on the same machine as PhantomJS.
- The browser has not blocked the legacy inspector resources.
- Your PhantomJS build includes remote debugging support.
Common errors and fixes
| Symptom | Likely cause | Fix |
|---|---|---|
__run is not defined |
You are in the wrong Console or the script target has not loaded. | Select the script inspector target, reload the portal, and run __run() there. |
| No breakpoint hit | The target is page code while the breakpoint is in the PhantomJS script, or source mapping points to another file. | Open the matching target and verify the script URL in the Scripts panel. |
| Page breakpoint never pauses | Only the script inspector is open, or execution has not continued from the first context. | Open a second inspector for the page target and continue Inspector 1. |
| Port already in use | Another process owns port 9000. | Choose another local port, such as 9010, and use that port in the browser URL. |
| Blank target list | Legacy inspector incompatibility, a stopped process, or an incorrect host. | Confirm the process, try the direct inspector URL, and use a browser version that can load the embedded WebKit inspector. |
page.open returns failure |
DNS, TLS, network, or page-load problems. | Log page.onResourceRequested and page.onResourceError; inspect the requested URLs and TLS errors. |
| PhantomJS exits too soon | phantom.exit() runs before an asynchronous callback finishes. |
Move the exit call into the final callback while debugging. |
| Old syntax or API errors | PhantomJS uses an older JavaScript engine and QtWebKit. | Check syntax supported by your PhantomJS version and isolate unsupported page features. |
Network and page-load diagnosis
A debugger pause does not explain a failed navigation by itself. Add request logging before page.open:
page.onResourceRequested = function (request) {
  console.log('REQUEST', request.method, request.url);
};

page.onResourceReceived = function (response) {
  if (response.stage === 'end') {
    console.log('RESPONSE', response.status, response.url);
  }
};

page.onResourceError = function (error) {
  console.log('ERROR', error.errorCode, error.errorString, error.url);
};
The PhantomJS troubleshooting documentation recommends this approach for network and TLS investigation. Compare the failing URL with a working URL, look for redirects or certificate errors, and verify that the page does not require browser capabilities unavailable in QtWebKit.
PhantomJS version and platform limits
Remote debugging was documented as Linux-only in the 1.5 release notes. That is a historical support statement, not a promise that every later binary behaves the same way. The FAQ also says PhantomJS 1.4 and earlier required an X server, while 1.5 and later were pure headless and did not require X11 or Xvfb. That statement concerns running PhantomJS; the separate inspector UI still needs a graphical browser.
Because development is suspended, plan for compatibility problems when a current browser rejects the old inspector protocol. Pin a known working development environment if this workflow is essential, and keep production automation separate from an interactive debugger.
REPL versus the GUI inspector
PhantomJS’s interactive mode, available since version 1.5, evaluates lines immediately. It is useful for checking a selector, printing a value, or trying a short API call:
phantomjsThe REPL is not a replacement for breakpoints. Use it for small experiments; use the remote inspector when you need call-stack navigation, variable inspection, or a pause inside asynchronous control flow (PhantomJS REPL documentation).
Or skip the browser setup
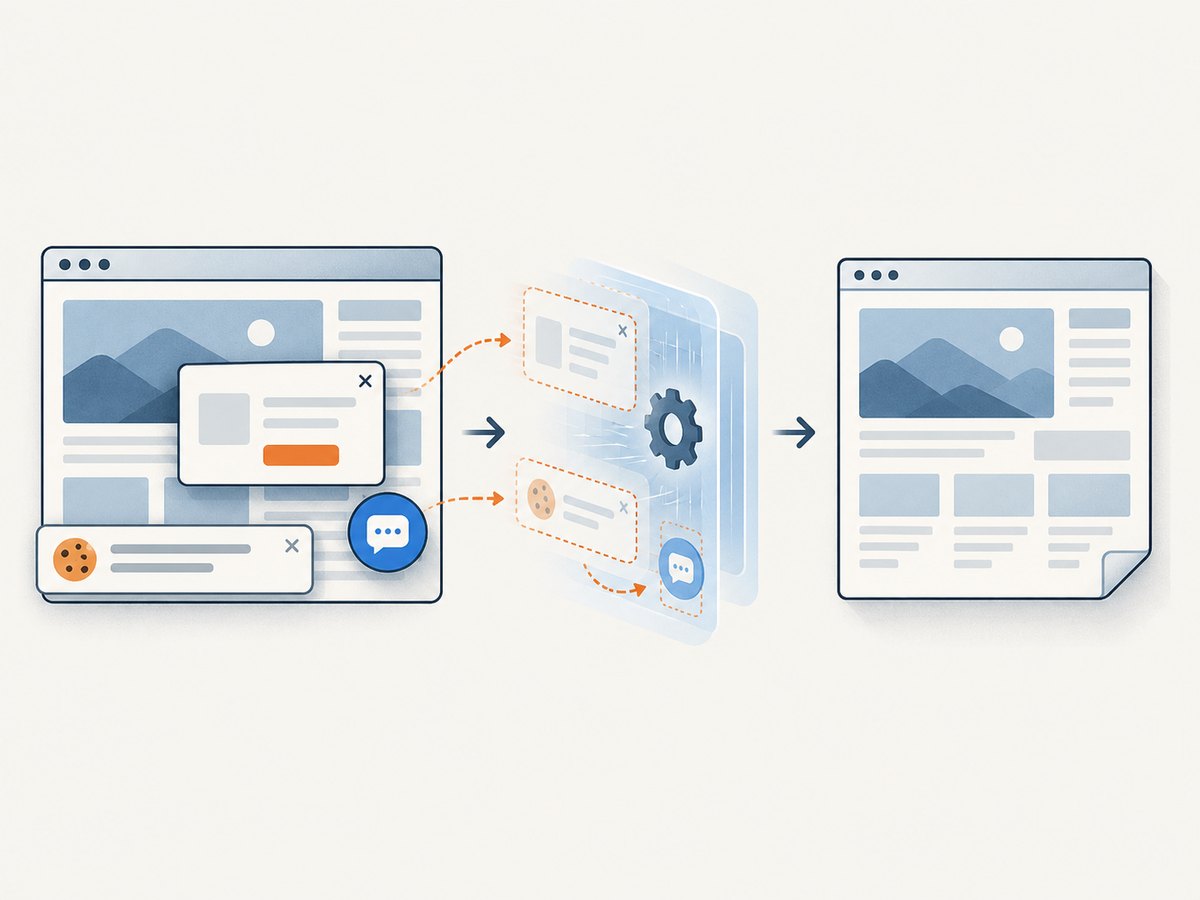
If your goal is to capture a page while diagnosing a rendering problem, ScreenshotNeo provides a hosted screenshot API and MCP server. It removes cookie and consent banners, newsletter popups, and chat widgets before capture. Bot checks, blank pages, timeouts, failed loads, and cache hits are not billed, and each response reports the result through X-Page-Verdict and X-Billed headers. AI agents can use the MCP tools take_screenshot, get_page_info, and capture_pdf.
One request returns PNG, JPEG, WebP, or PDF:
curl -G "https://api.screenshotneo.com/v1/shot" \
  -d access_key=YOUR_API_KEY \
  --data-urlencode url=https://stripe.com \
  -o shot.webp
Python:
import requests

r = requests.get(
    "https://api.screenshotneo.com/v1/shot",
    params={"access_key": "YOUR_API_KEY", "url": "https://stripe.com"},
    timeout=90,
)
r.raise_for_status()
open("shot.webp", "wb").write(r.content)
Node.js:
const q = new URLSearchParams({
  access_key: 'YOUR_API_KEY',
  url: 'https://stripe.com'
});
const res = await fetch(`https://api.screenshotneo.com/v1/shot?${q}`);
if (!res.ok) throw new Error(`HTTP ${res.status}`);
const data = Buffer.from(await res.arrayBuffer());
require('fs').writeFileSync('shot.webp', data);
See the ScreenshotNeo API documentation for parameters. It supports full-page and element captures, lazy-image loading, dark mode, device presets, custom viewport and retina scale, PDF paper settings, custom CSS and JavaScript, clicks, waits, hidden selectors, request blocking, headers, cookies, user agents, authorization, timezone, geolocation, transparent backgrounds, resizing, caching, signed links, asynchronous jobs, webhooks, bulk capture, usage data, and an OpenAPI specification.
The Free plan includes 1,000 screenshots each month with no card. Paid plans start at $5 for 3,000 shots; every feature is available on every plan. Create a free ScreenshotNeo account.
Performance, reliability, and cost notes
- Keep debugging local: the inspector adds an interactive pause and is unsuitable for unattended jobs.
- Use autorun for repeatable reproductions: it removes one manual Console step, while manual
__run()is better when you want to inspect startup state first. - Capture request logs selectively: logging every resource can produce large output on pages with many assets.
- Expect legacy rendering differences: QtWebKit may not match current browsers, especially for modern JavaScript, TLS, and layout features.
- For ScreenshotNeo costs: only clean shots are billed; failed loads, blank pages, bot checks, timeouts, and cache hits are free. Choose a cache TTL when repeated captures are acceptable.
Checklist for a reproducible debugging session
- Pin the PhantomJS binary and record its version.
- Use a free local port and bind your workflow to
127.0.0.1. - Add a breakpoint before navigation and another inside page evaluation when needed.
- Open the correct target: script and page contexts are separate.
- Record
page.openstatus, resource errors, and the final URL. - Remove
debugger;statements and disable the remote port in unattended runs.
FAQ
Can I use Chrome DevTools directly with PhantomJS?
You can use a WebKit-based browser to open PhantomJS’s remote inspector endpoint. The workflow depends on the older inspector protocol documented by PhantomJS, so current Chrome or Chromium compatibility is not guaranteed.
Does PhantomJS need a desktop environment?
The PhantomJS process is headless. The separate inspector browser needs a graphical environment. PhantomJS 1.5 and later did not require X11 or Xvfb merely to run the browser.
Why are there two page entries?
One target represents your PhantomJS automation script and another represents JavaScript running inside the loaded website. Debug each in its own inspector.
Is the remote debugger suitable for production?
No. It is an interactive development endpoint. Keep it local, remove debugging flags from unattended commands, and use structured logging for production diagnosis.
What if the site only needs a screenshot?
Use ScreenshotNeo’s API or MCP server to capture the page without maintaining a PhantomJS inspector session. Its cleaning and billing rules are described above.


