How to Debug Puppeteer and Fix Common Issues
Debug Puppeteer by finding whether the failure is in Node.js, page code, or Chrome. Use this workflow to diagnose launch errors, timeouts, and stalled interactions.
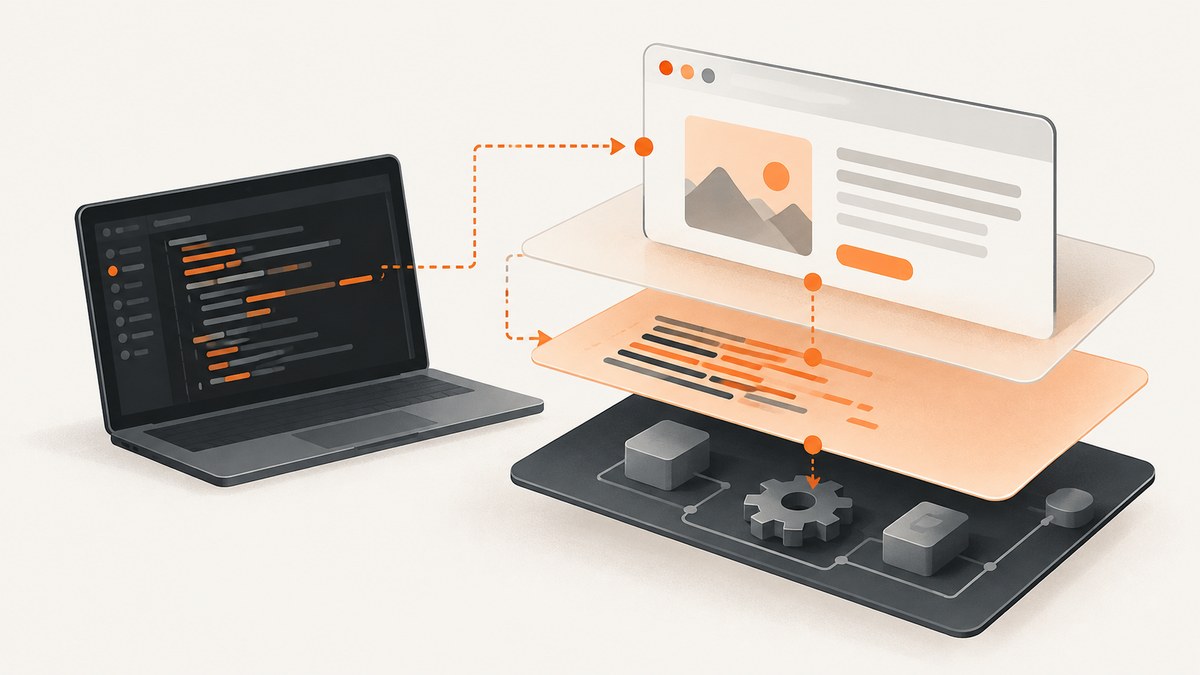
Puppeteer problems usually come from one of three places: your Node.js code, JavaScript running in the page, or the browser process and its environment. Start by making the failure visible: launch Chrome in headful mode, slow operations with slowMo, and capture page console output. Then use the evidence to choose a narrower tool, such as Node’s inspector, browser DevTools, protocol logging, or browser process output.
This guide covers a practical debugging workflow, complete examples, launch failures, selector and action timeouts, and fixes for common environment problems. Puppeteer’s own guide notes that no single debugging method covers every issue because Puppeteer touches many browser components. Puppeteer debugging guide
1. Identify which layer is failing
Before changing timeouts or launch flags, classify the symptom. A Node exception with a useful stack trace points toward your script. A blank page, JavaScript exception, or unexpected DOM state points toward page execution. A browser crash, missing executable, or launch timeout points toward Chrome or the deployment environment. Some failures cross layers: a page script may wait forever because a request never finishes, while the Node code only reports a navigation timeout.
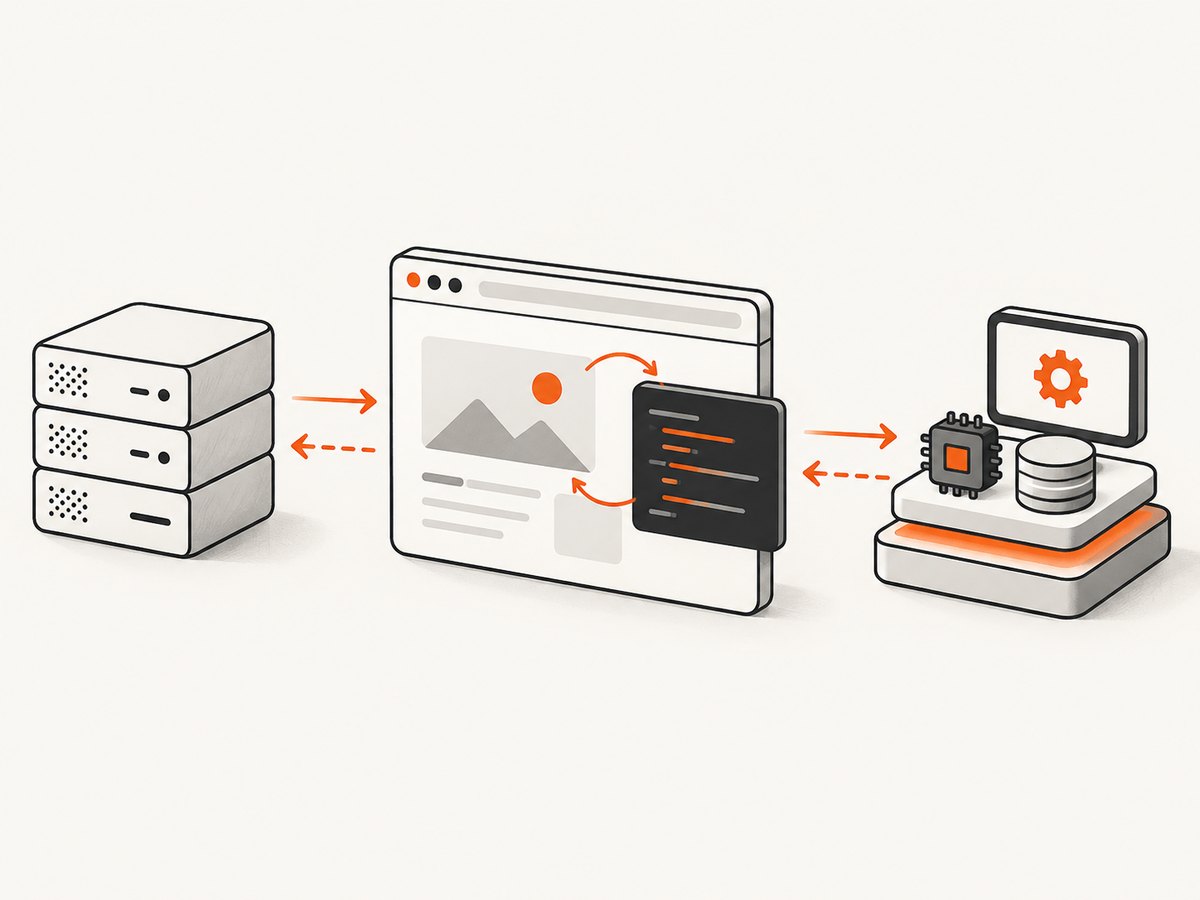
| Symptom | First place to inspect | Useful evidence |
|---|---|---|
| Script throws before or after a Puppeteer call | Node.js | Stack trace, Node inspector, explicit error logging |
| Page looks wrong or never reaches the expected state | Page JavaScript and DOM | Visible browser, page console, DevTools |
| Chrome cannot start, exits, or crashes | Browser process and host | dumpio, launch configuration, permissions and dependencies |
| Protocol operation stalls unexpectedly | Puppeteer and Chrome communication | NODE_DEBUG, pending protocol errors |
Change one diagnostic setting at a time. If several settings change together, it becomes harder to tell which one exposed or altered the failure.
2. Reproduce the issue with a visible, slower browser
Headless mode is convenient for automation, but it hides the browser’s visual state. Temporarily set headless: false and add slowMo to watch navigation and interactions happen. This is a quick way to catch a wrong URL, a consent overlay, a selector that points somewhere unexpected, or a click that occurs before the page is ready.
import puppeteer from 'puppeteer';

const browser = await puppeteer.launch({
  headless: false,
  slowMo: 100,
  timeout: 30_000,
});

try {
  const page = await browser.newPage();
  page.on('console', message => {
    console.log(`[page:${message.type()}]`, message.text());
  });
  page.on('pageerror', error => {
    console.error('[page:error]', error);
  });

  await page.goto('https://example.com', { waitUntil: 'domcontentloaded' });
  console.log('Title:', await page.title());
} finally {
  await browser.close();
}
Save this as debug.mjs and run it with node debug.mjs in a project where Puppeteer is installed. The example uses the current ES module import form. If your project uses CommonJS, replace the import with const puppeteer = require('puppeteer'); and run it in a CommonJS file.
Close the browser in a finally block so an exception does not leave a Chrome process running. For production, restore headless mode after collecting evidence; visible mode is a diagnostic aid, and it may not be available in a server without a display.
3. Capture page-side and browser-side errors
Page console.log output does not automatically appear in the Node process. Attach a console event listener to forward it, and listen for pageerror to capture uncaught page exceptions. Register listeners before navigation so early messages are not missed.
page.on('console', message => {
  console.log(`PAGE ${message.type()}: ${message.text()}`);
});
page.on('pageerror', error => {
  console.error('Uncaught page exception:', error.stack || error);
});
page.on('requestfailed', request => {
  console.error('Request failed:', request.url(), request.failure()?.errorText);
});

await page.goto('https://example.com', { waitUntil: 'domcontentloaded' });
Use browser DevTools when the error is inside client-side JavaScript. Enable DevTools on launch, then add a debugger statement in the browser code at the point where execution should pause. For server-side code, start Node with --inspect-brk and put a debugger statement in the script:
node --inspect-brk debug.mjsNode’s inspector pauses at startup so you can attach a debugger before execution continues. Use a visible browser at the same time if you need to correlate a server-side step with what Chrome is showing.
4. Turn on deeper protocol and process diagnostics
If normal logs do not show where an operation stalled, inspect communication between Puppeteer and Chrome. Puppeteer documents the NODE_DEBUG="puppeteer:*" environment variable for DevTools protocol traffic. It can produce a large amount of output, so reproduce the smallest failing case and disable it afterward. Protocol logs may contain sensitive page or request information; protect them like application logs.
# macOS or Linux
NODE_DEBUG="puppeteer:*" node debug.mjs

# PowerShell
$env:NODE_DEBUG = "puppeteer:*"
node .\debug.mjs
For pending protocol-call errors and their stack traces, inspect browser.debugInfo.pendingProtocolErrors while diagnosing the browser. The exact usefulness depends on the failure and Puppeteer version; treat it as supplemental evidence rather than a replacement for the original error and stack trace.
When Chrome fails to launch or crashes, use dumpio: true to send the browser process’s stdout and stderr to Node’s standard streams:
const browser = await puppeteer.launch({
  dumpio: true,
  timeout: 30_000,
});
Choose the least intrusive diagnostic that answers the question: visual state for rendering and interaction issues, page events for client-side errors, Node’s inspector for script flow, protocol traffic for stalled browser communication, and dumpio for process failures.
5. Fix browser launch failures
When puppeteer.launch() fails, verify the browser installation and the launch configuration before changing application code. Puppeteer’s launch options currently default to Chrome, headless mode, and a 30-second startup timeout. Setting timeout: 0 disables the startup timeout; it does not fix a browser that cannot start.
- Confirm installation and cache location. Starting with Puppeteer v19, downloaded browsers are stored under
~/.cache/puppeteerby default.PUPPETEER_CACHE_DIRcan change that location. Confirm the runtime user can read the cache and that the deployment actually includes the browser. - Check which browser is selected. Review the
browser,channel, andexecutablePathoptions. A system-installed or custom executable is a compatibility variable; do not assume it behaves like Puppeteer’s bundled browser. - Check permissions and profile paths. Ensure the process can execute the browser and write to its user-data directory. A read-only container filesystem or profile shared across conflicting browser processes can prevent startup.
- Check sandbox and host restrictions. On Linux, review sandbox configuration and any AppArmor restrictions. On Windows, inspect browser policy and downloaded-browser permissions. Platform-specific details depend on the OS and release.
- Install required system dependencies. Minimal Linux images may lack libraries Chrome needs. Alpine-based deployments can need special attention. Check the current Puppeteer troubleshooting guide for the target platform and release.
Puppeteer’s troubleshooting guide strongly discourages running Chrome with --no-sandbox. Disabling the sandbox weakens a browser security boundary. Investigate the host’s sandbox configuration and permissions instead of treating that flag as a general fix. The troubleshooting page is a community-maintained “next” guide, so confirm platform instructions against the versions you deploy. Puppeteer troubleshooting guide · LaunchOptions reference
6. Diagnose selector and interaction timeouts
A Puppeteer TimeoutError means an operation did not finish before its configured time elapsed. It can come from launch, navigation, waitForSelector, or an interaction. A longer timeout may help with a legitimately slow page, but it will not fix a selector that never matches or an action whose preconditions are never satisfied. TimeoutError reference
For selector waits, check whether the element exists, whether it is visible, and whether you are querying the right page, frame, or shadow root. waitForSelector can wait for presence or visibility, and it throws when the selector does not reach the requested state before the timeout.
const selector = '[data-testid="submit"]';

try {
  await page.waitForSelector(selector, {
    visible: true,
    timeout: 10_000,
  });
  await page.click(selector);
} catch (error) {
  console.error(`Could not find a visible ${selector}`, error);
  throw error;
}
For user actions, Puppeteer recommends locators. Locators wait for an element to be present and in a suitable state for the requested action. If a locator times out, verify the selector against the live page and check the action’s state requirements—for example, that the target is visible and actionable. waitForSelector is a lower-level option; if it returns an ElementHandle, dispose of the handle when finished.
await page.locator('[data-testid="submit"]').click();Prefer a stable selector such as an application-owned test ID over a long CSS path tied to layout. When the target is inside an iframe or shadow DOM, make sure the query uses the correct context; a valid selector on the main page cannot find an element in a different frame.
7. Common Puppeteer errors and their fixes
| Error or symptom | Likely cause | What to try |
|---|---|---|
Could not find Chrome or executable missing |
Browser was not installed, cache path changed, or runtime user cannot access it. | Confirm Puppeteer’s browser install, inspect PUPPETEER_CACHE_DIR, and check filesystem permissions. |
| Launch timeout | Chrome is slow to initialize, blocked by policy, missing dependencies, or unable to create a profile. | Use dumpio, verify executable and writable profile paths, and inspect host dependencies. Increase the timeout only if startup is slow but progressing. |
TimeoutError in waitForSelector |
Selector is wrong, element is in another frame, or visibility condition is unmet. | Inspect the page and selector context; decide whether you need presence or visibility; use a locator for actions. |
| Click resolves but nothing changes | Wrong target, overlay intercepts input, or application action has not completed. | Watch in headful mode, check page errors and overlays, and wait for the resulting state rather than assuming the click completed the workflow. |
| Page console output is missing | Browser console events were never forwarded to Node. | Attach a page.on('console', ...) listener before navigation. |
| Chrome exits in a container | Sandbox restrictions, missing OS libraries, unwritable profile, or OS policy. | Enable dumpio; investigate the host and current platform troubleshooting guidance. Avoid reflexively disabling the sandbox. |
| Navigation waits indefinitely | The selected lifecycle condition may never occur, or the page has persistent network activity. | Choose the lifecycle event that matches the task, such as domcontentloaded, and wait separately for the specific element or state you need. |
8. Make debugging reliable and keep it fast
Debugging flags add overhead and can change the behavior you are trying to observe. Headful mode requires a display environment, slowMo makes every operation slower, and protocol logging creates extra output. Keep a minimal reproduction and compare it with the normal run. Do not leave verbose protocol logging enabled in routine production traffic.
- Set explicit timeouts for operations whose defaults are inappropriate, but preserve a finite limit so a stuck job eventually returns control.
- Wait for the condition your task needs instead of adding arbitrary sleeps. A fixed delay can be too short on a slow run and waste time on a fast one.
- Always close the browser in cleanup code and dispose of manually retained element handles.
- Record the Puppeteer version, Node version, browser selection, OS or container image, and relevant launch options with a failure report. These details help distinguish code regressions from environment changes.
- Capture only the logs needed to diagnose the issue and protect them. Page URLs, headers, and protocol traffic can reveal sensitive data.
For cost, a local Puppeteer run has no per-screenshot API fee, but it consumes compute, storage, and engineering time. Browser installation, OS dependencies, concurrency limits, and upgrades become your responsibility. In hosted environments, account for the CPU and memory needed by Chrome and for slow or stuck jobs that occupy workers.
9. Or skip the browser setup
If your task is to capture a website image rather than automate browser behavior, ScreenshotNeo can return a screenshot from one GET request. Its API base is ScreenshotNeo; see the API documentation for request options.
curl -G "https://api.screenshotneo.com/v1/shot" \
  -d access_key=YOUR_API_KEY \
  --data-urlencode url=https://stripe.com \
  -o shot.webp
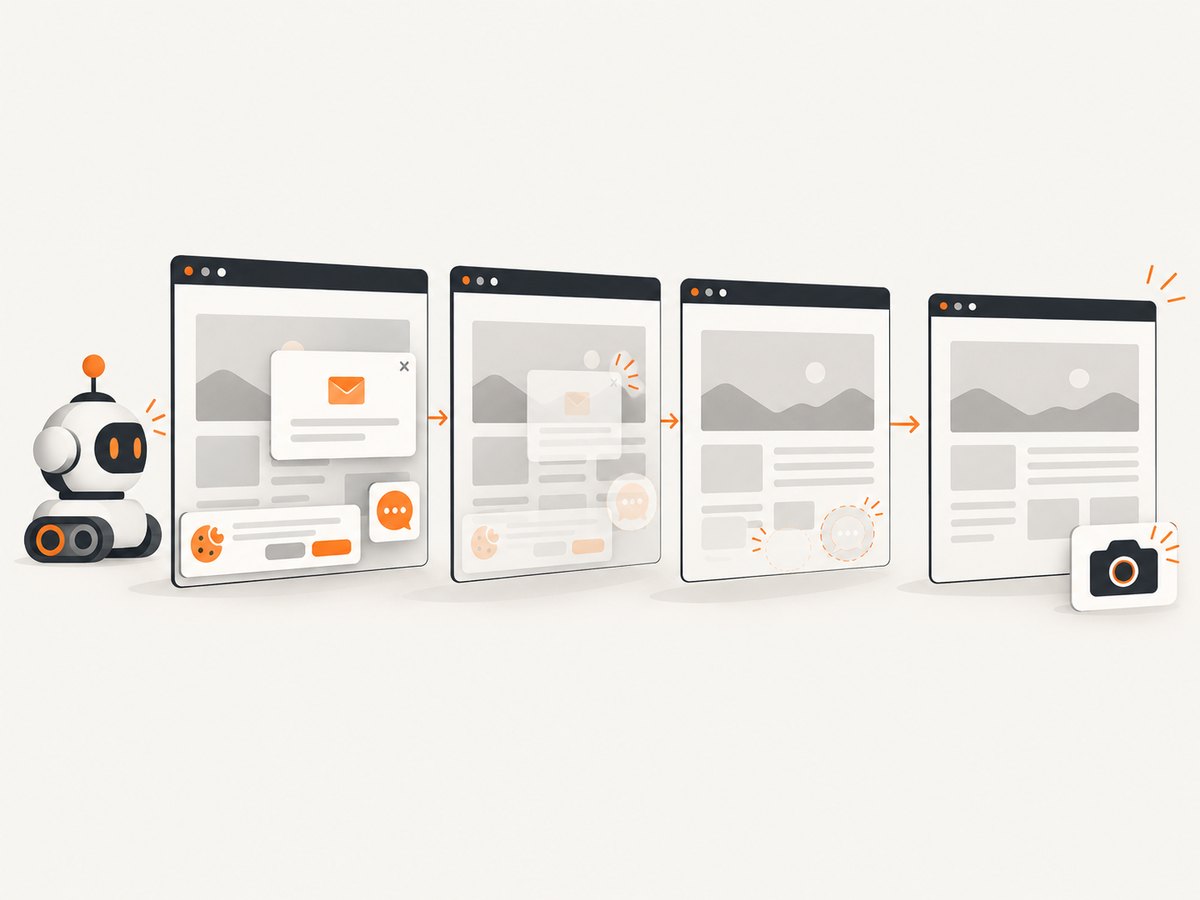
ScreenshotNeo accepts cookie and consent banners like a visitor and removes more than 60 known consent platforms, newsletter popups, and chat widgets before capture; each step can be turned off. Bot checks and CAPTCHAs, blank pages, timeouts, failed loads, and cache hits cost nothing, and response headers report the page verdict and billing status. Its MCP server offers take_screenshot, get_page_info, and capture_pdf tools for AI agents and MCP clients. The free plan includes 1,000 screenshots per month with no card; paid plans start at $5 for 3,000. Every feature is on every plan.
Create a free ScreenshotNeo account for 1,000 screenshots a month with no card.
10. FAQ
Why does Puppeteer work locally but fail in deployment?
The deployment may use a different browser cache, OS image, user permission set, sandbox policy, or dependency set. Compare those environment details before changing selectors or timeouts.
Should I always set a longer timeout?
No. First determine whether the operation is making progress and whether it waits for the right condition. A longer timeout only gives a slow operation more time; it cannot make a missing element appear.
Can I debug page JavaScript with Node’s debugger?
Node’s inspector debugs your server-side script. For JavaScript executing in Chrome, use browser DevTools and a debugger statement in the page code.
When should I use Puppeteer instead of a screenshot API?
Use Puppeteer when you need custom browser automation or control over the browser workflow. If you only need a website screenshot or PDF, an API can avoid maintaining a browser installation and capture script.


