How to Detect Fatal Errors While a Web Page Loads
Use Chrome DevTools to find page-load failures, determine whether they break the page, and separate website, browser, and network causes.

A page-load error is practically “fatal” when it prevents the page’s main content or a required feature from working. A red Console message alone does not prove that the page is unusable: first reproduce the problem, then connect the message to what the page actually fails to show or do.
In Chrome, open DevTools before reloading. Check Console for uncaught exceptions and browser-reported network or CORS messages, Network for failed or missing requests, and Issues for browser-detected problems. Keep Preserve Log enabled if navigation would otherwise clear the evidence. Finally, compare another browser and check whether other sites load to narrow the cause to the page, browser, or connection.
1. Define what “fatal” means for this page
There is no universal Chrome error-severity threshold that makes a message “fatal.” Use the visible result as your test. A failure is page-breaking when the main content is blank or missing, or when a required task—such as submitting a form or opening a key view—cannot be completed. A warning or failed request for an optional feature may be worth fixing without making the page unusable.
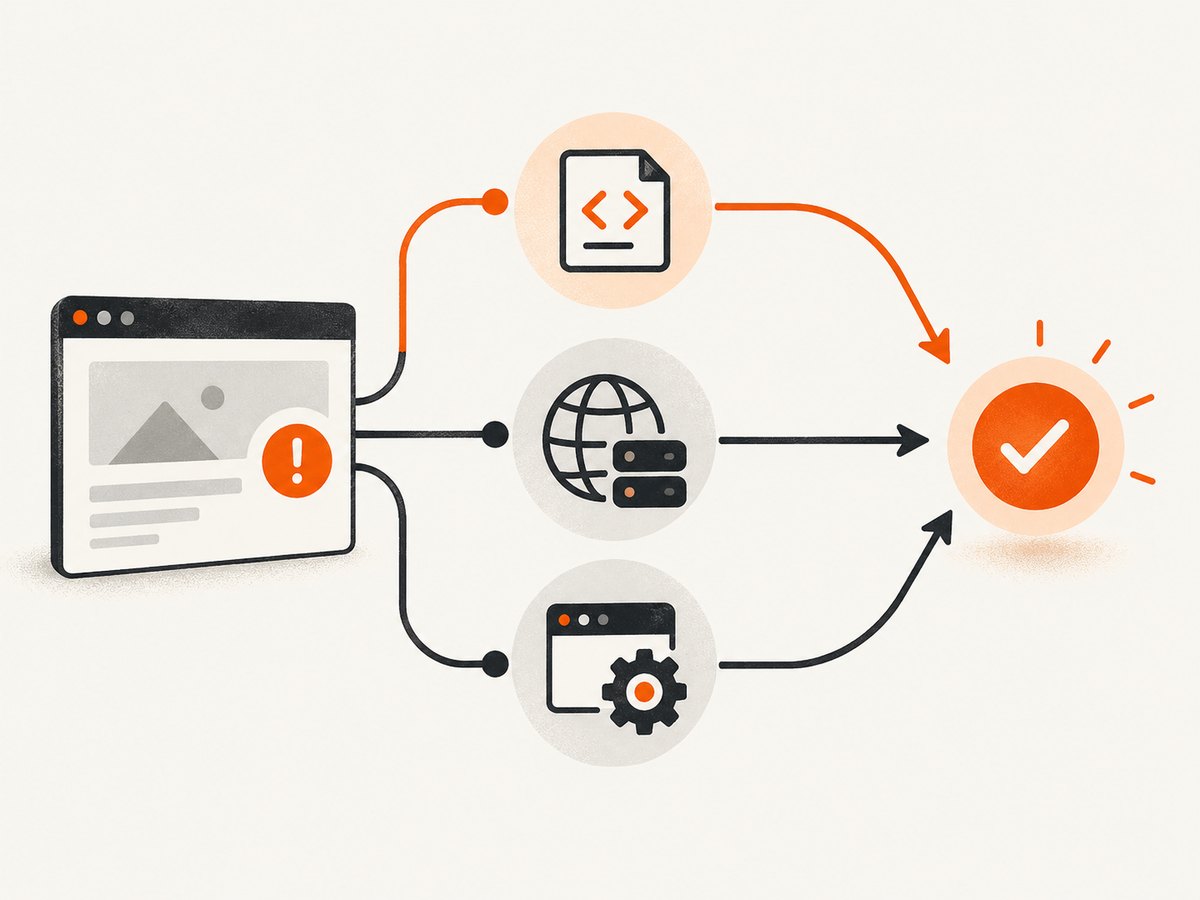
Record the symptom in concrete terms before investigating. “The page is broken” is difficult to compare with diagnostic evidence; “the article body stays blank after reload” or “the account page loads, but submitting the form does nothing” gives you something to reproduce.
| What you observe | What it tells you | What to investigate |
|---|---|---|
| Blank page or missing main content | A core rendering path may have failed. | Uncaught exceptions and required document, script, or data requests. |
| Page renders, but a required control fails | The failure may be limited to a feature. | Errors and requests triggered by that control. |
| A warning appears, but the task still works | The message is evidence, not proof of a fatal failure. | Whether it affects a required feature or can be deferred. |
| Chrome reports that the page is unavailable or crashes | The failure may involve the browser, connection, or site. | Whether other sites work and whether another browser can load it. |
2. Reproduce the failure and preserve the evidence
- Write down the exact URL, browser, and visible symptom. Note whether the page fails on initial load, after an action, or intermittently.
- Open Chrome DevTools before reloading. You can open it from Chrome’s menu under More tools → Developer tools, or use the browser’s DevTools keyboard shortcut.
- In Console, turn on Preserve Log if you need messages to remain after navigation. By default, the Console is cleared on navigation.
- Open Network before reloading. The Network panel records activity only while it is open, so opening it after the page has loaded will not recover the requests from that load.
- Reload the page and wait for the same symptom. If the failure needs an interaction, reproduce that interaction while the panels are open.
- Note the first relevant error and the request or action associated with it. Avoid treating every message in the log as the cause.
For a production issue, keep the record useful and safe to share: capture the URL and relevant error text, but remove credentials, private query parameters, and sensitive request data before sending logs to someone else.
3. Read Console errors without overcalling them
The Console can show uncaught JavaScript exceptions, browser-reported network messages, and CORS errors. These point toward different investigation paths. Look for the earliest message that coincides with the broken content or action, then follow its stack or resource reference where available.
Uncaught JavaScript exceptions
An uncaught exception can interrupt the code path that builds or updates part of a page. For example, Chrome’s documentation shows a TypeError that occurs when code tries to update a DOM node that is missing. The useful question is not simply “Is there a TypeError?” but “Did this exception prevent the code responsible for the missing content or required interaction from running?”
Open the linked source location or stack trace and inspect the code around the failure. Check assumptions about DOM elements, data returned from the server, and the order in which scripts run. Reproduce the issue with DevTools open; JavaScript debugging is most useful when you can connect the paused or reported code path to the page symptom.
Network and CORS messages
A Console message can report a failed request, but the Network panel gives you the request details. A missing file can, for example, appear as a 404. A CORS error indicates that the browser blocked access under cross-origin rules; inspect the affected request and response rather than assuming the server is down. A request can fail while the rest of the page remains usable, so identify whether the failed resource supports the broken part.
Chrome’s Console documentation covers persisted messages, browser network messages, and CORS errors. Use those messages as pointers into the relevant request or script investigation, not as a severity ranking.
4. Use Network to find failed or missing resources
With Network open during reload, inspect requests that should support the broken content. The panel helps you determine whether resources were uploaded or downloaded and inspect request properties such as headers, content, and size.
- Find the request associated with the missing content or feature. If the list is long, focus on the resource type and timing that match the symptom.
- Check whether the expected request appears at all. A missing request can mean the page code never reached the request, the action that triggers it did not occur, or the resource was not requested as expected.
- For failed requests, inspect the status and request details. Confirm the URL, response, and relevant headers before deciding whether the issue is in the page or elsewhere.
- Compare the request with the visible failure. A failed optional image is different from a failed script or data request that the main page requires.
- Reload after making a change so the new request and result are recorded. Keep Network open for the full load.
Do not infer a universal cause from one failed status. A 404 tells you that the requested resource was not found at that URL; it does not, by itself, explain why the URL was generated or whether that missing file breaks the page.
5. Review Issues for browser-detected problems
Open DevTools’ Issues panel to review browser-detected problems with context and suggested fixes. Issues can link affected resources to other DevTools panels, which helps you move from a grouped problem to the relevant request or source.
If you need to catch problems generated during startup, keep DevTools available and reload. Chrome’s Issues guide specifically recommends reloading on the Issues panel to catch more issues that occur during page load. Treat each issue as something to assess against the symptom: the panel’s presence does not mean every issue prevents the page’s main task.
6. Decide whether the page failure is actually fatal
Make the decision by connecting evidence to user impact. Use this checklist:
- Main content: Does the content a visitor came for appear?
- Required task: Can the visitor complete the essential action?
- Evidence: Is there an exception or failed resource at the point that content or action should work?
- Scope: Does the same failure happen on one URL or across unrelated sites?
- Repeatability: Can you reproduce it after reload, or does it happen only intermittently?
If the Console contains an error but the main content and required feature work, describe it as a message to investigate rather than calling the page fatal. If the core task fails, report both the visible consequence and the first relevant evidence. That distinction keeps debugging focused and makes issue reports more useful.
7. Separate website, browser, and network causes
When the source is unclear, use controlled comparisons. Google Chrome Help recommends checking whether other sites work, verifying the connection, and trying another browser to help isolate loading problems.
| Check | Result | What it suggests |
|---|---|---|
| Open unrelated sites in the same browser. | Several sites fail. | Check the connection, browser, or device before narrowing the problem to one website. |
| Open the affected URL in another browser. | It works there but fails in Chrome. | Investigate a Chrome-specific condition, configuration, or compatibility path. |
| Open the affected URL in another browser. | It fails there too, while other sites work. | The website or a resource it depends on becomes a stronger possibility. |
| Check the same URL again after the connection is restored or stabilized. | The page now loads. | The original failure may have involved the network path; capture fresh evidence if it returns. |
These comparisons are diagnostic clues, not a formal classification system. Record what changed between attempts—browser, network, URL, or timing—so you do not mistake a coincidence for a cause.
8. Troubleshooting common page-load errors
| What you see | Likely investigation | Next step |
|---|---|---|
| Console clears after reload | Messages are cleared on navigation by default. | Enable Preserve Log, then reproduce the failure. |
| Network list is empty or misses the page load | Network was opened after the activity occurred. | Open Network first and reload. |
| Uncaught TypeError and missing content | Code may be acting on an absent node or invalid assumption. | Open the stack location and check whether that path builds the missing content. |
| 404 for a script, stylesheet, image, or data file | The requested resource was not found at that URL. | Inspect the request URL and determine whether that resource is required by the failing feature. |
| CORS message | The browser blocked cross-origin access. | Inspect the affected request and response; confirm the page is requesting the intended resource. |
| Issue appears, but the page seems usable | The detected problem may not affect the essential task. | Test the main content and required interactions before assigning severity. |
| “This webpage is not available” or “Aw, Snap!” | The failure may involve the site, connection, device, or browser. | Check other sites, verify the connection, and try another browser to isolate the scope. |
| Failure cannot be reproduced | The issue may be intermittent or dependent on a specific load or action. | Keep DevTools open before the next attempt; record timing and the action that precedes it. |
9. Capture visual evidence when it helps
A screenshot can show whether the page is blank, partially rendered, or visibly blocked, but it cannot replace Console and Network evidence. Use it to preserve the visible symptom alongside the exact URL and a short description of what failed. Avoid including personal data or account details in screenshots you share.

For repeated page checks, an automated screenshot can help you compare the rendered result over time. It does not prove that a JavaScript error occurred or explain a failed request; use DevTools when you need that diagnostic detail.
Or skip the browser setup
For a quick visual capture, ScreenshotNeo takes a screenshot from one API request. It can help document what a page rendered while you investigate the underlying fault; use DevTools for Console, Network, and Issues diagnostics. See the ScreenshotNeo website and API documentation.
curl -G "https://api.screenshotneo.com/v1/shot" -d access_key=YOUR_API_KEY --data-urlencode url=https://stripe.com -o shot.webpimport requests
r = requests.get(
"https://api.screenshotneo.com/v1/shot",
params={"access_key": "YOUR_API_KEY", "url": "https://stripe.com"},
timeout=90,
)
open("shot.webp", "wb").write(r.content)const q = new URLSearchParams({ access_key: 'YOUR_API_KEY', url: 'https://stripe.com' });
const res = await fetch(`https://api.screenshotneo.com/v1/shot?${q}`);ScreenshotNeo accepts cookie or consent banners like a visitor and removes 60+ known consent platforms, newsletter popups, and chat widgets before capture; each of those steps can be turned off. Bot checks, blank pages, failed loads, timeouts, and cache hits cost nothing, and response headers identify the page verdict and billing status. It also has an MCP server with screenshot, page-info, and PDF tools for AI agents. The free plan includes 1,000 screenshots a month with no card; paid plans start at $5 for 3,000 screenshots.
Sign up free for 1,000 screenshots a month—no card required.
Performance, reliability, and cost notes
For manual diagnosis, opening DevTools before the load is the key reliability step: Console can clear on navigation, and Network only records while open. Reproduce the same URL and action consistently, then compare the first relevant error and request with the visible outcome. A screenshot gives a visual record; it does not establish the cause of an exception or failed resource.
For automated visual captures, ScreenshotNeo supports a cache with a TTL you choose, asynchronous jobs with signed webhooks, bulk capture of up to 100 URLs per call, and a usage API. Its billing rules mean bot checks, blank pages, timeouts, failed loads, and cache hits cost nothing; inspect the response’s X-Page-Verdict and X-Billed headers to see the outcome. Plans are Free for 1,000 shots/month, Starter $5 for 3,000, Growth $15 for 15,000, Pro $39 for 60,000, Scale $99 for 250,000, and Business $249 for 1,000,000. Yearly billing gives two months free, and every feature is on every plan. See current setup details in the ScreenshotNeo documentation.
FAQ
Does every red Console message mean the page is broken?
No. Check whether the main content or a required feature actually fails, and connect the message to that consequence.
Can DevTools tell me whether a website is down for everyone?
It shows what happened in your browser. Compare other sites and another browser to narrow the cause, but one local check does not establish what every visitor sees.
Can a screenshot identify the JavaScript error?
No. A screenshot preserves the visible result. Use Console and the relevant source location to investigate JavaScript exceptions.
Should I fix a failed request if the page still works?
Determine which content or feature depends on it. The request may affect an optional element, but a failure affecting a required task deserves investigation even if the rest of the page renders.


