How to Detect Whether a Web Page Is Loading Resources
Use DevTools or the Resource Timing API to see which files a page requests, whether they load, and where failures occur.
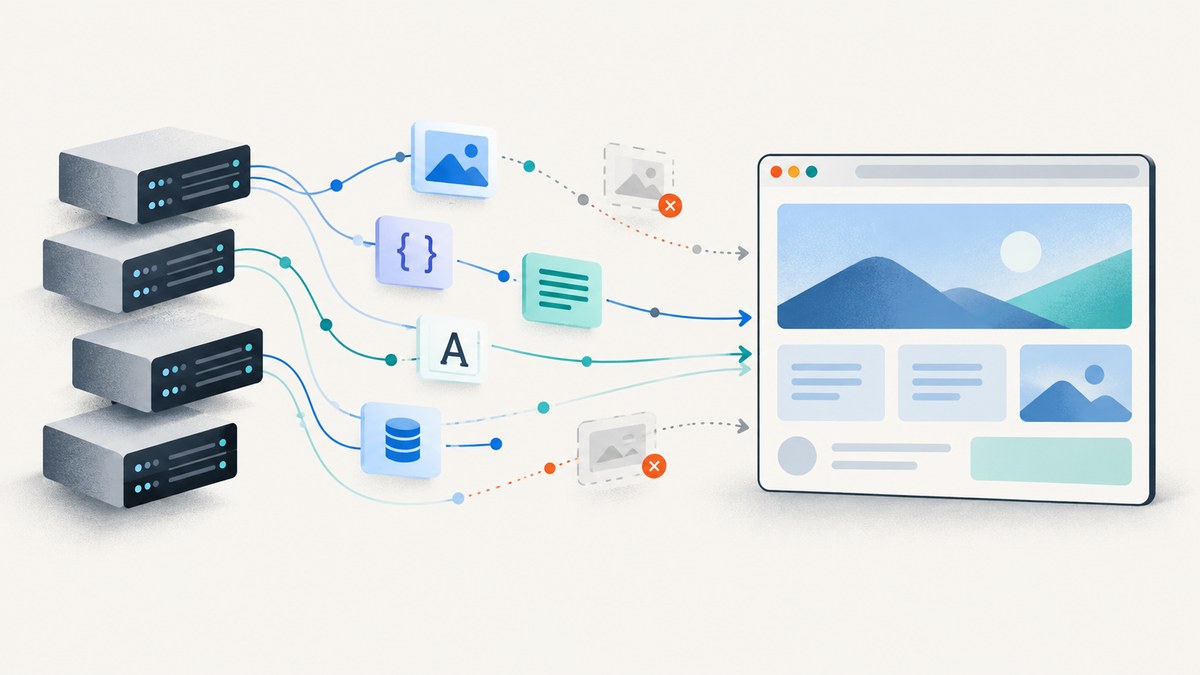
To see whether a web page is loading resources, open the browser’s Developer Tools, select Network, and reload the page. The request list shows what the browser asked for, while each row’s status, response, and timing help you tell whether a file arrived or failed. For a scriptable inventory, use the browser’s Resource Timing API with performance.getEntriesByType('resource').
A request row proves that the browser attempted a fetch; it does not by itself prove the browser used the returned bytes successfully in the rendered page. Check the response and correlate failures with the visible page and console errors.
1. Inspect requests in DevTools
- Open the page in a desktop browser and open Developer Tools.
- Select the Network panel before reloading. Chrome records requests while DevTools is open.
- Reload the page. The table should fill with rows, one for each requested URL.
- Use the Name and Type columns to identify the main document and its resources: stylesheets, scripts, images, fonts, fetch/XHR requests, and others.
- Inspect Status. Select a request to examine its headers, preview, response, and timing details.
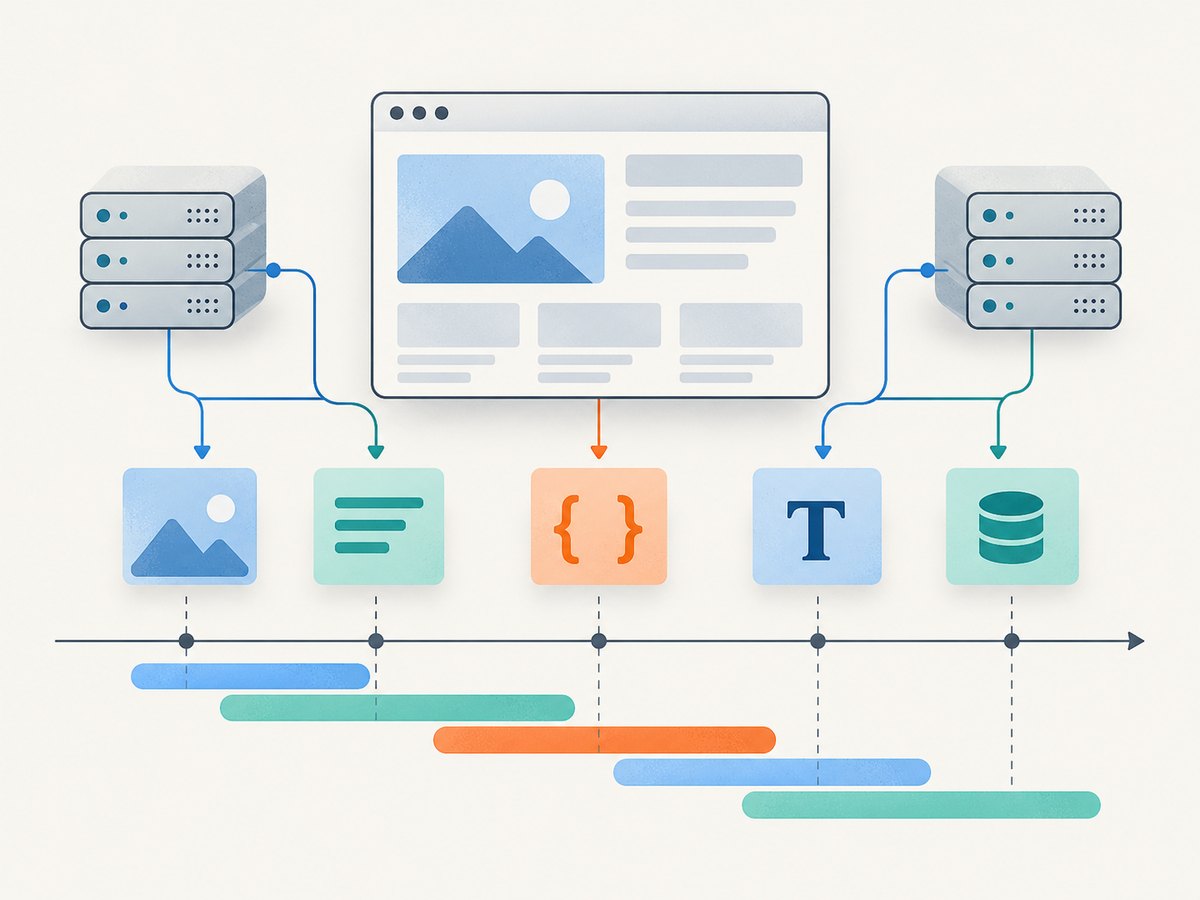
- Read the Waterfall to understand when requests started and how long they took. Overlapping bars indicate work occurring concurrently.
The main HTML document is normally the first request. Its markup can reference many other resources, and JavaScript can initiate additional requests after the document arrives. The precise panel labels vary by browser and version, but the useful evidence is the request URL, type, status, response, and timing.
Reveal requests that happen later
An initial reload is only a snapshot of initial activity. Images may be lazy-loaded as they approach the viewport, and applications may fetch data only when someone scrolls, clicks a tab, opens a menu, or submits a form. Keep Network recording and reproduce the interaction that might trigger the missing resource. If a request starts after an interaction, inspect its initiator and timing alongside the page behavior.
Check the response, not just the row
A successful-looking status is useful evidence, but also inspect the response when a resource still appears broken. A server may return an error page with an unexpected content type, or a request may be blocked before a usable response arrives. Look for failed or red rows, HTTP errors, blocked reasons, empty responses, and relevant console messages. For images, compare the preview with what the page displays; for scripts and stylesheets, check whether the expected behavior or styling appeared.
2. Distinguish fresh network activity from cached resources
A normal reload can reuse cached files, so it may not show the same transfer behavior as a first visit. In Chrome, use Empty Cache and Hard Reload when you need to check fresh fetching. This is especially useful when a stale local copy might explain why a recent change is not visible.
Use a regular reload when reproducing what a returning visitor sees; use an empty-cache hard reload when investigating whether the browser can fetch current resources without relying on its cache. These answer different questions. Do not conclude that a server is unreachable simply because a cached page rendered, or that every visitor will need the same transfer just because a fresh fetch did.
3. List loaded resources with JavaScript
For a code-level inventory, the Performance API exposes Resource Timing entries. Run this in the page’s DevTools Console after it has loaded:
const resources = performance.getEntriesByType('resource');
for (const r of resources) {
  console.log({
    name: r.name,
    initiatorType: r.initiatorType,
    start: r.startTime,
    duration: r.duration,
    transferSize: r.transferSize,
    encodedBodySize: r.encodedBodySize,
    decodedBodySize: r.decodedBodySize
  });
}
Each entry describes a resource fetch recorded in the document’s performance timeline. name is the resource URL; initiatorType gives an indication of what initiated it; startTime and duration help place it in the page’s load sequence. The size fields can help you investigate transfer and decoded sizes, subject to browser and cross-origin restrictions. Resource Timing is a timeline and inventory, not a substitute for checking the actual response and rendered result.
Observe entries as they arrive
Use a PerformanceObserver if you want to log entries added after your script starts observing. This is useful for monitoring later activity during a test or interaction. The observer can only report entries it receives; install it early if you need to see more of the page’s activity.
const observer = new PerformanceObserver((list) => {
  for (const r of list.getEntries()) {
    console.log({
      name: r.name,
      initiatorType: r.initiatorType,
      start: r.startTime,
      duration: r.duration,
      transferSize: r.transferSize
    });
  }
});

observer.observe({ type: 'resource', buffered: true });
The buffered option asks for available earlier entries as well as new ones. Resource Timing has a finite buffer; MDN documents the resourcetimingbufferfull event for detecting when it fills. If a long-running page creates many entries, handle that event and consider clearing or collecting entries as appropriate for your monitoring design.
4. Choose the right diagnostic method
| Method | Best for | What it reveals | Limit |
|---|---|---|---|
| DevTools Network | Interactive diagnosis | Request rows, status, headers, preview/response, timing, and waterfall | Needs the browser session and the relevant action to be reproduced |
| Resource Timing | Scripted inventory or logging | Resource names, initiator hints, timeline, and size fields | Does not by itself prove that the page used a resource successfully; some cross-origin details are hidden |
| Hard reload with cache emptied | Fresh-fetch investigation | Whether resources can be fetched without relying on the existing browser cache | Changes the cache conditions from an ordinary returning visit |
Start with Network when you do not know what is wrong: its response and timing context helps narrow the cause. Use Resource Timing when you want a repeatable code-level record or need to compare resource timing across page states. Combine them when a request appears in the timeline but its outcome is unclear.
5. Interpret timing and cross-origin limits
The Network panel’s timing details can break a request into phases such as DNS lookup, connection, request, and response where those details are available. Long bars in the waterfall can indicate slow work, but identify the phase before changing code: a delay in connection setup points to a different problem than a delay waiting for a response. Several overlapping requests may be loading concurrently.
Resource Timing also records a standardized timeline, but cross-origin privacy rules can hide detailed timing. For a resource from another origin, fields including domainLookupStart, connectStart, requestStart, and responseStart can be zero by default unless the resource grants timing access. A zero in those fields is not proof that the resource took no time or was not requested. Use the Network panel for the browser’s request-level context, and treat unavailable cross-origin timing values as restricted data.
6. Troubleshoot common resource-loading problems
| Symptom | Likely cause to investigate | Next step |
|---|---|---|
| No requests appear | Network recording was not active for the reload, or the page did not reload. | Open Network first, confirm recording, and reload. Check that you are inspecting the correct browser tab. |
| A resource is missing from the first load | It may load lazily or after an interaction. | Scroll, click the relevant control, submit the form, or reproduce the state that needs the resource. |
| A request row is red or failed | The fetch failed, was blocked, or returned an error. | Open the row, record its status and blocked reason, then inspect headers and response. Check the Console for related errors. |
| A request has an HTTP error | The server or an intermediary returned an error status. | Inspect the response and request URL. Confirm the endpoint, access requirements, and server behavior for that request. |
| The page works, but a resource is absent after reload | The browser may have reused a cached copy. | Compare a normal reload with Chrome’s Empty Cache and Hard Reload. |
| Resource Timing shows zero detailed timing values | Cross-origin timing access may be restricted. | Do not interpret zero as zero elapsed time. Use Network’s timing view and check whether the resource permits timing access. |
| Expected entry is missing from a long session | The finite Resource Timing buffer may have filled, or the entry predates observation. | Observe earlier, request buffered entries when appropriate, and handle resourcetimingbufferfull. |
| Entry exists, but the page still looks wrong | A request attempt or response does not prove the page consumed the bytes successfully. | Inspect the response and content type, visible rendering, and Console errors together. |
7. Make the investigation reliable and efficient
- Write down the test conditions. Record browser, page state, reload type, cache condition, and interaction sequence so another run is comparable.
- Capture both initial and deferred activity. Reload once with Network open, then perform the interaction that may trigger later requests.
- Separate fetch from rendering. A response arriving is one step; check whether the page displays or uses it correctly.
- Compare like with like. Keep cache and interaction conditions consistent when comparing timing across runs.
- Use the narrowest useful evidence. Start with the failed request’s URL, status, initiator, response, and timing rather than treating the whole waterfall as one undifferentiated problem.
- Account for privacy restrictions. Cross-origin timing fields may be unavailable, so avoid making performance conclusions from zeroed fields alone.
For performance work, focus on the slow phase and the resource’s role. A large image, delayed API response, and connection setup issue call for different fixes. The waterfall shows overlap and ordering; response and timing details help determine whether a resource is actually on the critical path for the behavior being investigated.
8. Or skip the browser setup
If you need a clean screenshot of a page to document or inspect its rendered state, ScreenshotNeo returns a screenshot or PDF with one GET request. It is a capture API, not a replacement for inspecting individual network requests.

ScreenshotNeo API documentation
curl -G "https://api.screenshotneo.com/v1/shot" -d access_key=YOUR_API_KEY --data-urlencode url=https://stripe.com -o shot.webpScreenshotNeo accepts cookie and consent banners like a visitor and removes 60+ known consent platforms, newsletter popups, and chat widgets before capture; each step can be turned off. Bot checks/CAPTCHAs, blank pages, timeouts, failed loads, and cache hits cost nothing, and response headers identify the page verdict and billing status. Its MCP server provides take_screenshot, get_page_info, and capture_pdf tools for Claude, Cursor, and other MCP clients. The free plan includes 1,000 screenshots per month with no card; paid plans start at $5 for 3,000.
Python:
import requests

r = requests.get(
    "https://api.screenshotneo.com/v1/shot",
    params={"access_key": "YOUR_API_KEY", "url": "https://stripe.com"},
    timeout=90,
)
open("shot.webp", "wb").write(r.content)
Node.js:
const q = new URLSearchParams({ access_key: 'YOUR_API_KEY', url: 'https://stripe.com' });
const res = await fetch(`https://api.screenshotneo.com/v1/shot?${q}`);
const bytes = new Uint8Array(await res.arrayBuffer());
await import('node:fs/promises').then(fs => fs.writeFile('shot.webp', bytes));
Create a free ScreenshotNeo account for 1,000 screenshots a month with no card.
FAQ
Can JavaScript tell me whether every resource loaded successfully?
Resource Timing can list recorded resource fetches and timing data, but its entries alone do not establish that the browser used every response successfully in the rendered page. Check status and response in Network and correlate with the page and Console.
Why do some resource timing values show zero?
Cross-origin privacy restrictions can hide detailed timing unless the resource permits access. Zero in a protected timing field does not mean the request took no time.
Why does scrolling reveal new requests?
Pages may defer images and other work until content approaches the viewport or a user interaction triggers it. Keep recording and reproduce the relevant action.
Does a Network row mean the resource is visible on the page?
No. It means the browser made a request attempt. Verify the response and rendered result separately.


