How to Detect a Website’s Technology Stack
Learn how to identify a website’s CMS, frameworks, hosting, analytics and third-party tools using lookups, DevTools and verifiable evidence.

Short answer: identify a website’s stack by combining a technology lookup with manual verification. Start with Wappalyzer for a fast list of likely CMSs, frameworks, analytics tools and infrastructure. Then use Chrome DevTools to inspect the page’s requests, headers, response HTML, cookies, scripts and loaded resources. Treat every result as evidence, assign a confidence level, and record when you observed it.
A lookup can suggest what a site uses, but it cannot guarantee visibility into private server code. Client-side fingerprints are observable; backend services may be hidden, proxied or deliberately removed from responses.
What website stack detection can reveal
Stack detection is public-signal fingerprinting. Depending on the site, you may identify:
- CMS: WordPress, Drupal, Shopify or another publishing platform.
- Frontend: React, Vue, Angular, Next.js, Nuxt or component libraries.
- Backend clues: server software, framework headers, generated markup and route conventions.
- Infrastructure: CDN, cache, hosting provider, DNS and edge services.
- Marketing and analytics: tag managers, analytics scripts, pixels and experimentation tools.
- Commerce and support: checkout providers, payment widgets, chat and consent platforms.
These are observations about what the browser receives. A site can use a database, API or framework that leaves no public fingerprint.
Fastest workflow: lookup first, verify second
1. Run a technology lookup
Enter the domain in Wappalyzer’s website technology lookup or use its browser extension. Wappalyzer says it detects technologies from source code, HTTP headers, cookies, JavaScript variables and other signals. The result is a useful starting inventory for CMSs, ecommerce, analytics, frameworks and infrastructure.
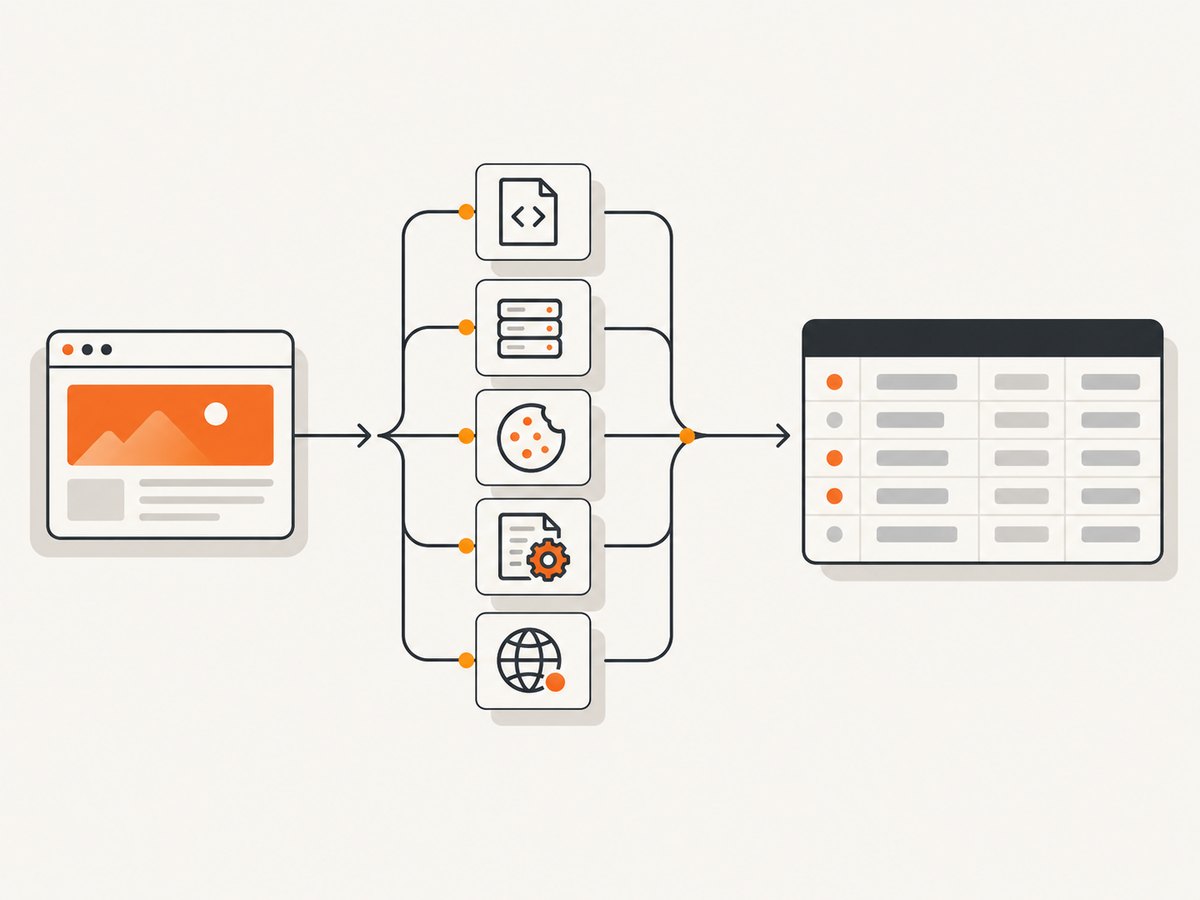
Save the domain, result and date. A redesign, migration or new tag can change the answer tomorrow.
2. Open Chrome DevTools and record a fresh load
- Open the target page in Chrome.
- Open DevTools with
Ctrl+Shift+I(Windows/Linux) orCmd+Option+I(macOS). - Choose Network, enable recording, and reload the page.
- Enable Preserve log if navigation or redirects matter.
- Click the main document request, usually the first request with type
document.
Chrome’s Network panel records activity and lets you inspect request headers, responses, initiators, timing and cookies. The panel also supports filtering and searching across headers and responses. See the Chrome Network panel documentation.
3. Inspect response headers
In the request’s Headers tab, review:
| Signal | What it may suggest | Why it is not proof |
|---|---|---|
server |
Web server or edge platform | CDNs can replace or hide it |
x-powered-by |
Runtime or framework family | It may be removed, spoofed or stale |
| Cache headers | CDN, reverse proxy or application caching | Several providers use similar values |
| Platform-specific headers | Managed hosting or commerce platform | Headers can be normalized at the edge |
Use headers as clues. Confirm an important conclusion with HTML, assets or another independent signal.
4. Read the returned HTML
Open the request’s Response tab and search for:
<meta name='generator'>and other generator metadata.- Framework markers, hydration data and JSON configuration objects.
- CMS paths such as upload, theme or plugin directories.
- Distinctive comments, component names and route conventions.
- Script and stylesheet URLs that identify build systems or hosted services.
View source and the live DOM are different evidence. The response is what the server returned; the Elements panel shows the DOM after JavaScript modified it. Compare both when a framework renders content only in the browser.
5. Review loaded resources
Use the Sources panel and Network filters for JS, CSS, images and fonts. File names, directory paths, source maps and third-party domains can reveal:
- Frontend libraries and bundles.
- Analytics, tag managers and advertising pixels.
- CDNs and image optimization services.
- Payment, chat, consent and customer-support vendors.
A minified bundle name is a lead, not a verdict. Search the bundle for a package name, a global variable or a recognizable URL, then corroborate it.
6. Check cookies and JavaScript variables
In the request’s Cookies tab, note names, domains, paths and expiry. Technology-specific cookie names can strengthen a CMS or analytics hypothesis, but cookies may be renamed, blocked or set only after consent.
In the Console, inspect likely globals and configuration objects. For example:
// Look for common public globals (names vary by site)
Object.keys(window).filter(k => /analytics|dataLayer|webpack|next|nuxt|shop/i.test(k));
document.cookie;
Do not assume that a missing global means the technology is absent. Sites can isolate code in modules, shadow it behind a tag manager or remove it in production.
7. Check DNS and external domains
DNS records and request destinations can identify hosting, email, CDN and third-party services. They do not prove the application’s complete backend. A site may use one provider for DNS, another for CDN and a private origin elsewhere.
How to turn clues into a reliable conclusion
Use an evidence table for every technology you report:
| Technology | Observed signal | Source | Confidence | Observed |
|---|---|---|---|---|
| Example CMS | Generator tag plus asset path | HTML response | High | 2026-09-30 |
| Example CDN | Cache header and request hostname | Headers and Network | Medium | 2026-09-30 |
| Example analytics | Script request only | Network | Medium | 2026-09-30 |
A practical rule is to require two independent signals for a high-confidence claim. Label a technology as observed when you saw a direct marker, and inferred when it follows from indirect evidence. Include the URL, page type and timestamp because different sections of one site can use different systems.
Automating evidence collection
For one site, DevTools is usually fastest. For many sites, use a lookup service or a browser automation script, then retain raw evidence for review. The following cURL request fetches a page so you can inspect headers and HTML:
curl -L -D headers.txt -o page.html https://example.com
rg -i 'generator|wp-content|_next|dataLayer|shopify' page.html headers.txt
Python can collect the same basic signals:
import requests

url = 'https://example.com'
r = requests.get(url, timeout=30, headers={'User-Agent': 'StackAudit/1.0'})
print('status:', r.status_code)
print('server:', r.headers.get('server'))
print('powered by:', r.headers.get('x-powered-by'))
print('cookies:', list(r.cookies.keys()))
for marker in ('generator', 'wp-content', '_next', 'dataLayer'):
    print(marker, marker.lower() in r.text.lower())
Node.js provides equivalent access:
const res = await fetch('https://example.com', {
  headers: { 'user-agent': 'StackAudit/1.0' }
});
const html = await res.text();
console.log({
  status: res.status,
  server: res.headers.get('server'),
  poweredBy: res.headers.get('x-powered-by'),
  markers: ['generator', 'wp-content', '_next', 'dataLayer']
    .filter(m => html.toLowerCase().includes(m.toLowerCase()))
});
HTTP fetching misses client-rendered content. If the evidence appears only after JavaScript runs, use a real browser and capture the Network log, final DOM and cookies after the page settles. Respect robots rules, terms and rate limits when auditing sites you do not control.
Or skip the browser setup
If you need a visual record of the page while researching its stack, ScreenshotNeo returns a screenshot or PDF from one GET request. Its capture options include full-page screenshots with lazy images, a CSS-selected element, custom JavaScript and CSS, waiting for a selector, delay or network idle, custom headers and cookies, device presets, dark mode and PDF settings. The response identifies whether the page was cleanly captured and whether it was billed.
Cookie banners, newsletter popups and chat widgets are removed before the shot. Bot checks, blank pages and failed loads are never billed. ScreenshotNeo also provides an MCP server so Claude, Cursor and other MCP clients can call take_screenshot, get_page_info and capture_pdf. The free plan includes 1,000 screenshots a month with no card; paid plans start at $5 for 3,000. See the ScreenshotNeo API documentation.
curl -G 'https://api.screenshotneo.com/v1/shot' \
  -d access_key=YOUR_API_KEY \
  --data-urlencode url=https://example.com \
  -o stack-reference.webp
import requests
r = requests.get(
'https://api.screenshotneo.com/v1/shot',
params={'access_key': 'YOUR_API_KEY', 'url': 'https://example.com'},
timeout=90,
)
open('stack-reference.webp', 'wb').write(r.content)const q = new URLSearchParams({
access_key: 'YOUR_API_KEY',
url: 'https://example.com'
});
const res = await fetch(`https://api.screenshotneo.com/v1/shot?${q}`);
const bytes = Buffer.from(await res.arrayBuffer());
await import('node:fs/promises').then(fs => fs.writeFile('stack-reference.webp', bytes));Start with 1,000 free screenshots a month with no card.
Common errors and fixes
| Problem | Likely cause | Fix |
|---|---|---|
| No framework detected | Server-rendered HTML, bundled code or hidden markers | Inspect source maps, script URLs, response headers and runtime requests together. |
| Lookup says an old CMS | Stale detector signature or migration residue | Check current HTML and assets; record the lookup date and lower confidence. |
| Headers reveal nothing | CDN or security layer strips identifying headers | Use response HTML, cookies, scripts and DNS as independent evidence. |
| Page differs in DevTools | Geolocation, cookies, consent or user-agent variation | Document the test conditions and repeat in a clean profile. |
| Automated request gets a challenge | Bot protection or rate limiting | Slow requests, identify your client, obtain permission and use a browser session where appropriate. |
| Screenshot is blank | Page timed out, blocked resources or requires interaction | Wait for a selector or network idle, provide required cookies or headers, and inspect the returned verdict headers. |
Performance, reliability and cost considerations
- Performance: a lookup is faster than a full browser load. For manual checks, filter Network by document, script and fetch to reduce noise.
- Reliability: repeat important observations from a clean session and a normal session. Personalization, consent state and experiments can change signals.
- Freshness: timestamp every report. Technology stacks change during redesigns, migrations and vendor swaps.
- Cost: lookup APIs and browser automation may have plan or usage limits. For visual references, ScreenshotNeo bills only clean shots; cache hits, bot checks, blank pages, timeouts and failed loads are not billed.
- Privacy: avoid collecting authenticated pages or sensitive cookies unless you have authorization. Redact tokens from exported logs.

Checklist for a stack report
- Run a lookup and save its date.
- Reload with DevTools Network recording enabled.
- Inspect document headers, response HTML and cookies.
- Review JavaScript, CSS, source maps and third-party domains.
- Check public globals and DNS where relevant.
- Separate observed facts from inferences.
- Require corroboration for high-confidence claims.
- Record page URL, test conditions and timestamp.
- Keep raw evidence so another developer can reproduce the finding.
FAQ
Can I detect a site’s backend framework with certainty?
No. You can identify public fingerprints and make an evidence-based inference, but a proxy, custom build or stripped headers can hide the backend.
Is the live DOM enough?
No. Compare the original response HTML with the live DOM. Client-side rendering may add useful markers after load, while server output may contain different clues.
Why do two tools report different stacks?
They may use different detector signatures, scan at different times or see different pages, cookies and regions. Verify disagreements against current raw evidence.
Should I report every detected library?
Report technologies relevant to the question and include the signal and confidence. A long unverified list is less useful than a short, reproducible inventory.
Can screenshots prove which framework a site uses?
A screenshot documents visual output, not the implementation. Pair it with HTML, headers, scripts and Network evidence. ScreenshotNeo is useful for repeatable visual references while you collect those signals.


