What Are DevTools and How Are They Used in Web Scraping?
Learn how Chrome DevTools reveals page data and network requests, how to inspect them, and when to use HTTP requests or browser automation.
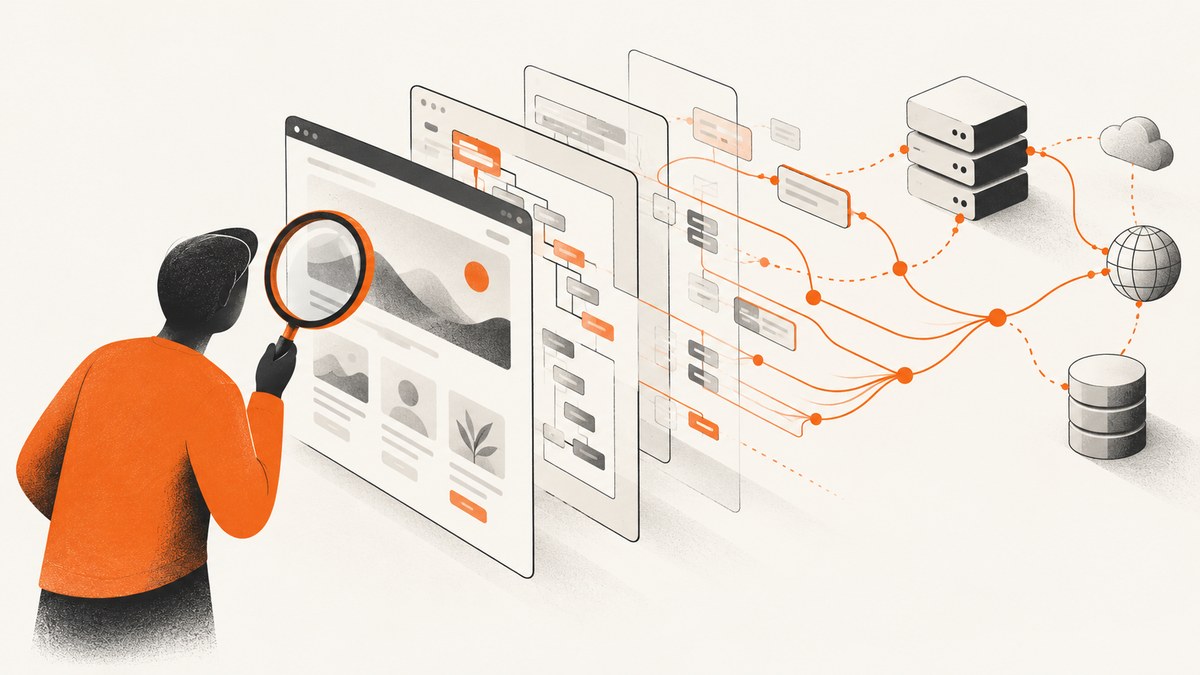
DevTools are inspection and debugging tools built into a browser. For web scraping research, the most useful part is usually the Network panel: it shows the requests a page makes and lets you inspect their URLs, headers, payloads, responses, and timing. Elements helps you examine the rendered page, and Console lets you try small JavaScript observations.
DevTools helps you understand how a site delivers information; it does not create a maintained scraper or establish permission to collect data. Use it to decide whether a direct HTTP request and parser are sufficient or whether the page depends on JavaScript, browser state, or user interaction.
1. What DevTools are
Chrome DevTools is a set of tools built into Chrome for inspecting and debugging web pages. Its panels have different jobs:
| Panel | What it shows | Use during scraping research |
|---|---|---|
| Elements | The page’s DOM and CSS | Find where visible values appear in the rendered markup and inspect nearby attributes. |
| Console | JavaScript messages and a command prompt | Check simple observations about the current page or see client-side errors. |
| Network | Requests and responses made by the page | Trace data loading, filter request types, and inspect request and response details. |
| Sources | Loaded files and JavaScript debugging tools | Investigate scripts when you need to understand client-side behavior. |
| Performance | Load and runtime activity | Look into slow page behavior that affects when content becomes available. |
For most initial reconnaissance, start with Network. Elements tells you what ended up in the page; Network can help explain where that content came from. Chrome’s documentation describes DevTools and its panels in its official overview.
2. Inspect a page’s requests in Chrome
Step 1: Open Network before reloading
- Open the page you are researching.
- Open DevTools using Chrome’s menu or the browser’s developer-tools keyboard shortcut for your operating system.
- Select the Network panel.
- Reload the page while Network is open.
Network records activity while it is open. If you open it after the page has loaded, some page-load requests may already be gone. Reload with the panel open to capture them. See Chrome’s Network panel guide.
Step 2: Narrow the request list
A modern page may request scripts, stylesheets, fonts, images, analytics, advertisements, and data. To find likely data requests:
- Select the Fetch/XHR resource-type filter to focus on requests commonly used to retrieve or update data.
- Use the filter field to search request URLs for words related to the content or feature you are inspecting.
- Sort by time or size when that helps, and clear the filter to restore the full list.
- Keep the page’s action in mind: a request that appears immediately after a search, tab change, or pagination click is a useful candidate to inspect.
These clues are ways to reduce noise, not guarantees. A site can deliver data in different request types, combine multiple kinds of content, or update a page without a request you can easily recognize. Chrome documents request-type filters and other inspection controls in the Network reference.
Step 3: Reproduce the interaction that reveals the data
With Network still recording, perform the action that makes the target data appear: submit a search, open a tab, expand a section, or move to another page of results. Then compare the new requests with the visible change. The exact request pattern depends on the site.
Step 4: Inspect a promising request
Select a request and review the available details. Pay attention to:
- URL and method: where the request went and whether it used a method such as GET or POST.
- Query parameters or payload: values that may represent a search term, page number, filter, or other input.
- Request headers and cookies: context the server may use to handle the request.
- Response and preview: whether the response contains the data you see on the page.
- Initiator and timing: what triggered the request and when it ran.
Chrome’s request view includes headers, payload, preview, response, initiator, timing, and cookies where available. The Network panel documentation explains those details.
Step 5: Compare the response with Elements
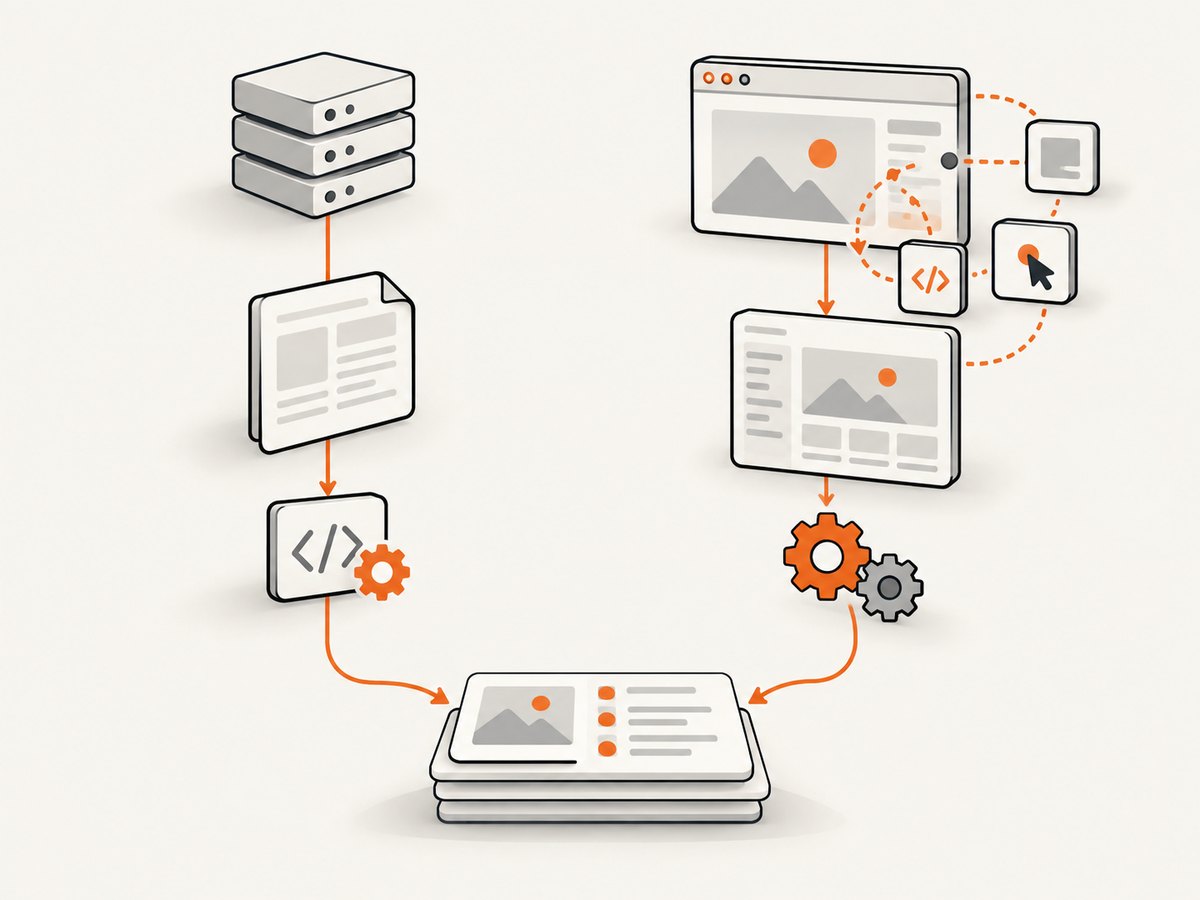
Find the same value in the rendered page using Elements. If the response already contains the information you need, a direct HTTP client and parser may be enough. If the content appears only after client-side JavaScript runs or after a browser interaction, you may need browser automation. This is a practical decision rule; each page has its own behavior.
3. How to filter requests when Network is busy
When the list is crowded, use a repeatable narrowing process instead of trying to identify every request at once:

- Start with Fetch/XHR. This removes many static resources from view.
- Record one action at a time. Reload, wait, then perform one search or click. Note which requests appear at that moment.
- Search the request names. Terms related to the page, feature, query, or data type can help surface candidates.
- Compare responses. Open a likely request and check whether its response has the values or structure you are looking for.
- Check the initiator. This can help distinguish a request tied to the page interaction from unrelated background activity.
- Repeat with another input. Change the search term or page number and see which request values change with it.
Do not assume a request is irrelevant just because its name is unfamiliar, or useful just because it contains a suggestive word. Confirm by comparing its response and timing with the page behavior.
4. Choose between HTTP requests and browser automation
| What you observe | Likely starting point | What to verify |
|---|---|---|
| The initial server response contains the needed content. | HTTP client plus an HTML or response parser | Whether the same response can be fetched reliably with the inputs and headers your use requires. |
| A data response contains the content after a request, and the request can be reproduced appropriately. | HTTP client plus a parser | How query parameters, request body, cookies, and other relevant state vary. |
| Content appears after JavaScript execution or a sequence of browser interactions. | Browser automation may be needed | Which actions, waits, and browser state are necessary to reach a stable page. |
| The page depends on complex session state or visible interaction. | Evaluate browser automation | Whether that state can be reproduced and maintained within your allowed use. |
Browser automation can handle rendered pages and interaction, but it adds browser setup and runtime work. A direct HTTP approach can be simpler when the useful content is already in a response you can request. Neither approach is universally right; choose based on the page, required interaction, resource cost, and maintenance burden.
5. Turn observations into a small Python request
When inspection shows that the page’s initial HTML contains the content, a simple request can help you examine that response. This example uses Python’s requests library and Beautiful Soup. It is a starting point for a permitted target, not a general-purpose scraper:
import requests
from bs4 import BeautifulSoup

url = "https://example.com/"
response = requests.get(
    url,
    headers={"User-Agent": "Research script"},
    timeout=20,
)
response.raise_for_status()

soup = BeautifulSoup(response.text, "html.parser")
print(soup.title.get_text(strip=True) if soup.title else "No title")

for heading in soup.select("h1, h2"):
    print(heading.get_text(" ", strip=True))
Install the dependencies with python -m pip install requests beautifulsoup4. Replace the example URL and selectors with values appropriate to your target. An HTTP response may differ from the page rendered in your browser, so compare it with what you saw in Network and Elements.
When the request you found needs parameters
If the observed request uses query parameters, represent them explicitly and encode them through the client instead of concatenating an unescaped string:
import requests

endpoint = "https://example.com/search"
params = {"q": "sample query", "page": 1}
response = requests.get(endpoint, params=params, timeout=20)
response.raise_for_status()
print(response.url)
print(response.text[:500])
Use only the inputs and request context that are appropriate for your use. Do not copy session credentials into source code or logs. If a request depends on browser state, determine whether a direct client can reproduce that state reliably; otherwise, assess browser automation.
6. DevTools limitations and responsible use
- It is reconnaissance, not a production pipeline. Your application still needs fetching or browser control, parsing, storage, error handling, and maintenance.
- It only shows activity it records. Open Network before reloading and before reproducing the behavior you need to inspect.
- HAR exports have limits. Chrome’s DevTools network API documentation says HAR log data does not include request content by default; a separate content call may be needed. See the network API reference.
- Finding a request does not grant permission. Technical discoverability does not settle a site’s terms, data rights, privacy obligations, or jurisdiction-specific rules. Assess the target and intended use separately.
7. Troubleshooting
| Symptom | Likely cause | What to try |
|---|---|---|
| No useful requests appear. | Network opened after page load, recording stopped, or the relevant action has not happened. | Open Network, confirm recording is active, reload, and reproduce the action. |
| The request list is overwhelming. | All resource types and background activity are visible. | Filter to Fetch/XHR, perform a single action, and compare new requests and their responses. |
| Fetch/XHR shows nothing relevant. | The site may deliver the data in another resource type or as part of initial HTML. | Clear the filter and inspect other requests; also examine the page response and Elements. |
| A request response does not contain visible content. | The response may be an intermediate result, the content may load in another request, or rendering may transform it. | Inspect subsequent requests and initiators, then compare with the rendered DOM. |
| Your Python response differs from Chrome. | The browser and script may be making different requests or carrying different state. | Compare URL, method, parameters, headers, cookies, redirects, and response body. Avoid assuming a browser-only state is stable in a direct client. |
| Some requests are missing from an exported HAR. | HAR log data does not include response content by default. | Use the appropriate content retrieval flow documented by Chrome, or inspect the needed response in DevTools. |
| The content appears only after waiting or clicking. | The page may load data asynchronously or require interaction. | Observe the request triggered by that action; if browser execution is essential, evaluate automation with explicit waits. |
8. Performance, reliability, and cost
DevTools itself is an inspection tool, so its main value is reducing guesswork before implementation. A direct request is often lighter to run than controlling a full browser when the response already provides the needed data. Browser automation can be appropriate when page execution or interaction is required, but it brings additional runtime and state to manage. These are architectural tradeoffs, not measured benchmarks.
For reliability, identify which request carries the data, which inputs change, and what page actions trigger it. Expect site behavior to evolve: request shapes, markup, or timing may change, so a maintained collector needs error handling and periodic review. Use timeouts, inspect HTTP status and response content, and keep parsing separate from fetching so failures are easier to locate.
Cost depends on your own infrastructure and implementation. A direct HTTP workflow may use fewer resources than launching browsers, while browser automation may save development effort when the content depends on rendered interaction. Estimate both runtime and maintenance for your target rather than assuming one is always cheaper.
9. Or skip the browser setup
If your goal is a clean screenshot rather than building a scraper, ScreenshotNeo is a website screenshot API and MCP server. It returns a PNG, JPEG, WebP, or PDF from one GET request. The [docs](https://screenshotneo.com/docs/) cover the API options.
curl -G "https://api.screenshotneo.com/v1/shot" \
  -d access_key=YOUR_API_KEY \
  --data-urlencode url=https://stripe.com \
  -o shot.webp
import requests
r = requests.get(
"https://api.screenshotneo.com/v1/shot",
params={"access_key": "YOUR_API_KEY", "url": "https://stripe.com"},
timeout=90,
)
open("shot.webp", "wb").write(r.content)const q = new URLSearchParams({
access_key: 'YOUR_API_KEY',
url: 'https://stripe.com'
});
const res = await fetch(`https://api.screenshotneo.com/v1/shot?${q}`);
if (!res.ok) throw new Error(`Screenshot request failed: ${res.status}`);
await Bun.write("shot.webp", res);- Cookie banners are accepted and removed, along with known newsletter popups and chat widgets, before the shot; each step can be turned off.
- Bot checks, blank pages, failed loads, timeouts, and cache hits are not billed. Response headers report the page verdict and billing status.
- An MCP server gives AI agents tools for screenshots, page information, and PDF capture.
- The free plan includes 1,000 screenshots per month with no card; paid plans start at $5 for 3,000 shots.
Sign up for 1,000 free screenshots a month, with no card required.
10. FAQ
Is DevTools part of Chrome?
Yes. Chrome DevTools is built into the Chrome browser.
Can I scrape a website directly from DevTools?
DevTools helps inspect the page and its requests. A separate script or browser automation workflow is needed to build and maintain a scraper.
Does an API request found in Network mean I can use it?
No. Discovering a request is a technical observation, not a decision about permission or rights.
Should I use Beautiful Soup or a browser automation tool?
Use an HTTP client and parser when a suitable response contains the content and can be requested reliably. Consider browser automation when JavaScript execution or browser interaction is necessary.
Where can I learn more about scraping techniques?
O’Reilly lists Ryan Mitchell’s Web Scraping with Python, 3rd Edition, published in February 2024, with topics including browser inspection, JavaScript scraping, APIs, and legal and ethics issues: publisher page.


