How to Diagnose and Speed Up Slow Puppeteer Page Loads
Find the real bottleneck in slow Puppeteer loads, measure it, fix it safely, and know when a screenshot API is faster to operate.

Short answer: do not optimize page.goto() first. Measure browser launch, page creation, navigation, the first usable page state, and the action that follows as separate intervals. Then use a trace, Puppeteer metrics, console output, and runtime checks to determine whether the time is spent in Node.js, the browser protocol, the network, page JavaScript and rendering, an overly broad wait, or deployment scheduling.
Puppeteer itself is usually not the bottleneck. Its FAQ says it has “almost zero performance overhead over an automated page,” but that broad statement is not a benchmark for your site or workload. Treat every speed change as a measured experiment.
1. Build a timing breakdown before changing code
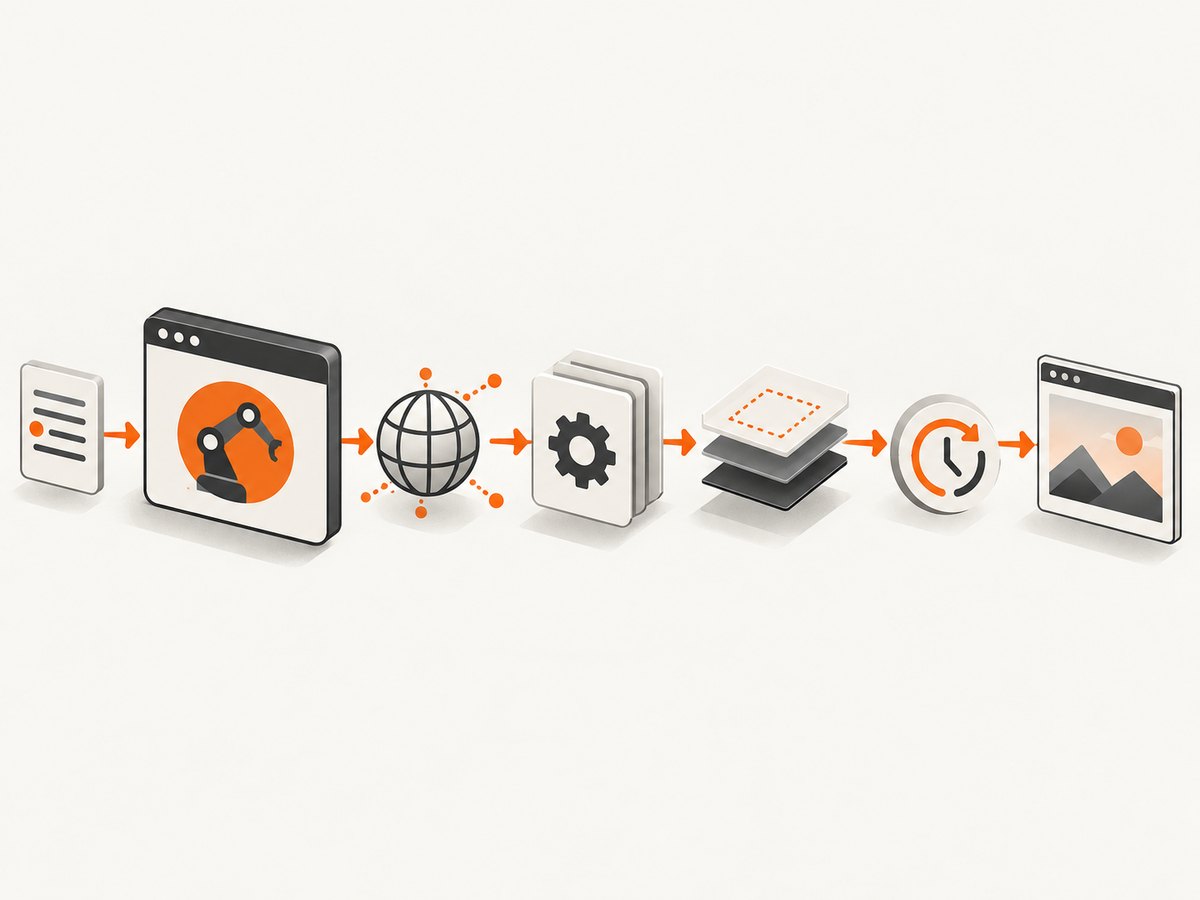
Run the same URL, browser build, Node version, host, cache condition, and headless mode repeatedly. Record at least these segments:
| Segment | What it can reveal |
|---|---|
| Browser launch | Cold startup, executable discovery, container limits, or process contention |
| Page creation | Context and target setup overhead |
| Navigation | DNS, TLS, server response, redirects, subresources, and document work |
| First required state | An element, URL transition, or application condition your next step needs |
| Action or extraction | Selectors, event handlers, JavaScript, layout, and serialization |
import puppeteer from 'puppeteer';

const url = 'https://example.com';
const t0 = performance.now();
const browser = await puppeteer.launch();
const t1 = performance.now();
const page = await browser.newPage();
const t2 = performance.now();
await page.goto(url);
const t3 = performance.now();
await page.locator('h1').wait();
const t4 = performance.now();
const title = await page.title();
const t5 = performance.now();

console.table({
  launchMs: t1 - t0,
  newPageMs: t2 - t1,
  gotoMs: t3 - t2,
  requiredStateMs: t4 - t3,
  extractionMs: t5 - t4,
  totalMs: t5 - t0,
  title,
});
await browser.close();
This breakdown prevents a common mistake: reducing a wait by 500 ms when browser startup consumes 8 seconds, or tuning Chromium when the page is spending most of its time running application JavaScript.
2. Separate Node.js, browser, and page causes
Puppeteer’s debugging guide divides failures and slowness into server-side Node.js code, browser-side client code, and browser-internal behavior. Start with observations that do not alter the workload:
page.on('console', message => {
  console.log(`[page:${message.type()}] ${message.text()}`);
});
page.on('pageerror', error => {
  console.error('[pageerror]', error);
});
page.on('requestfailed', request => {
  console.warn('[requestfailed]', request.url(), request.failure()?.errorText);
});
Run headful temporarily if seeing the page clarifies what is happening. Remove slowMo from performance measurements: it intentionally inserts a delay into Puppeteer operations for debugging. If a call appears stuck, inspect pending protocol errors:
const pending = browser.debugInfo?.pendingProtocolErrors;
if (pending?.length) console.dir(pending, { depth: null });
For protocol-level diagnostics, Puppeteer documents NODE_DEBUG="puppeteer:*". Logs can contain sensitive URLs, headers, or page data, so collect them only where that exposure is acceptable.
3. Capture a trace and find the dominant work
A timeline trace is the most useful documented way to see what the browser is doing during a slow interval. Start tracing immediately before the navigation or action and stop immediately after. Open the resulting JSON in Chrome DevTools or a compatible timeline viewer. Only one trace can be active per browser.
import puppeteer from 'puppeteer';

const browser = await puppeteer.launch();
const page = await browser.newPage();
await page.tracing.start({ path: 'slow-load-trace.json' });
try {
  await page.goto('https://example.com');
  await page.locator('main').wait();
} finally {
  await page.tracing.stop();
  await browser.close();
}
Inspect the exact interval represented by your timing table. Look for long network gaps, long script tasks, repeated style recalculation, layout work, or idle time caused by your own synchronization. Puppeteer’s tracing API and performance guidance describe traces as a way to diagnose browser performance issues; they do not provide a universal “fast” threshold.
4. Use metrics as evidence, not as a verdict
page.metrics() can show:
JSHeapTotalSizeandJSHeapUsedSizein bytes.TaskDurationandScriptDuration.LayoutDurationandRecalcStyleDuration.Nodes,Documents,Frames, andJSEventListeners.- Layout and style recalculation counts.
const before = await page.metrics();
await page.goto('https://example.com');
const after = await page.metrics();

for (const key of ['TaskDuration', 'ScriptDuration', 'LayoutDuration', 'RecalcStyleDuration', 'Nodes', 'Documents', 'Frames']) {
  console.log(key, { before: before[key], after: after[key] });
}
A large node count or heap does not prove causation. Compare metrics around the same workload and confirm the suspected work in a trace. For example, high ScriptDuration combined with long main-thread tasks supports investigating page JavaScript; high navigation time with little script work points toward network, server response, redirects, or a wait condition.
5. Synchronize on the state your next operation needs
Choose a condition that matches the transition. If a click causes a real navigation, register the navigation wait before clicking:
const [response] = await Promise.all([
  page.waitForNavigation(),
  page.click('a.my-link'),
]);
console.log('navigation response:', response?.status() ?? 'history or anchor navigation');
The response may be null for history or anchor navigation. Puppeteer also treats History API URL changes as navigation. For an element or application state, use a locator or selector condition instead of waiting for an arbitrary number of milliseconds:
await page.goto('https://example.com');
await page.locator('[data-testid="results"]').wait();

// Lower-level alternative when you only need selector presence:
await page.waitForSelector('.results');
Locators can wait for presence, visibility, and action readiness, including a stable bounding box where relevant. waitForSelector is lower-level and does not automatically retry the action you perform afterward. A shorter wait is only an optimization if the following operation still sees the intended state.
6. Diagnose the page work itself
When traces show page JavaScript or rendering as the dominant interval, investigate the page rather than Puppeteer. Look for long synchronous tasks, scripts that repeatedly mutate the DOM, expensive layout, large client-side data processing, and resources that block the first useful state. Make one change at a time and measure the same segment again.
When traces show network time, inspect redirects, slow server responses, third-party requests, and resources required before your target state appears. Do not assume that a different waitUntil setting is always faster: the correct setting depends on whether your task needs a document transition, a particular element, or application data. The sources reviewed for this guide do not establish one universally fastest setting.
When protocol calls are stuck, check for pending protocol errors and collect focused protocol logs. A page console error can explain an application that never reaches the selector you are waiting for; a failed request can explain a spinner that never resolves.
7. Verify Node, Chromium, and deployment compatibility
Record the versions for every comparison. Current Puppeteer system requirements list Node 22.12 or newer and supported Chrome for Testing platforms. Puppeteer says it is only guaranteed to work with its bundled browser, so avoid silently switching to an unrelated system Chromium while diagnosing a regression. See the system requirements and launch options documentation for the version you use.
Deployment scheduling can look like browser slowness. Puppeteer’s troubleshooting guide documents a Cloud Run case: CPU is disabled by default after an HTTP response is written, so work started after responding can appear extremely slow. Finish Puppeteer work before sending the response, or enable always-allocated CPU when your design genuinely requires background work. Apply this diagnosis only to deployments with that CPU behavior.
8. A repeatable optimization checklist
- Write down URL, browser build, Node version, host, headless mode, cache state, and concurrency.
- Measure launch, page creation, navigation, required state, and action separately.
- Capture page console, page errors, failed requests, and pending protocol errors.
- Trace the slow interval.
- Compare
page.metrics()before and after the interval. - Classify the dominant work as startup, network, page script, layout, synchronization, protocol, or deployment scheduling.
- Change one relevant variable.
- Repeat enough runs to distinguish a consistent change from cache or host noise.
- Confirm correctness: the screenshot, extraction, or click still represents the intended page state.
9. Or skip the browser setup
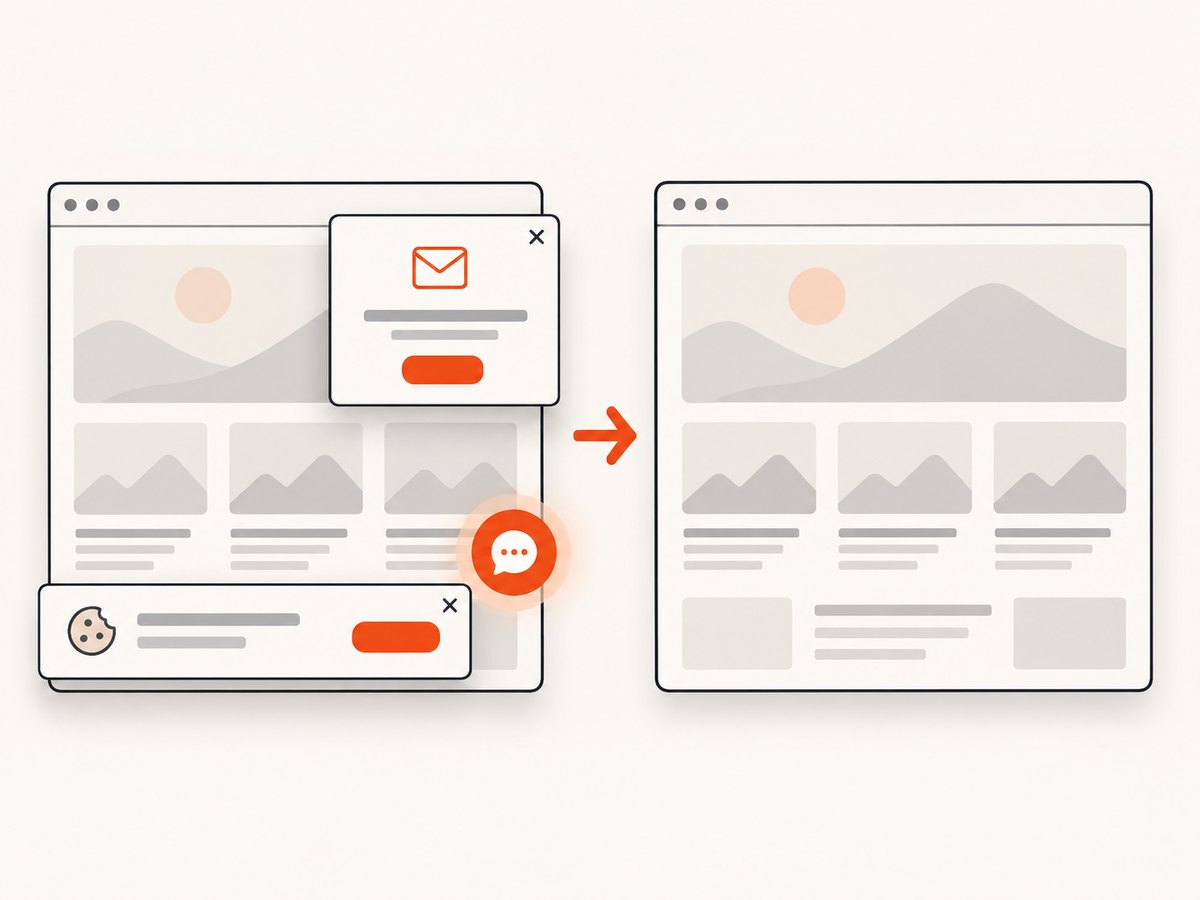
If your end goal is a reliable screenshot rather than browser control, ScreenshotNeo provides a single request to capture a URL as PNG, JPEG, WebP, or PDF. Its capture pipeline accepts cookie and consent banners like a visitor, then removes more than 60 known consent platforms, newsletter popups, and chat widgets. Each step can be turned off. Only clean shots are billed: bot checks and CAPTCHAs, blank pages, timeouts, failed loads, and cache hits cost nothing, and response headers identify the page verdict and billing status.
Use the ScreenshotNeo API documentation for all options. The basic request is:
cURL
curl -G "https://api.screenshotneo.com/v1/shot" -d access_key=YOUR_API_KEY --data-urlencode url=https://stripe.com -o shot.webpPython
import requests

r = requests.get(
    "https://api.screenshotneo.com/v1/shot",
    params={"access_key": "YOUR_API_KEY", "url": "https://stripe.com"},
    timeout=90,
)
r.raise_for_status()
open("shot.webp", "wb").write(r.content)
Node.js
const q = new URLSearchParams({ access_key: 'YOUR_API_KEY', url: 'https://stripe.com' });
const res = await fetch(`https://api.screenshotneo.com/v1/shot?${q}`);
if (!res.ok) throw new Error(`Screenshot failed: ${res.status}`);
const bytes = Buffer.from(await res.arrayBuffer());
require('fs').writeFileSync('shot.webp', bytes);
ScreenshotNeo also supports full-page capture with lazy images loaded, CSS element capture, dark mode, 12 device presets or any viewport, retina scale, PDF paper size and page ranges, custom CSS and JavaScript, clicks, selector waits, delays, network-idle waits, request and resource blocking, custom headers and cookies, user agents, Authorization, timezone and geolocation, transparent backgrounds, resizing, configurable cache TTL, signed image links, asynchronous jobs with signed webhooks, bulk capture of 100 URLs per call, a usage API, and an OpenAPI specification. Parameter names used by other screenshot APIs work as well.
For AI workflows, its MCP server exposes take_screenshot, get_page_info, and capture_pdf to Claude, Cursor, and other MCP clients. Free usage includes 1,000 shots per month without a card; paid plans start at $5 for 3,000 shots. Create an account at ScreenshotNeo free sign-up.
10. Performance, reliability, and cost considerations
Keep browser instances warm only when your workload benefits from it, and measure launch separately so you know whether reuse helps. Bound navigation and state waits with realistic timeouts, but preserve enough time for the slowest legitimate page state. Record failures by category instead of treating every timeout as a page problem.
For Puppeteer, cost is mainly your runtime, browser capacity, and engineering time. A faster wait that produces incomplete data creates retries and hidden cost. For ScreenshotNeo, cache hits and failed or unusable captures are not billed, and the X-Page-Verdict and X-Billed headers let you reconcile outcomes. Select a plan from measured volume rather than an assumed benchmark; yearly billing gives two months free.
11. Troubleshooting common symptoms
| Symptom | Likely cause | Fix |
|---|---|---|
page.goto() consumes most time |
Network, redirects, server response, or document work | Trace navigation; inspect failed requests and server timing; compare the same URL and cache state. |
| Navigation wait never resolves | The click triggered an SPA or anchor transition, or the action and wait were ordered incorrectly | Start waitForNavigation() and the click together; use a locator or application condition for SPA state. |
| Selector wait times out | Page JavaScript failed, selector is wrong, or the required state is different | Capture console and page errors; verify the selector; trace the interval and choose the actual readiness condition. |
| Protocol call appears frozen | Pending protocol error or browser communication issue | Inspect debugInfo.pendingProtocolErrors and enable focused NODE_DEBUG="puppeteer:*" logging. |
| Runs became slow after deployment | Node/browser mismatch, cold startup, or CPU throttling | Check Node 22.12+ and bundled-browser compatibility; on Cloud Run, finish work before responding or configure always-allocated CPU. |
| Measured optimization is slower | slowMo, changed cache, host noise, or a different workload |
Remove debugging delays and repeat under recorded, consistent conditions. |
FAQ
Is Puppeteer inherently slow?
No. The official FAQ describes almost zero performance overhead over an automated page, but your page, waits, browser build, and runtime determine the observed time.
Should I always use waitUntil: 'networkidle0'?
No universal setting is fastest or correct. Synchronize on the transition or page condition the next operation actually needs.
Can metrics replace a trace?
No. Metrics quantify heap, tasks, scripts, layout, styles, and counts; a trace shows when the work happened and what dominated the interval.
Why does a history change produce no response?
History API and anchor navigation can resolve navigation with a null response. Wait for the URL or application state you need.
When should I use an API instead of Puppeteer?
Use an API when you need repeatable screenshots or PDFs and do not need direct browser interaction. Use Puppeteer when you need arbitrary in-browser control, custom debugging, or a workflow beyond capture.


