How to Email Charts Without Relying on Screenshots
Export charts directly, then choose an inline image, attachment, PDF, or link that fits your recipients and accessibility needs.
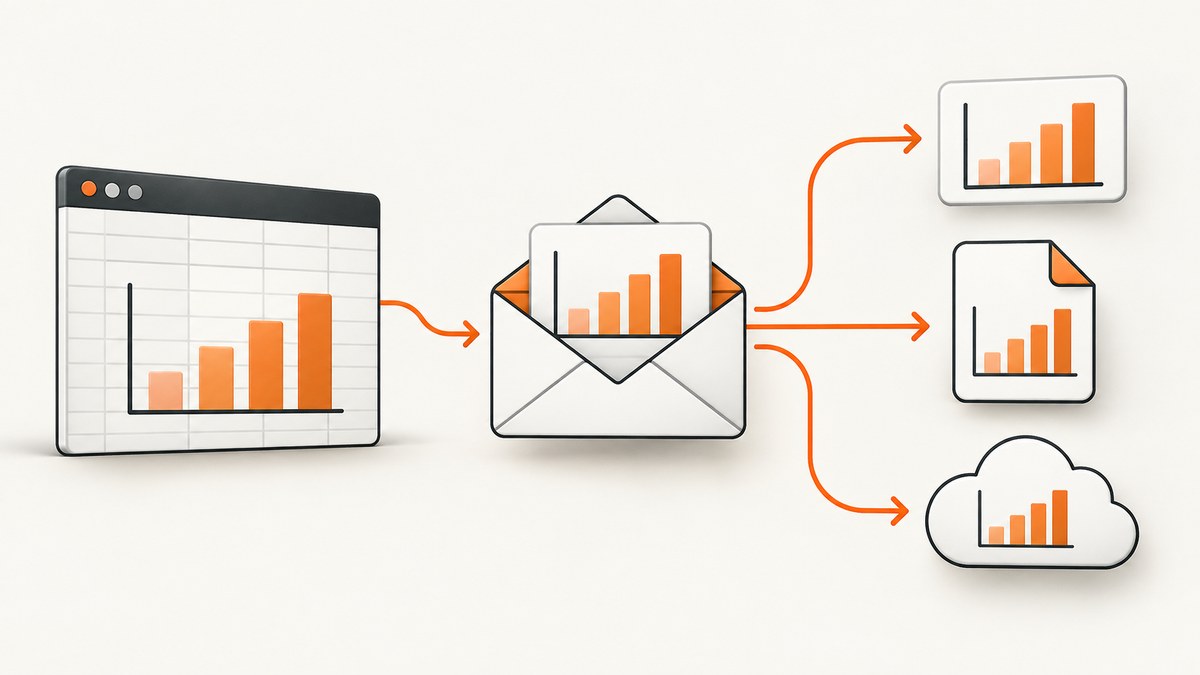
Short answer: export the chart from its source application, then insert the export inline, attach it, or share a permissioned cloud link. Google Sheets supports SVG, PNG, and PDF chart downloads. Outlook supports inline pictures, attachments, and OneDrive links. Add the chart’s conclusion and important values as ordinary text so the image is not the only way to understand the message.
Choose the right delivery method
| Method | Use it when | Tradeoffs |
|---|---|---|
| Inline PNG | The chart should be visible as the message opens and easy to scan. | Static image; include a textual takeaway and exact values where useful. |
| Attached PNG, SVG, or PDF | The recipient should open, save, zoom, or print a separate file. | The reader must open the attachment. Google Sheets documents these export formats. |
| Cloud link | The source document must remain available or continue receiving updates. | Access depends on sharing permissions and recipient access. |
| Linked or embedded Excel object | Your organization uses a supported Outlook and Office object workflow. | Version and recipient behavior affect the result. |
These are workflow recommendations based on the documented export and delivery options. They are not a guarantee that every email client renders every format identically. Test business-critical messages in the clients your recipients use.
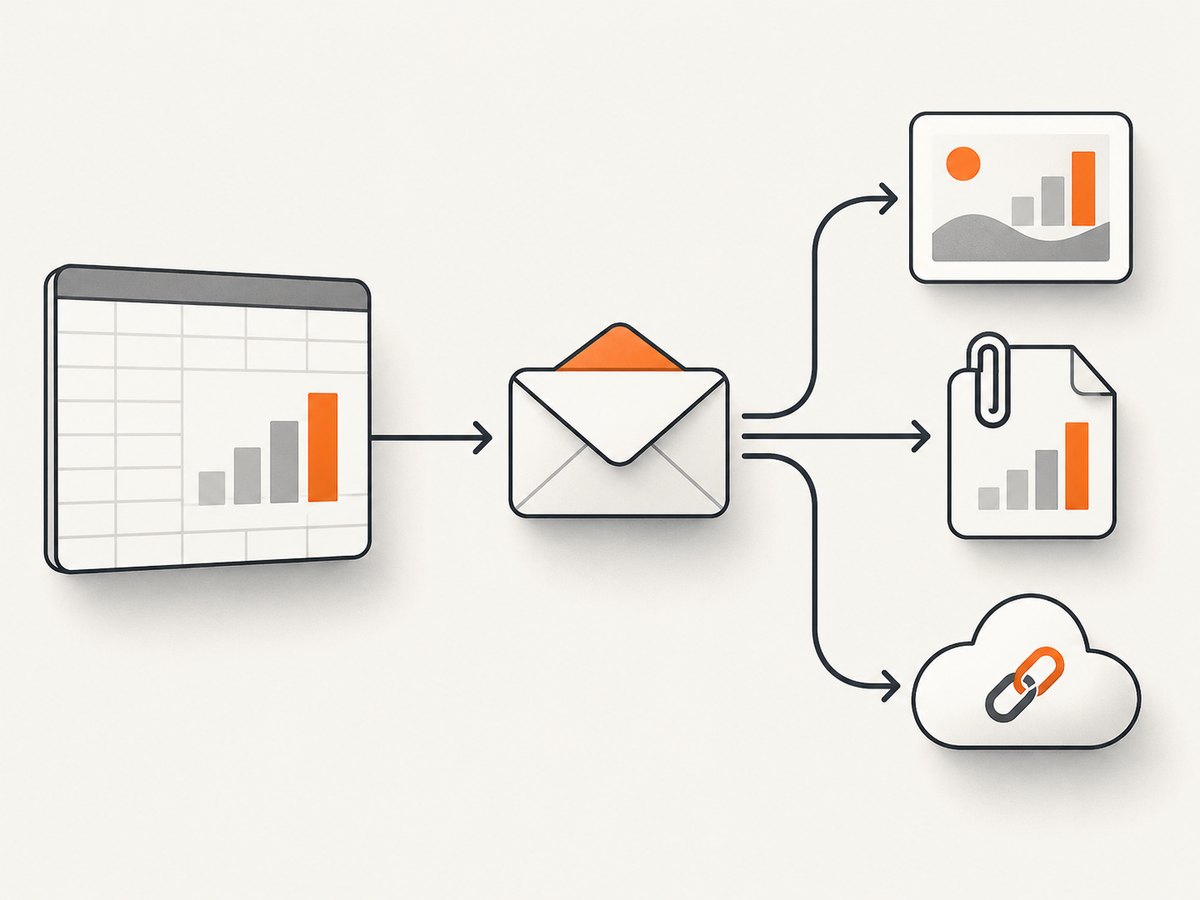
1. Export the chart from its source
Google Sheets
- Open the spreadsheet containing the chart.
- Open the chart menu and choose the download or save option.
- Select SVG, PNG, or PDF, depending on how recipients will use it. Google documents all three chart download formats in Save or publish your chart.
- Give the file a descriptive name, such as
q3-revenue-by-region.png.
Use PNG for a broadly compatible inline image, SVG when recipients need a scalable graphic and their mail flow supports it, and PDF when preserving a document-like copy matters.
Other chart applications
Use the application’s native export rather than photographing the screen. Native exports preserve the chart area and avoid browser chrome, window borders, cursor artifacts, and accidental personal information.
2. Put the chart in the email
Inline image in Outlook
- Start a new message and place the cursor where the chart should appear.
- Choose Insert > Pictures, then select the exported image.
- Add a short sentence before or after it explaining the finding.
- Keep the original export if someone may need the full-resolution file.
Microsoft’s Outlook instructions cover inline pictures, attachments, and OneDrive sharing: Add pictures or attach files to emails in Outlook. Microsoft summarizes the distinction this way: “Attachments always appear above the body of your message, but you can insert pictures inline anywhere in your message.”
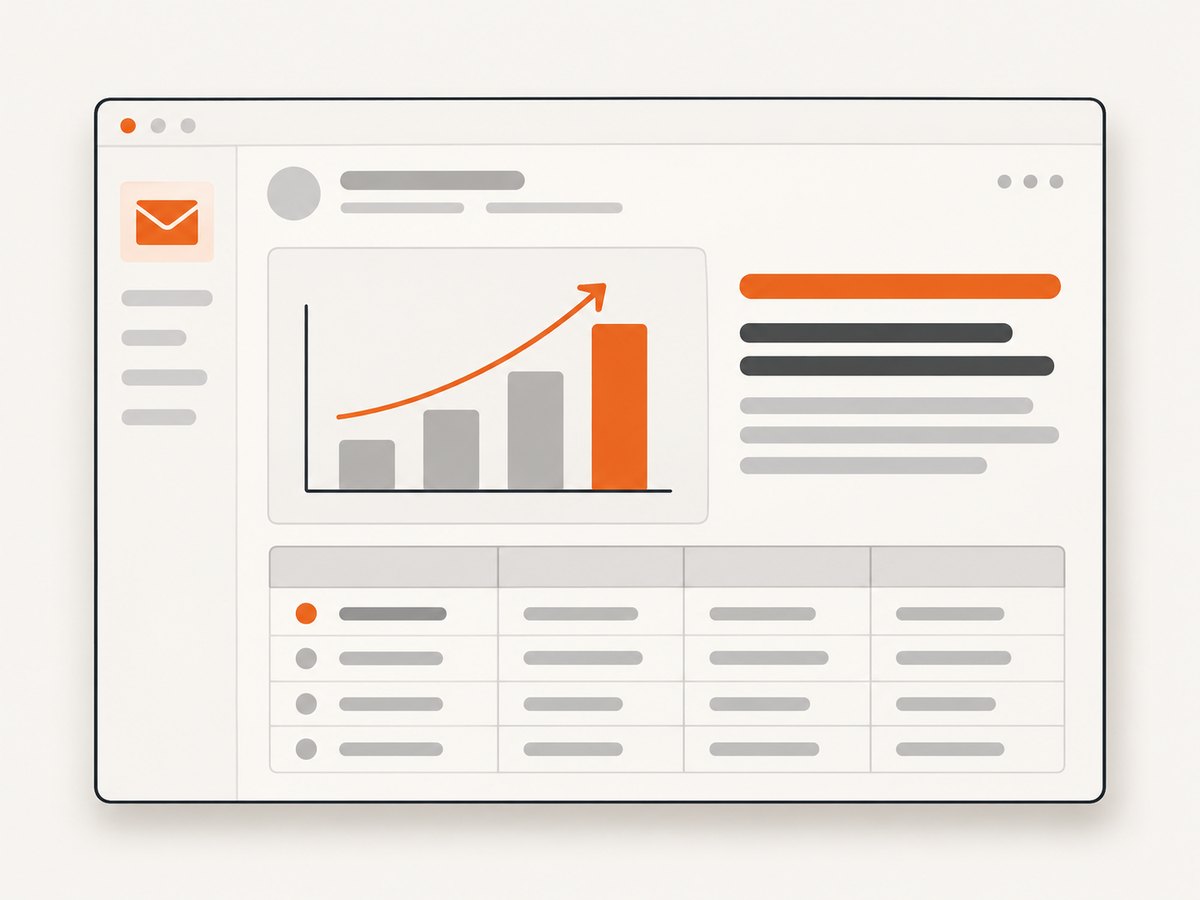
Attach the export
Attach the PNG, SVG, or PDF when the recipient needs to download, archive, print, or inspect it separately. Mention the file type in the message so the recipient knows what to expect.
Share a OneDrive or other cloud link
- Upload or save the source file in the intended cloud location.
- Set permissions for the actual recipients.
- Paste the link into the message and state whether it is view-only or editable.
- Open the link in a private window or an account that represents a recipient to verify access.
Outlook may warn when recipients cannot view a linked file and can offer attaching a copy. If access is uncertain, attach an export as a fallback.
3. Preserve the meaning in accessible text
Do not make the chart image the only carrier of the message. Write the conclusion in plain language and include key values in text or a small table when exact numbers matter. For example:
Q3 revenue increased 18% versus Q2, led by North America (+24%).
North America: $420,000 | Europe: $280,000 | APAC: $190,000
This matters because a raster chart may not contain the textual and visual metadata needed for equivalent exploration by blind and low-vision readers. The Chart4Blind research discusses exports such as SVG, CSV, and alternative text: Chart4Blind.
For automated mail, provide both HTML and plain-text alternatives when your mail system supports them. Microsoft Graph documents MIME messages with alternative content and attachments with inline or attachment dispositions: Get MIME content of a message using the Outlook mail API.
4. Automate recurring chart emails
For scheduled Excel reporting, Microsoft provides an Office Scripts sample that emails chart and table images through the Office 365 Outlook connector. Treat it as a sample workflow and adapt it to your tenant and automation environment: Email the images of an Excel chart and table.
A reliable automation should:
- Export from the source workbook or sheet after data refresh completes.
- Use a deterministic filename containing the report period.
- Include the key finding and values as text.
- Attach the export or provide a tested fallback link.
- Record delivery failures and permission errors for follow-up.
5. When a screenshot is still useful
A screenshot can be appropriate when the chart exists only in a rendered web page, when you need the surrounding page context, or when no export function is available. Capture only the chart region when possible, wait for data and fonts to finish loading, and check the result for cookie banners, chat widgets, and bot checks before sending it.
Or skip the browser setup
If the chart is published on a URL, ScreenshotNeo can return a clean PNG, JPEG, WebP, or PDF with one request. The API accepts options for full-page capture, a CSS-element selector, dark mode, device or custom viewport, retina scale, custom CSS and JavaScript, clicks, selector or network-idle waits, hidden selectors, blocked ads/trackers/requests/resource types, headers, cookies, user agents, authorization, timezone, geolocation, transparent backgrounds, resizing, caching, signed links, asynchronous jobs, webhooks, bulk capture, and PDF paper size, margins, landscape mode, and page ranges. Use only the options your chart page needs.
Cookie banners, newsletter popups, and chat widgets are removed before the shot. Bot checks, blank pages, failed loads, timeouts, and cache hits are not billed, and response headers identify the page verdict and billing status. The MCP server includes take_screenshot, get_page_info, and capture_pdf for Claude, Cursor, and other MCP clients.
See the ScreenshotNeo documentation for all parameters.
cURL
curl -G 'https://api.screenshotneo.com/v1/shot' \
  -d access_key=YOUR_API_KEY \
  --data-urlencode url=https://example.com/chart \
  -o chart.webp
Python
import requests

r = requests.get(
    'https://api.screenshotneo.com/v1/shot',
    params={'access_key': 'YOUR_API_KEY', 'url': 'https://example.com/chart'},
    timeout=90,
)
r.raise_for_status()
open('chart.webp', 'wb').write(r.content)
Node.js
const q = new URLSearchParams({
  access_key: 'YOUR_API_KEY',
  url: 'https://example.com/chart'
});
const res = await fetch(`https://api.screenshotneo.com/v1/shot?${q}`);
if (!res.ok) throw new Error(`Screenshot failed: ${res.status}`);
const fs = await import('node:fs/promises');
await fs.writeFile('chart.webp', Buffer.from(await res.arrayBuffer()));
ScreenshotNeo has a free plan with 1,000 screenshots per month and no card. Paid plans start at $5 for 3,000 screenshots; yearly billing gives two months free, and every feature is available on every plan. Create a free ScreenshotNeo account.
Troubleshooting
| Problem | Likely cause | Fix |
|---|---|---|
| The chart is missing from the email | The file was attached instead of inserted inline, or the message format changed. | Use Outlook’s picture insertion command and verify the message in the sent folder. |
| Recipients cannot open the link | Cloud permissions require an account or exclude the recipients. | Adjust sharing permissions, verify with a recipient-like account, or attach an export. |
| The image looks blurry | The export was resized or a low-resolution raster was used. | Export at a larger size, use SVG where supported, or attach a PDF. |
| Numbers are unclear to screen-reader users | The chart image carries meaning that is absent from the message text. | Add the takeaway and key values as text and provide source data or an accessible representation. |
| ScreenshotNeo returns a bot-check or blank result | The page did not load usable chart content. | Inspect the X-Page-Verdict and X-Billed headers, then use waits, headers, cookies, a user agent, or a selector for the chart. |
| ScreenshotNeo captures the page before the chart appears | Chart rendering is asynchronous. | Wait for a chart selector, network idle, or a suitable delay before capture. |
Performance, reliability, and cost
- Export first: native chart exports avoid browser rendering time and usually produce smaller, predictable files.
- Choose the smallest sufficient format: inline PNG is convenient; PDF or SVG preserves detail for readers who need to zoom.
- Links reduce duplication: use them when the source changes, but verify permissions and retain an attachment fallback for important mail.
- Automations need observability: log export, upload, permission, and delivery failures separately.
- ScreenshotNeo billing: only clean shots are billed; bot checks, blank pages, timeouts, failed loads, and cache hits cost nothing. Cache with a TTL when the chart does not change frequently.
FAQ
Should I send PNG or PDF?
Use PNG when the chart should be visible immediately. Use PDF when recipients may print, zoom, or preserve a document-like copy.
Can I send the original spreadsheet?
Yes, when recipients need the underlying data or shared updates. Confirm that permissions and editing rights match your intent.
Will an inline chart look identical everywhere?
No universal guarantee exists across clients, versions, recipient policies, and message formats. Test important messages in the delivery paths you support.
What should accompany a chart?
A one-sentence conclusion, key values in text or a table, and a link or attachment to the source when readers need more detail.
Primary sources
- Microsoft Support: Add pictures or attach files to emails in Outlook
- Google Docs Editors Help: Save or publish your chart
- Microsoft Support: Insert an object in Word or Outlook
- Microsoft Support: Block external images in Outlook
- Microsoft Learn: Get MIME content of a message
- Microsoft Learn: Email Excel chart and table images
- Chart4Blind accessibility research


