How to Export an AmCharts Table to PDF
Export amCharts 4 or 5 charts with their data tables to polished PDFs, with column control, page settings, troubleshooting, and automation options.
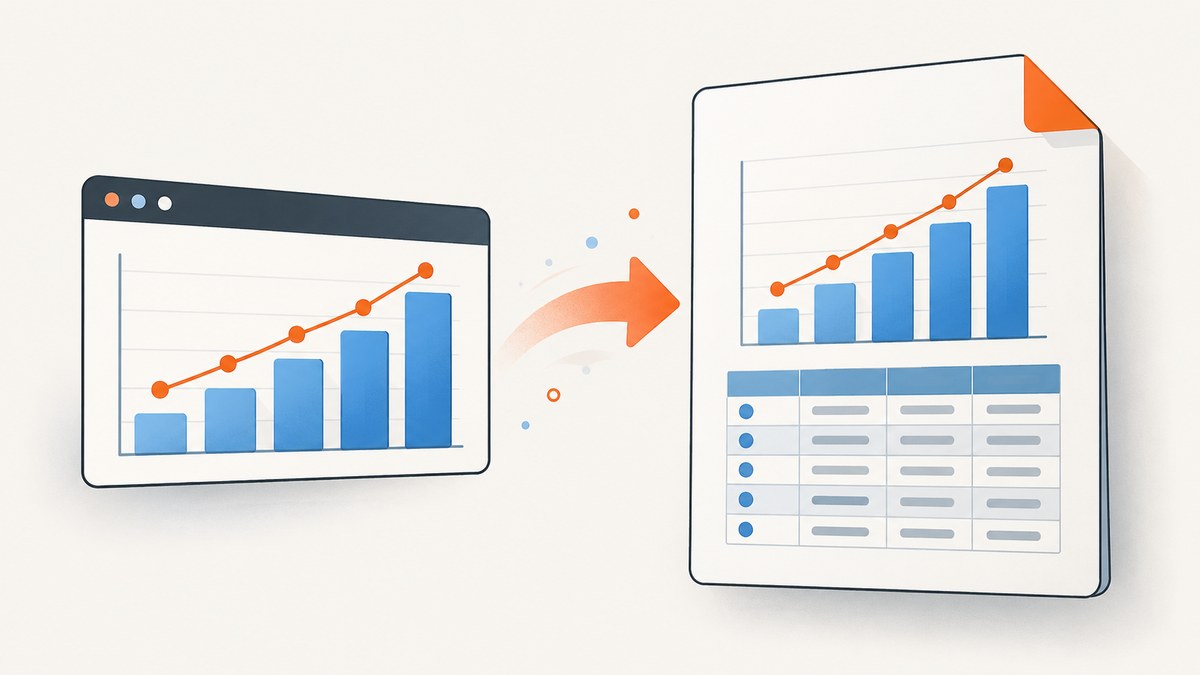
To export an amCharts table to PDF, use the chart library’s Exporting feature and explicitly enable the data table. In amCharts 5, create an Exporting instance with a populated dataSource and set pdfOptions.includeData to true. In amCharts 4, call chart.exporting.export("pdf", { addData: true }). Column names, order, paper size, orientation, and margins are all configurable.
This guide covers both versions, complete runnable examples, page layout, column selection, custom PDF definitions, browser security problems, automation, and an API alternative when you do not want to maintain a browser export pipeline.
How amCharts PDF export works
amCharts renders the chart and then builds a PDF document. The document can contain the chart image, a data table, a title, and a source URL. The table is not automatically guaranteed: you must supply export data in amCharts 5 and enable table output in the PDF options. The export runs in the browser, so the page must be fully initialized before you invoke it.
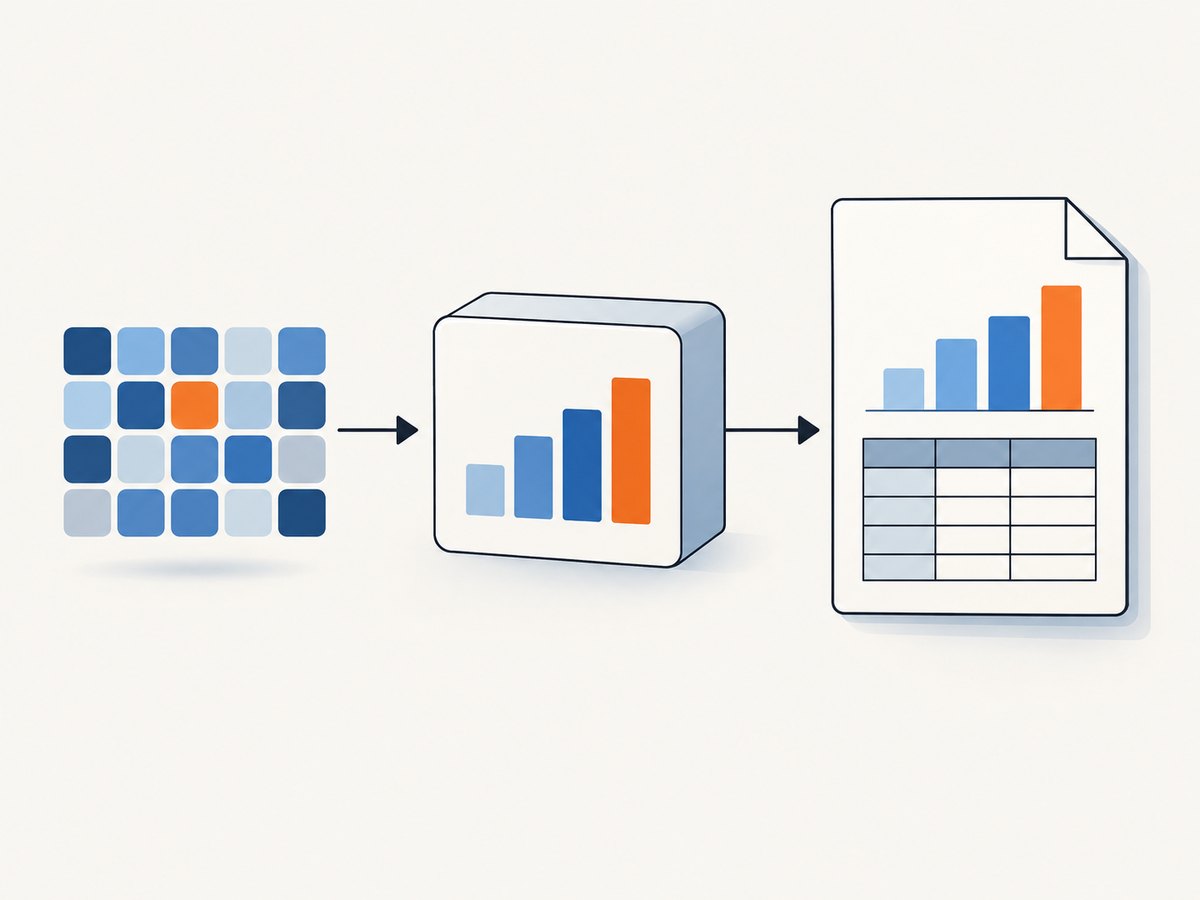
There are two materially different APIs:
| Version | Export API | Include table | Column control |
|---|---|---|---|
| amCharts 5 | plugins/exporting Exporting class |
pdfOptions.includeData: true |
dataFields, dataFieldsOrder |
| amCharts 4 | chart.exporting.export("pdf", options) |
addData: true |
Chart data fields and export options |
Export an amCharts 5 table to PDF
amCharts 5 uses the Exporting plugin. Install or load @amcharts/amcharts5/plugins/exporting (or the browser build), then create an Exporting object. The dataSource array is the source used for data-related exports.
Minimal amCharts 5 example
import * as am5 from "@amcharts/amcharts5";
import * as am5xy from "@amcharts/amcharts5/xy";
import * as am5plugins_exporting from "@amcharts/amcharts5/plugins/exporting";

const root = am5.Root.new("chartdiv");
const chart = root.container.children.push(
  am5xy.XYChart.new(root, {})
);

const data = [
  { category: "Q1", value: 120, target: 100 },
  { category: "Q2", value: 145, target: 120 },
  { category: "Q3", value: 132, target: 130 }
];

const xAxis = chart.xAxes.push(am5xy.CategoryAxis.new(root, {
  categoryField: "category",
  renderer: am5xy.AxisRendererX.new(root, {})
}));
xAxis.data.setAll(data);

const yAxis = chart.yAxes.push(am5xy.ValueAxis.new(root, {
  renderer: am5xy.AxisRendererY.new(root, {})
}));

const series = chart.series.push(am5xy.ColumnSeries.new(root, {
  xAxis,
  yAxis,
  categoryXField: "category",
  valueYField: "value"
}));
series.data.setAll(data);

const exporting = am5plugins_exporting.Exporting.new(root, {
  menu: am5plugins_exporting.ExportingMenu.new(root, {}),
  dataSource: data,
  title: "Quarterly performance",
  pdfOptions: {
    includeData: true,
    pageSize: "LETTER",
    pageOrientation: "landscape",
    pageMargins: [20, 20, 20, 40]
  }
});
The official amCharts 5 exporting documentation describes PDF output as a pdfmake document containing the chart image and/or data table, plus elements such as a title and source URL. See the amCharts 5 exporting guide.
Select and rename columns
Use dataFields to choose the properties that appear and to provide human-readable headings. Use dataFieldsOrder when the object’s insertion order is not the order you want in the PDF.
const exporting = am5plugins_exporting.Exporting.new(root, {
  dataSource: data,
  dataFields: {
    category: "Period",
    value: "Actual",
    target: "Target"
  },
  dataFieldsOrder: ["category", "value", "target"],
  pdfOptions: {
    includeData: true,
    pageSize: "A4",
    pageOrientation: "landscape",
    pageMargins: [24, 24, 24, 36]
  }
});
Keep field names aligned with the keys in every row of dataSource. If one row uses amount and another uses value, the resulting column can be empty or inconsistent. Normalize the array before creating the exporter.
Page size, orientation, and margins
pageSizecontrols the paper format, such as"A4"or"LETTER".pageOrientationaccepts"portrait"or"landscape". Landscape is usually easier to read when the table has several columns.pageMarginsis an array in the order left, top, right, bottom. Increase the bottom margin when you add a footer or source line.
Modify the PDF definition
For advanced layouts, listen for pdfdocready. The event exposes the pdfmake document definition before the download. This is useful for adding headers, footers, widths, or custom content without rebuilding the export pipeline.
exporting.events.on("pdfdocready", (event) => {
  const docDefinition = event.doc;
  docDefinition.footer = (currentPage, pageCount) => ({
    text: `Page ${currentPage} of ${pageCount}`,
    alignment: "center",
    margin: [0, 10, 0, 0]
  });
});
amCharts 5.18.0 began bundling pdfmake 0.3 instead of 0.2. If your code reaches into pdfmake directly, check compatibility when upgrading.
Export an amCharts 4 table to PDF
amCharts 4 exposes PDF export through the chart’s built-in exporting object. Set addData to include the data table and addColumnNames to include the header row.
chart.exporting.export("pdf", {
  addData: true,
  addColumnNames: true,
  addURL: false
});
addURL controls whether the source page URL is printed in the PDF header. Set it to true when provenance matters, or false for a cleaner report.
Add an export menu
chart.exporting.menu = new am4core.ExportMenu();The menu gives users a browser control for choosing PDF export. You can still call chart.exporting.export from your own button, scheduled action, or application workflow.
Controlling amCharts 4 columns
amCharts 4 derives table columns from the chart’s data fields and series configuration. Give each series a clear name, ensure the category field is present in every row, and remove display-only fields before export if they should not appear. If a column is missing, inspect the series’ categoryXField, valueYField, and the keys in chart.data.
Make the export reliable
- Wait until the chart has data and has rendered. Triggering export immediately after constructing the chart can produce an empty image or table.
- Use an HTTP(S) development server. A page opened with
file:///can fail because browser security rules differ from a normal origin. - Load images from hosts that allow them to be used by the canvas. Cross-origin images can taint the canvas, causing images to be omitted or export options to fail.
- Keep table data separate from display formatting. Store numbers as numbers and apply labels through
dataFieldsor chart formatting. - Test long values and many rows. Wide tables may need landscape orientation, smaller margins, or a custom pdfmake definition.
Common errors and fixes
| Symptom | Likely cause | Fix |
|---|---|---|
| PDF has a chart but no table | Table inclusion is disabled | Set includeData: true in amCharts 5 or addData: true in amCharts 4. |
| Table is completely empty | Missing or empty data source | Verify that amCharts 5 receives a populated dataSource; verify chart.data in v4. |
| Wrong column order | Object order differs from report order | Set dataFieldsOrder in v5 and check series field definitions in v4. |
| Headers are cryptic | Raw property names are being used | Map fields with dataFields, for example { value: "Revenue" }. |
| Images disappear | Cross-origin or tainted canvas image | Serve images with appropriate cross-origin access, proxy them through your origin, or remove them from the chart before export. |
| Export fails on a local file | Page opened with file:/// |
Run a local HTTP server and open the page through http://localhost. |
| PDF is too wide | Too many columns for portrait paper | Use landscape, a larger page size, narrower margins, or fewer fields. |
| Export runs before data appears | Asynchronous data loading | Enable the export control after the data promise resolves and the chart has rendered. |
Automate amCharts PDF exports
For a one-off report, a browser button is enough. For scheduled exports, run the page in a controlled browser session, wait for a chart-ready marker, then invoke the same exporting API. Keep the data endpoint deterministic, set a maximum wait time, and record whether the browser reached the export step. If you need server-side image or PDF capture rather than amCharts’ own document generation, a screenshot API can remove browser setup from your application.
Or skip the browser setup
ScreenshotNeo is a website screenshot API and MCP server. It can capture a rendered report page as PNG, JPEG, WebP, or PDF after your amCharts code has produced the table.
curl -G "https://api.screenshotneo.com/v1/shot" -d access_key=YOUR_API_KEY --data-urlencode url=https://stripe.com -o shot.webpimport requests
r = requests.get("https://api.screenshotneo.com/v1/shot", params={"access_key": "YOUR_API_KEY", "url": "https://stripe.com"}, timeout=90)
open("shot.webp", "wb").write(r.content)const q = new URLSearchParams({ access_key: 'YOUR_API_KEY', url: 'https://stripe.com' });
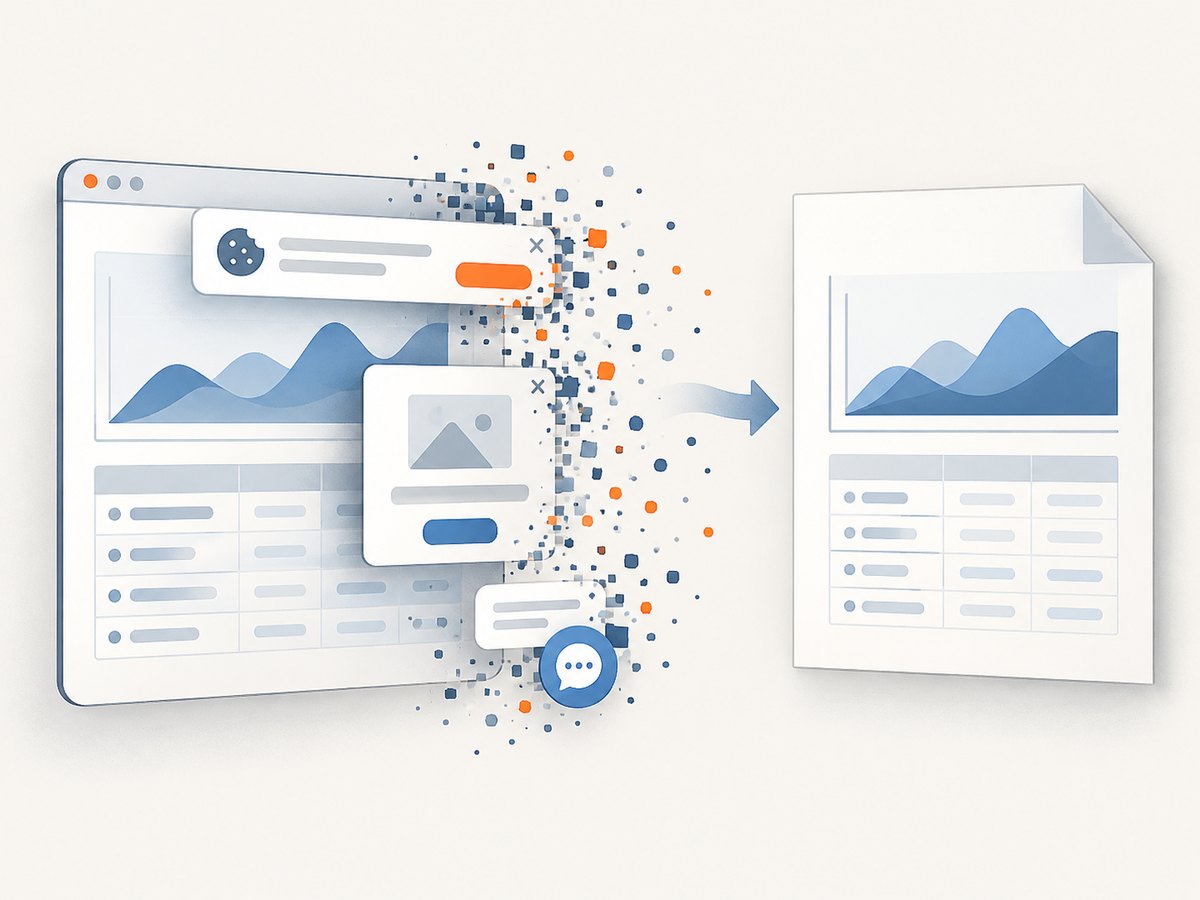
const res = await fetch(`https://api.screenshotneo.com/v1/shot?${q}`);See the ScreenshotNeo documentation for the full option set. Cookie banners, newsletter popups, and chat widgets are removed before the shot. Bot checks, blank pages, timeouts, failed loads, and cache hits are not billed, and response headers identify the page verdict and billing result. Its MCP server gives Claude, Cursor, and other MCP clients tools named take_screenshot, get_page_info, and capture_pdf.
The Free plan includes 1,000 screenshots a month with no card. Paid plans start at $5 for 3,000 shots, and every feature is available on every plan. Create a free ScreenshotNeo account.
Performance, reliability, and cost notes
- Reduce export time by supplying only the fields needed in the table and avoiding unnecessarily large source images.
- For repeat captures, cache stable report pages at the application layer and invalidate them when the underlying data changes.
- Use landscape pages for wide datasets instead of shrinking text until it is unreadable.
- Handle export failures as a separate outcome from an empty dataset; log the chart version, data row count, URL, and browser error.
- ScreenshotNeo bills only clean shots. Failed loads, bot checks, blank pages, timeouts, and cache hits cost nothing, with
X-Page-VerdictandX-Billedheaders returned on each response.
FAQ
Can I export only the table?
Yes. In amCharts 5, configure the PDF export and omit the chart image through the document definition when you need a table-focused report. In amCharts 4, use the export options and adjust the generated document if your version exposes the corresponding customization hook.
Why is landscape usually better?
Tables with several numeric series exceed portrait width quickly. Landscape gives columns more horizontal space and reduces wrapping.
Do I need a server for amCharts export?
The export itself runs in the browser, but serving the page over HTTP(S) avoids local-file security problems. A server-side browser or ScreenshotNeo is useful when exports must run without a user’s browser.
Which option adds column headers in amCharts 4?
Set addColumnNames: true alongside addData: true.
Which amCharts 5 option enables the table?
Set pdfOptions.includeData: true and provide a populated dataSource.