How to Export All Angular Gridster2 Items to PDF
Export every rendered Angular Gridster2 widget to a PDF, handle tall dashboards, and choose between DOM capture and data-driven reports.
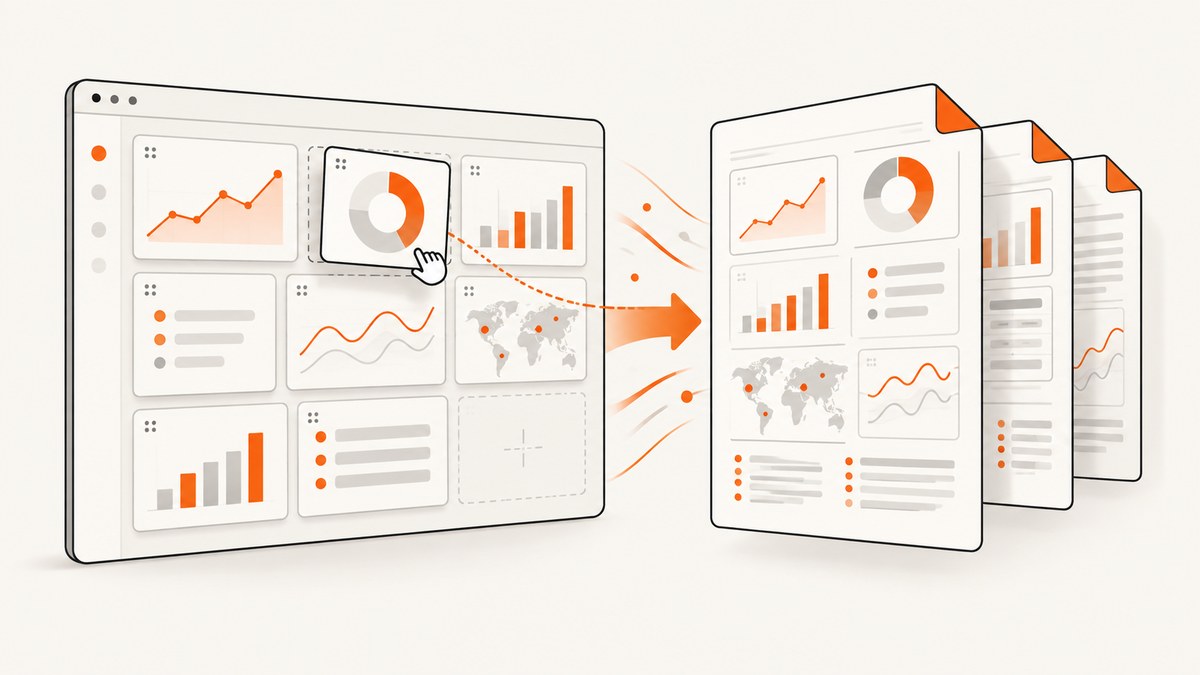
Angular Gridster2 does not provide a built-in PDF exporter. To export the complete dashboard, either capture the rendered Gridster2 container and place the image into a PDF, or build a report from your dashboard data. DOM capture preserves the visible arrangement fastest; data-driven generation gives selectable text and better control over pagination.
This guide shows a complete browser-side implementation, including tall dashboards, page slicing, fonts, charts, cross-origin images, version checks, troubleshooting, and a ScreenshotNeo alternative.
1. Choose the export strategy
| Requirement | Best approach |
|---|---|
| Keep the exact on-screen arrangement | Capture the rendered Gridster2 element |
| Selectable and searchable PDF text | Build the PDF from dashboard and widget data |
| Charts and arbitrary widget HTML | DOM capture, followed by page slicing or scaling |
| Predictable page breaks and headings | Data-driven report or a dedicated print layout |
| Export from a server or CI job | Browser automation or a screenshot/PDF API |
Gridster2 manages positions and dimensions such as x, y, cols, and rows; it is a layout library rather than a reporting engine. Check the README and declarations for the exact major version installed in your application before copying configuration. The repository release and npm package versions can differ from older examples, and Angular compatibility matters.
2. Install the capture and PDF libraries
npm install angular-gridster2 dom-to-image-more jspdf
Use a Gridster2 major version compatible with your Angular major version. The grid receives its available size from its parent, so the wrapper you capture must have a real width and height when the export starts.
3. Create a stable capture target
Give the complete dashboard a wrapper that is not clipped by a scrolling parent. If the visible dashboard is inside an element with overflow: auto, capture the inner content element instead of the viewport.
<button type="button" (click)="exportDashboard()" [disabled]="exporting">
  {{ exporting ? 'Preparing PDF…' : 'Export dashboard' }}
</button>

<div #dashboardCapture class="dashboard-capture">
  <gridster [options]="options">
    <gridster-item *ngFor="let item of dashboardItems" [item]="item">
      <app-widget [config]="item.widget"></app-widget>
    </gridster-item>
  </gridster>
</div>
.dashboard-capture {
  background: #fff;
  width: 100%;
  min-height: 640px;
}

/* Avoid a scrollbar becoming part of the captured image. */
.dashboard-capture gridster {
  overflow: visible;
}
4. Capture the whole dashboard and create a PDF
This component waits for the browser to finish layout and fonts, captures the full wrapper, and writes the image to an A4 PDF. It scales the complete dashboard to one page; the next section shows how to slice a tall dashboard across multiple pages.
import {
  AfterViewInit,
  Component,
  ElementRef,
  ViewChild
} from '@angular/core';
import domtoimage from 'dom-to-image-more';
import { jsPDF } from 'jspdf';

@Component({
  selector: 'app-dashboard',
  templateUrl: './dashboard.component.html'
})
export class DashboardComponent implements AfterViewInit {
  @ViewChild('dashboardCapture', { static: false })
  dashboardCapture!: ElementRef<HTMLElement>;

  exporting = false;
  dashboardItems = [
    { x: 0, y: 0, cols: 4, rows: 2, widget: { type: 'sales' } },
    { x: 4, y: 0, cols: 4, rows: 2, widget: { type: 'traffic' } }
  ];

  options = {
    draggable: { enabled: true },
    resizable: { enabled: true },
    minCols: 8,
    minRows: 4
  };

  async ngAfterViewInit(): Promise<void> {
    await document.fonts?.ready;
  }

  async exportDashboard(): Promise<void> {
    if (!this.dashboardCapture?.nativeElement) return;

    this.exporting = true;
    try {
      await this.waitForImages(this.dashboardCapture.nativeElement);
      await this.nextPaint();

      const node = this.dashboardCapture.nativeElement;
      const dataUrl = await domtoimage.toPng(node, {
        bgcolor: '#ffffff',
        cacheBust: true,
        pixelRatio: 2
      });

      const image = await this.loadImage(dataUrl);
      const pdf = new jsPDF({
        orientation: image.width > image.height ? 'landscape' : 'portrait',
        unit: 'pt',
        format: 'a4'
      });

      const pageWidth = pdf.internal.pageSize.getWidth();
      const pageHeight = pdf.internal.pageSize.getHeight();
      const scale = Math.min(pageWidth / image.width, pageHeight / image.height);
      const width = image.width * scale;
      const height = image.height * scale;
      const x = (pageWidth - width) / 2;
      const y = (pageHeight - height) / 2;

      pdf.addImage(dataUrl, 'PNG', x, y, width, height);
      pdf.save('gridster-dashboard.pdf');
    } finally {
      this.exporting = false;
    }
  }

  private async waitForImages(root: HTMLElement): Promise<void> {
    const images = Array.from(root.querySelectorAll('img'));
    await Promise.all(images.map(img => {
      if (img.complete) return Promise.resolve();
      return new Promise<void>(resolve => {
        img.addEventListener('load', () => resolve(), { once: true });
        img.addEventListener('error', () => resolve(), { once: true });
      });
    }));
  }

  private nextPaint(): Promise<void> {
    return new Promise(resolve =>
      requestAnimationFrame(() =>
        requestAnimationFrame(() => resolve())
      )
    );
  }

  private loadImage(src: string): Promise<HTMLImageElement> {
    return new Promise((resolve, reject) => {
      const image = new Image();
      image.onload = () => resolve(image);
      image.onerror = reject;
      image.src = src;
    });
  }
}
5. Put a tall dashboard on multiple A4 pages
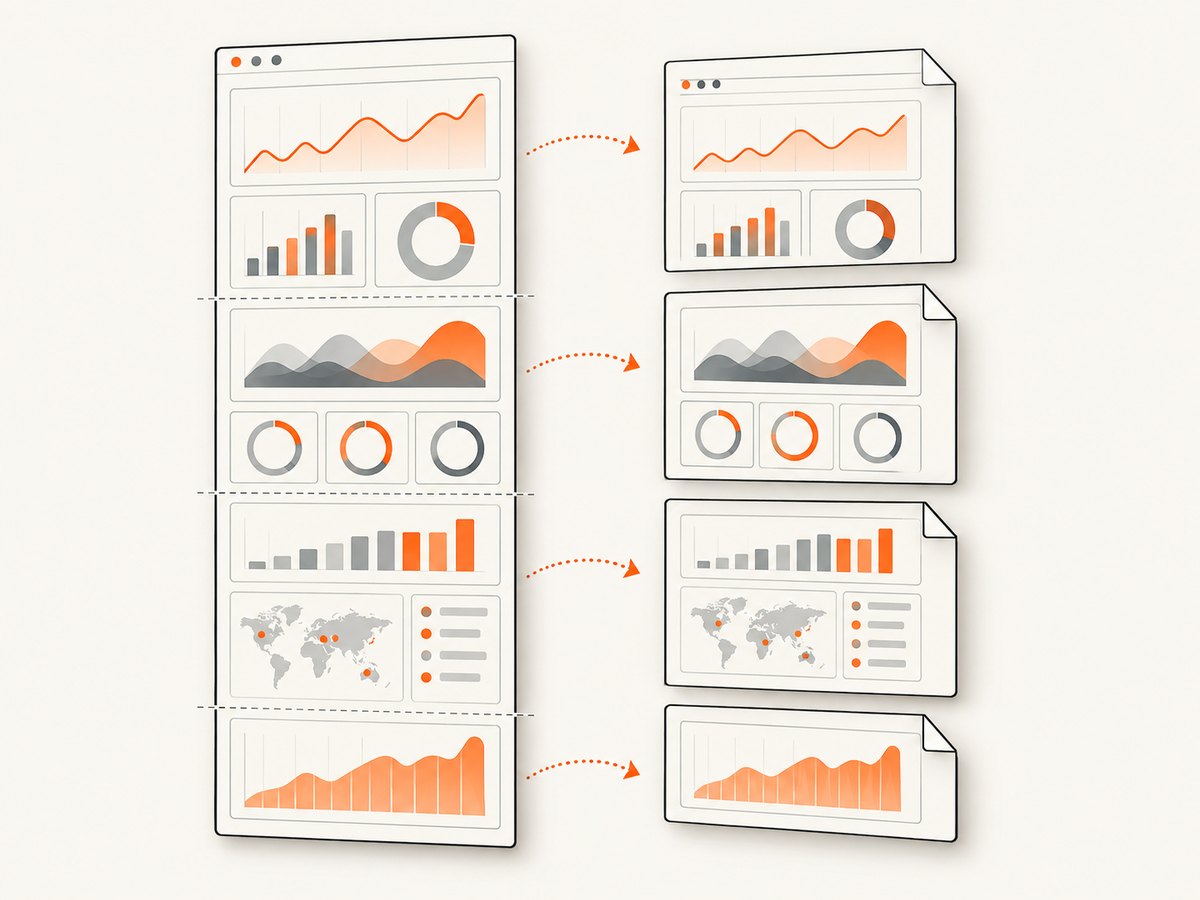
A single image does not create page breaks automatically. If the dashboard is taller than one page, slice the captured image into page-height sections. Each slice is added at the same width, so widgets remain in their original horizontal positions.
function addTallImageToA4(pdf: jsPDF, dataUrl: string, sourceWidth: number, sourceHeight: number): void {
  const pageWidth = pdf.internal.pageSize.getWidth();
  const pageHeight = pdf.internal.pageSize.getHeight();
  const scale = pageWidth / sourceWidth;
  const renderedHeight = sourceHeight * scale;
  const pixelsPerPage = pageHeight / scale;
  const source = new Image();

  source.onload = () => {
    const canvas = document.createElement('canvas');
    const context = canvas.getContext('2d');
    if (!context) throw new Error('Canvas is unavailable');

    let top = 0;
    let page = 0;
    while (top < sourceHeight) {
      const sliceHeight = Math.min(pixelsPerPage, sourceHeight - top);
      canvas.width = sourceWidth;
      canvas.height = sliceHeight;
      context.clearRect(0, 0, canvas.width, canvas.height);
      context.drawImage(
        source,
        0, top, sourceWidth, sliceHeight,
        0, 0, sourceWidth, sliceHeight
      );

      if (page > 0) pdf.addPage();
      pdf.addImage(canvas.toDataURL('image/png'), 'PNG', 0, 0,
        pageWidth, sliceHeight * scale);
      top += sliceHeight;
      page += 1;
    }
  };

  source.src = dataUrl;
}
In production, return a promise from this helper so the caller saves the PDF only after source.onload and all slices have been added. Also inspect page boundaries: a slice can cut through a card, chart, or table row. If that is unacceptable, create a print-specific layout with deliberate section breaks instead of slicing the interactive grid.
6. Preserve all widgets before capture
- Wait for asynchronous data. Do not export while widget requests are pending. Track loading state and disable the export button until every widget has either rendered or reached a deliberate empty/error state.
- Wait for charts. Canvas and SVG charts may render one or more frames after their data arrives. Use the chart library’s ready event where available, then wait for two animation frames.
- Load lazy content. A widget that renders only after scrolling may not exist in the capture. Render an export mode that mounts every widget, or trigger the required loading logic before capture.
- Use a white background. Transparent backgrounds can become black or unexpected colors in PDF viewers unless you set
bgcolorand widget backgrounds explicitly. - Freeze layout. Disable dragging, resizing, transitions, blinking cursors, and live counters while the export runs. A changing layout can produce a partially updated image.
7. Handle cross-origin images and browser limits
DOM-to-image serializes the DOM into a canvas. Images served without suitable cross-origin headers can be omitted or trigger a security error. Proxy remote assets through your origin, configure the asset server’s CORS policy, or replace them with same-origin data URLs for export. Test large dashboards in the browsers your users support: canvas dimensions and memory limits vary, and one very large PNG can exhaust the tab.
For a dashboard that exceeds practical canvas dimensions, capture sections separately (for example, groups of rows) and add each section to the PDF. This also gives you safer page boundaries and lower peak memory use.
8. Data-driven PDF generation
When text selection, accessibility, search, and predictable pagination matter more than pixel-perfect placement, generate the report from the same model that feeds Gridster2.
interface DashboardItem {
  x: number;
  y: number;
  cols: number;
  rows: number;
  title: string;
  value: string;
}

function buildReport(items: DashboardItem[]): jsPDF {
  const pdf = new jsPDF({ unit: 'pt', format: 'a4' });
  const margin = 42;
  const pageWidth = pdf.internal.pageSize.getWidth();
  const pageHeight = pdf.internal.pageSize.getHeight();
  let y = margin;

  pdf.setFontSize(18);
  pdf.text('Dashboard report', margin, y);
  y += 32;
  pdf.setFontSize(11);

  for (const item of [...items].sort((a, b) => a.y - b.y || a.x - b.x)) {
    if (y > pageHeight - 80) {
      pdf.addPage();
      y = margin;
    }
    pdf.setFont(undefined, 'bold');
    pdf.text(item.title, margin, y);
    pdf.setFont(undefined, 'normal');
    pdf.text(item.value, margin, y + 18);
    y += 48;
  }
  return pdf;
}
This approach requires a report representation for each widget, including chart images or tabular values. Use x, y, cols, and rows only when preserving dashboard placement is part of the report requirement.
9. PDF options worth exposing
| Option | Implementation choice |
|---|---|
| Paper size | A4, Letter, or a custom [width, height] format in jsPDF |
| Orientation | Portrait for reports; landscape for wide dashboards |
| Margins | Reserve points around the image or report content |
| Scale | Use a higher capture pixel ratio for detail, balanced against memory |
| Page ranges | For data-driven output, generate only selected sections; for images, slice selected ranges |
| Headers and footers | Add them as PDF text so they remain selectable |
| Filename | Include a dashboard name and date after sanitizing user input |
10. Troubleshooting
| Symptom | Cause | Fix |
|---|---|---|
| Only visible widgets are exported | The capture target is a scrolling viewport | Capture the full inner wrapper and remove clipping for export. |
| Blank or partial widgets | Data, fonts, charts, or images are still loading | Wait for application readiness, document.fonts.ready, images, and two animation frames. |
| Remote images disappear | Cross-origin restrictions | Use same-origin assets, CORS headers, or an image proxy. |
| Dashboard is tiny on A4 | The complete image is being fit to one page | Use multi-page slicing, landscape orientation, or a print layout. |
| Content is cut between pages | Image slicing has no semantic awareness | Group rows before capture or generate a data-driven report. |
| Export freezes the tab | Very large canvas or high pixel ratio | Capture row groups, lower pixelRatio, and release temporary canvases. |
| Styles differ from the dashboard | Computed styles, web fonts, or transitions were not available | Wait for fonts, inline critical styles for export, and disable transitions. |
| Gridster items move during capture | Drag/resize or responsive recalculation is active | Lock interaction and set a fixed export width. |
| API or method names from an example fail | Example targets a different Gridster2 major version | Read the installed package README and TypeScript declarations. |
11. Performance, reliability, and cost
- Performance: Capture at the lowest pixel ratio that keeps charts readable. A two-times image improves detail but increases memory and PDF size.
- Reliability: Make export idempotent and show progress for dashboards with many asynchronous widgets. Record which widgets were intentionally empty or failed.
- Repeatability: Freeze the viewport, timezone, locale, and data snapshot when users need identical exports.
- Security: Treat widget HTML, URLs, and filenames as untrusted input. Sanitize content before rendering and never expose secrets in captured DOM.
- Cost: Browser-side capture uses the user’s device. Server-side browser automation adds infrastructure and concurrency costs; a PDF API charges according to its plan and billing rules.
12. Or skip the browser setup
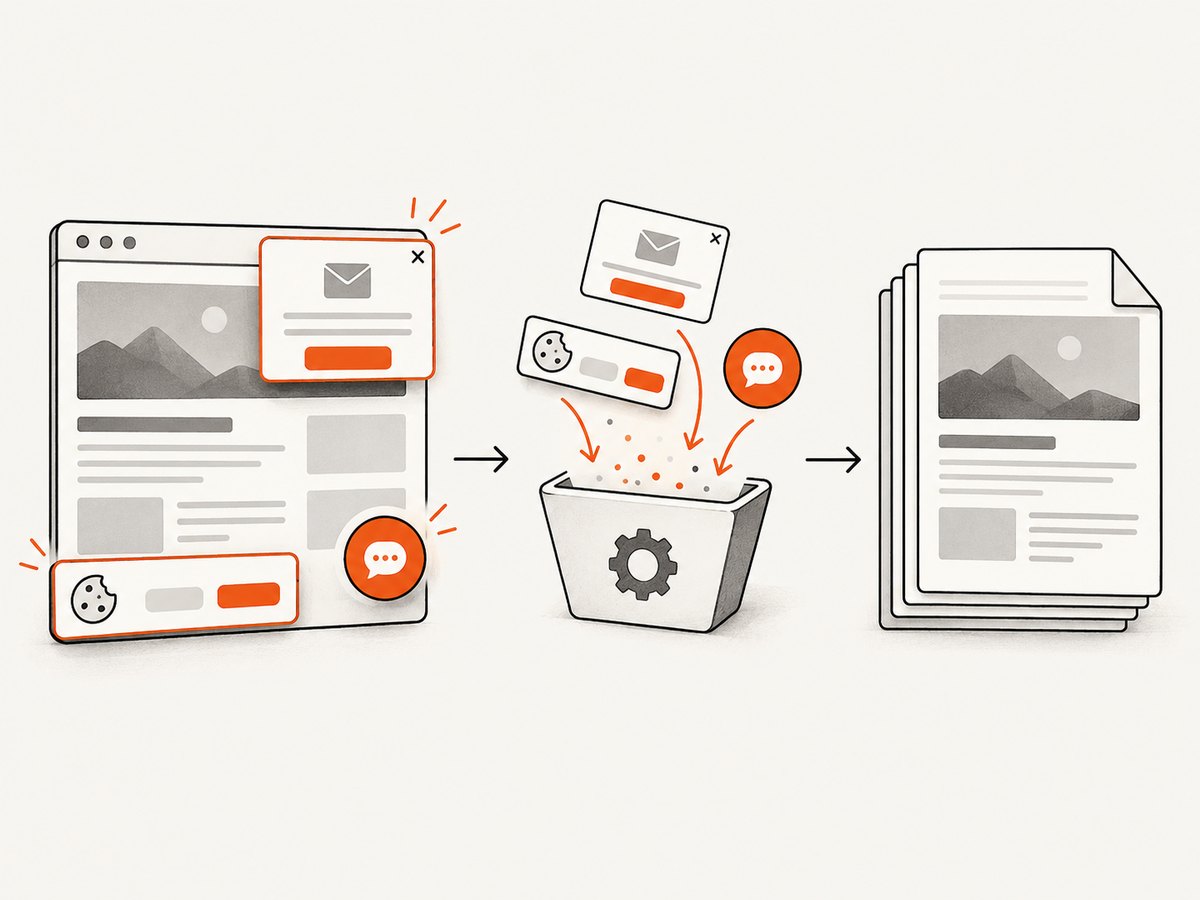
ScreenshotNeo can capture a rendered URL and return a PDF through one GET request. Its cleanup steps accept cookie or consent banners and remove more than 60 known consent platforms, newsletter popups, and chat widgets before capture; each step can be turned off. Bot checks, blank pages, timeouts, failed loads, and cache hits are not billed, and the response identifies the result with X-Page-Verdict and X-Billed headers. It also provides an MCP server for AI agents with take_screenshot, get_page_info, and capture_pdf.
See the ScreenshotNeo API documentation for the available PDF options, authentication, and asynchronous workflows.
curl -G "https://api.screenshotneo.com/v1/shot" \
  -d access_key=YOUR_API_KEY \
  --data-urlencode url=https://your-app.example.com/dashboard \
  -o dashboard.pdf
import requests

r = requests.get(
    "https://api.screenshotneo.com/v1/shot",
    params={
        "access_key": "YOUR_API_KEY",
        "url": "https://your-app.example.com/dashboard"
    },
    timeout=90
)
r.raise_for_status()
open("dashboard.pdf", "wb").write(r.content)
const q = new URLSearchParams({
  access_key: 'YOUR_API_KEY',
  url: 'https://your-app.example.com/dashboard'
});
const res = await fetch(`https://api.screenshotneo.com/v1/shot?${q}`);
if (!res.ok) throw new Error(`ScreenshotNeo request failed: ${res.status}`);
const pdf = Buffer.from(await res.arrayBuffer());
await import('node:fs/promises').then(fs => fs.writeFile('dashboard.pdf', pdf));
The Free plan includes 1,000 screenshots per month with no card. Paid plans start at $5 for 3,000 shots, and every feature is available on every plan. Create a free ScreenshotNeo account.
13. FAQ
Does Gridster2 export PDF by itself?
No. Treat PDF generation as an application feature and choose DOM capture or data-driven generation.
Can one PNG become a multi-page PDF automatically?
No. You must scale it to one page, slice it explicitly, or create a report layout with page breaks.
Will the PDF text be selectable?
Text inside a captured PNG is an image. Selectable text requires data-driven PDF generation or a separate text layer.
Should I use a vendor grid exporter?
A vendor-specific exporter, such as one documented for DevExpress, does not establish compatibility with Angular Gridster2. Verify the integration before adopting it.
How do I export a private dashboard with ScreenshotNeo?
Use the API’s supported custom headers, cookies, user agent, or Authorization options, and review the documentation for the exact parameter names and security model.