How to Export a C3.js Chart to PNG and PDF in the Browser
Convert a browser-rendered C3.js SVG chart into a reliable PNG or PDF, with complete code, troubleshooting, and a hosted ScreenshotNeo option.
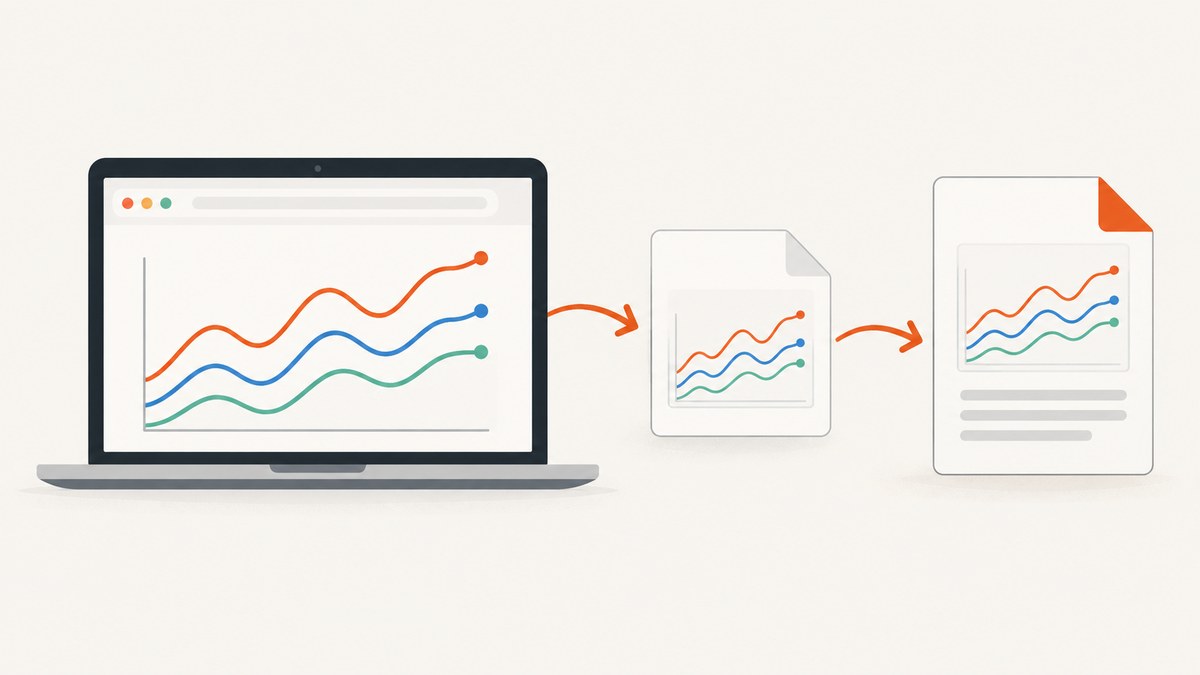
Direct answer: C3.js does not document a built-in PNG or PDF export API. C3 renders an interactive SVG chart in the browser, so export is a conversion pipeline: wait for the SVG to finish rendering, serialize it with its styles, draw it onto a Canvas for PNG output, and place that PNG into a PDF document when PDF output is needed. The official C3 setup uses D3, C3, a bound element, and c3.generate().C3 getting started guide
This guide gives a complete browser implementation, explains sizing, fonts, external assets, high-resolution output, PDF layout, common failures, and an API alternative when you do not want to maintain browser capture code.
1. Create a C3 chart that can be exported
Give the chart container an explicit size before generating the chart. A zero-width or zero-height SVG cannot be rasterized correctly.
<!doctype html>
<html lang="en">
<head>
  <meta charset="utf-8">
  <meta name="viewport" content="width=device-width, initial-scale=1">
  <title>C3 export</title>
  <link rel="stylesheet" href="https://cdn.jsdelivr.net/npm/c3@0.7.20/c3.min.css">
  <style>
    #chart { width: 900px; height: 500px; background: #fff; }
  </style>
</head>
<body>
  <div id="chart"></div>
  <button id="png">Download PNG</button>
  <button id="pdf">Download PDF</button>

  <script src="https://cdn.jsdelivr.net/npm/d3@5/dist/d3.min.js"></script>
  <script src="https://cdn.jsdelivr.net/npm/c3@0.7.20/c3.min.js"></script>
  <script src="https://cdn.jsdelivr.net/npm/jspdf@2.5.1/dist/jspdf.umd.min.js"></script>
  <script>
    const chart = c3.generate({
      bindto: '#chart',
      size: { width: 900, height: 500 },
      data: {
        columns: [
          ['Sales', 30, 20, 50, 40, 60, 50],
          ['Returns', 8, 5, 12, 9, 11, 7]
        ],
        types: { Sales: 'line', Returns: 'bar' }
      },
      axis: {
        x: { type: 'category', categories: ['Jan', 'Feb', 'Mar', 'Apr', 'May', 'Jun'] }
      },
      legend: { show: true }
    });

    // Wait until layout and transitions have completed.
    setTimeout(() => {
      document.querySelector('#png').disabled = false;
      document.querySelector('#pdf').disabled = false;
    }, 300);
  </script>
</body>
</html>
Match the D3 version to the C3 release installed in your project. C3 documentation and repository metadata have referenced different D3 major versions, so use the dependency declaration for your actual release rather than copying a version blindly.C3 repository
2. Export the SVG to a PNG
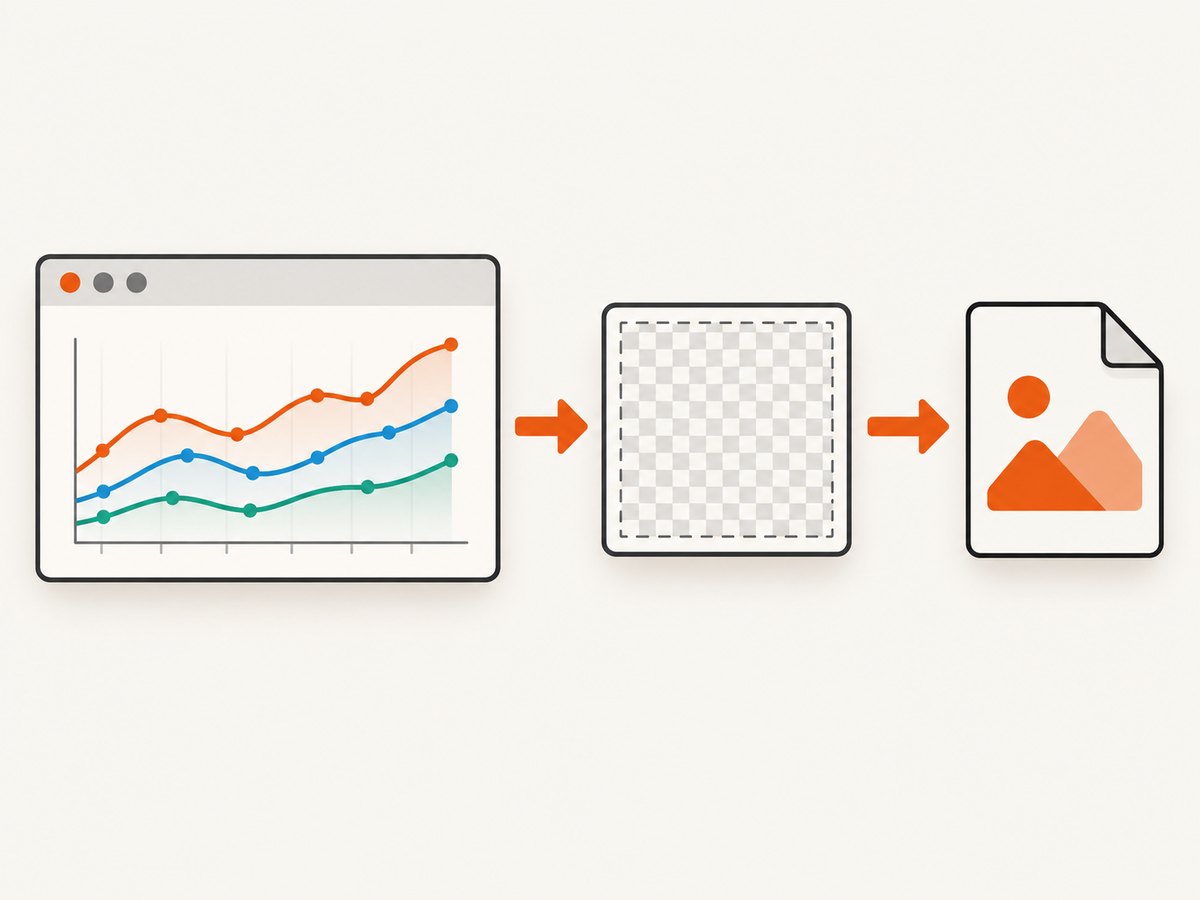
The function below copies computed SVG styles into the serialized markup, loads that markup into an image, paints it on a Canvas, and downloads a PNG. The scale argument creates a larger raster for reports or retina displays.
function svgToPng(svg, { scale = 2, background = '#ffffff', filename = 'chart.png' } = {}) {
  return new Promise((resolve, reject) => {
    const rect = svg.getBoundingClientRect();
    const width = Math.round(rect.width || svg.viewBox.baseVal.width || 900);
    const height = Math.round(rect.height || svg.viewBox.baseVal.height || 500);
    if (!width || !height) {
      reject(new Error('The chart SVG has no usable width or height.'));
      return;
    }

    const clone = svg.cloneNode(true);
    clone.setAttribute('width', width);
    clone.setAttribute('height', height);
    clone.setAttribute('xmlns', 'http://www.w3.org/2000/svg');

    // Preserve the visual result of external CSS rules used by C3.
    const sourceNodes = svg.querySelectorAll('*');
    const cloneNodes = clone.querySelectorAll('*');
    sourceNodes.forEach((source, i) => {
      const target = cloneNodes[i];
      if (!target) return;
      const computed = getComputedStyle(source);
      target.setAttribute('style', [
        `fill:${computed.fill}`,
        `fill-opacity:${computed.fillOpacity}`,
        `stroke:${computed.stroke}`,
        `stroke-width:${computed.strokeWidth}`,
        `stroke-opacity:${computed.strokeOpacity}`,
        `font-family:${computed.fontFamily}`,
        `font-size:${computed.fontSize}`,
        `font-weight:${computed.fontWeight}`,
        `text-anchor:${computed.textAnchor}`
      ].join(';'));
    });

    const xml = new XMLSerializer().serializeToString(clone);
    const blob = new Blob([xml], { type: 'image/svg+xml;charset=utf-8' });
    const url = URL.createObjectURL(blob);
    const image = new Image();
    image.onload = () => {
      const canvas = document.createElement('canvas');
      canvas.width = width * scale;
      canvas.height = height * scale;
      const context = canvas.getContext('2d');
      if (!context) {
        URL.revokeObjectURL(url);
        reject(new Error('Canvas 2D is unavailable in this browser.'));
        return;
      }
      context.fillStyle = background;
      context.fillRect(0, 0, canvas.width, canvas.height);
      context.drawImage(image, 0, 0, canvas.width, canvas.height);
      URL.revokeObjectURL(url);
      canvas.toBlob((png) => {
        if (!png) {
          reject(new Error('Canvas could not encode a PNG.'));
          return;
        }
        const downloadUrl = URL.createObjectURL(png);
        const link = document.createElement('a');
        link.href = downloadUrl;
        link.download = filename;
        link.click();
        setTimeout(() => URL.revokeObjectURL(downloadUrl), 1000);
        resolve(png);
      }, 'image/png');
    };
    image.onerror = () => {
      URL.revokeObjectURL(url);
      reject(new Error('The serialized SVG could not be decoded.'));
    };
    image.src = url;
  });
}

document.querySelector('#png').addEventListener('click', async () => {
  const svg = document.querySelector('#chart svg');
  if (!svg) throw new Error('C3 has not rendered an SVG yet.');
  await svgToPng(svg, { scale: 2, filename: 'sales-chart.png' });
});
Canvas export APIs require a nonzero canvas size and a successfully decoded source image. Keep the chart visible while exporting, and verify the downloaded file in the browsers you support.Canvas drawImage documentation
3. Put the PNG into a PDF
A simple, dependable PDF workflow is to generate the PNG first and add it to a PDF page. This is raster PDF output: enlarging the PDF beyond the chosen pixel dimensions can soften labels and thin lines.
async function exportPdf() {
  const svg = document.querySelector('#chart svg');
  if (!svg) throw new Error('C3 has not rendered an SVG yet.');

  // Create a PNG data URL without triggering a download.
  const pngBlob = await svgToPng(svg, { scale: 2, filename: 'temporary.png' });
  const pngDataUrl = await new Promise((resolve, reject) => {
    const reader = new FileReader();
    reader.onload = () => resolve(reader.result);
    reader.onerror = reject;
    reader.readAsDataURL(pngBlob);
  });

  const { jsPDF } = window.jspdf;
  const pdf = new jsPDF({ orientation: 'landscape', unit: 'pt', format: 'a4' });
  const pageWidth = pdf.internal.pageSize.getWidth();
  const pageHeight = pdf.internal.pageSize.getHeight();
  const margin = 36;
  const imageWidth = pageWidth - margin * 2;
  const imageHeight = imageWidth * 500 / 900;
  const y = Math.max(margin, (pageHeight - imageHeight) / 2);
  pdf.addImage(pngDataUrl, 'PNG', margin, y, imageWidth, imageHeight);
  pdf.save('sales-chart.pdf');
}

document.querySelector('#pdf').addEventListener('click', exportPdf);
For multi-page documents, calculate the available page rectangle after margins and add one image per page. A vector-preserving PDF requires an SVG-capable PDF path; the C3 documentation does not define one, so treat raster embedding as the portable baseline.jsPDF documentation
4. Export options that affect the result
| Option | What to do | Why it matters |
|---|---|---|
| Dimensions | Set C3 size.width/height and CSS dimensions before rendering. |
Controls labels, clipping, and output aspect ratio. |
| Resolution | Use Canvas scale: 2 or 3 for high-density output. |
More pixels improve text and line quality but increase memory and file size. |
| Background | Paint an explicit background before drawImage. |
Transparent SVG areas otherwise become transparent or viewer-dependent. |
| Fonts | Wait for document.fonts.ready before serializing. |
Prevents fallback fonts and changed label widths. |
| Transitions | Call export after C3 transitions finish, or use a short delay. | Capturing during animation produces incomplete paths or labels. |
| Responsive charts | Call chart.resize() and chart.flush() after changing the container. |
Ensures the SVG matches the intended export size. |
5. Edge cases and fidelity checks
- External images or CSS: cross-origin resources can prevent Canvas from being readable. Inline required styles and images, serve them with appropriate CORS headers, or remove them from the export.
- Clipped axes or legends: increase chart width, height, or margins before export. Inspect the rightmost labels and legend entries at the target size.
- Hidden containers: a chart inside
display:nonecommonly measures as zero. Render it in a visible off-screen container first. - Long labels: use a wider chart, rotate labels, or reduce font size. Do not rely on PDF viewers to repair clipping.
- Dark mode: serialize computed colors after applying the desired theme. Otherwise the export may capture the light theme or inherit a transparent background.
- Large datasets: high scale values and thousands of SVG nodes consume memory. Export at the smallest dimensions that meet your delivery requirement.
6. Troubleshooting
| Symptom | Likely cause | Fix |
|---|---|---|
| Blank PNG | Export ran before C3 rendered or SVG dimensions are zero. | Wait for rendering, check #chart svg, and set explicit dimensions. |
| “Tainted canvas” or security error | An image, font, or stylesheet came from another origin without CORS. | Inline the asset, enable CORS, or omit the cross-origin resource. |
| Missing colors or fonts | Styles live in external CSS and were not included in serialized SVG. | Copy computed styles as shown, and await document.fonts.ready. |
| Labels cut off | Chart or PDF image rectangle is too small. | Increase chart dimensions, adjust margins, or reduce label size. |
| PDF looks blurry | A low-resolution PNG was enlarged on the page. | Increase Canvas scale or use a vector-capable PDF workflow. |
| Animation captured halfway | Export started during a C3 transition. | Export after transitions, call chart.flush(), or delay briefly. |
| Download blocked | Browser restrictions or a missing user gesture. | Start export from a click handler and use an anchor with a download filename. |
7. Performance, reliability, and cost
PNG conversion is CPU and memory work in the browser. Rendering at three times the display size uses roughly nine times the pixel area of a one-times canvas, so choose the lowest scale that satisfies the consumer. Reuse one export function, revoke object URLs, and avoid exporting repeatedly during resize events.
For reliable automation, wait for the chart container, fonts, network-loaded data, and any application-specific rendering promises. Reopen generated PNG and PDF files in an automated check or a review step and inspect dimensions, labels, legend, background, and font rendering. Browser and library versions can change SVG serialization behavior, so pin dependencies and test your supported browsers.
The DIY approach has no API charge, but it does require browser code, dependency maintenance, a rendering environment for server jobs, and handling of cross-origin assets. If the chart is generated from a public URL, a hosted capture service can remove that browser setup.
Or skip the browser setup
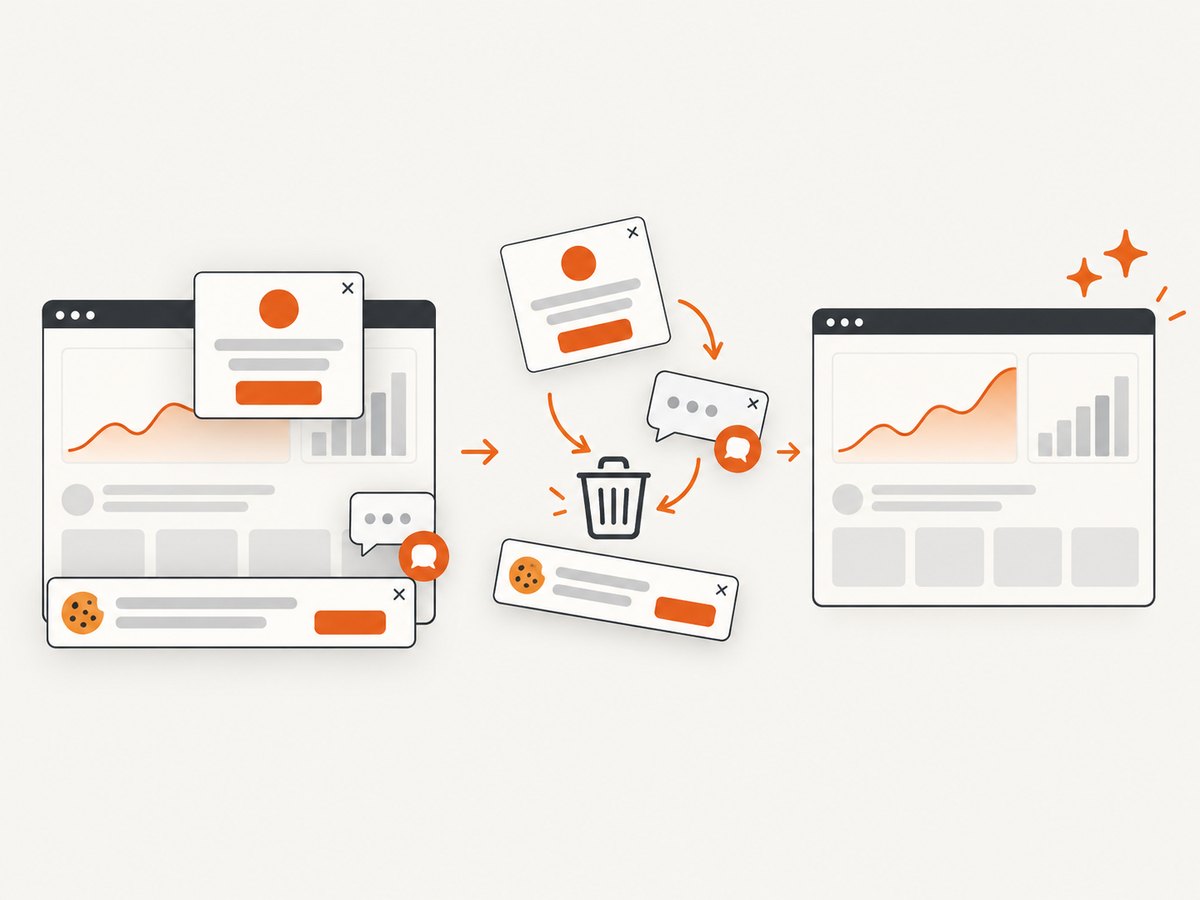
ScreenshotNeo captures a URL with one GET request and returns PNG, JPEG, WebP, or PDF. It can wait for a selector, delay, or network idle, run custom JavaScript, set a viewport or device preset, use retina scale, and capture a single element by CSS selector. Cookie banners, newsletter popups, and chat widgets are removed before the shot. Bot checks, blank pages, failed loads, timeouts, and cache hits are not billed, and the response identifies the result with X-Page-Verdict and X-Billed headers. Its MCP server lets Claude, Cursor, and other MCP clients call take_screenshot, get_page_info, and capture_pdf.
See the ScreenshotNeo API documentation for all options.
curl -G "https://api.screenshotneo.com/v1/shot" -d access_key=YOUR_API_KEY --data-urlencode url=https://example.com/chart -o chart.webpimport requests
r = requests.get("https://api.screenshotneo.com/v1/shot", params={"access_key": "YOUR_API_KEY", "url": "https://example.com/chart"}, timeout=90)
r.raise_for_status()
open("chart.webp", "wb").write(r.content)const q = new URLSearchParams({ access_key: 'YOUR_API_KEY', url: 'https://example.com/chart' });
const res = await fetch(`https://api.screenshotneo.com/v1/shot?${q}`);
if (!res.ok) throw new Error(`Screenshot failed: ${res.status}`);
const fs = await import('node:fs/promises');
await fs.writeFile('chart.webp', Buffer.from(await res.arrayBuffer()));The free plan includes 1,000 screenshots a month with no card; paid plans start at $5 for 3,000. Create a free ScreenshotNeo account.
8. FAQ
Does C3 export PNG directly?
Its documented API generates and updates the chart; it does not document a built-in PNG download method. Serialize the SVG and rasterize it.
Can I export a true vector PDF?
Yes, with a PDF library or pipeline that preserves SVG paths, but that is separate from C3 and requires checking text, CSS, and browser compatibility. PNG-in-PDF is the simpler portable route.
Why does my export differ from the screen?
Usually because computed CSS, fonts, external resources, dimensions, or animation state were not available when the SVG was serialized.
Should I use PNG or PDF?
Use PNG for web sharing and image pipelines. Use PDF for document delivery and printing; choose a sufficiently large raster or a vector workflow when readers will zoom.


