How to Export Charts to PDF With jsPDF in Chart.js
Export a rendered Chart.js chart to a downloadable PDF with jsPDF, including sizing, formats, multipage layouts, troubleshooting, and automation options.

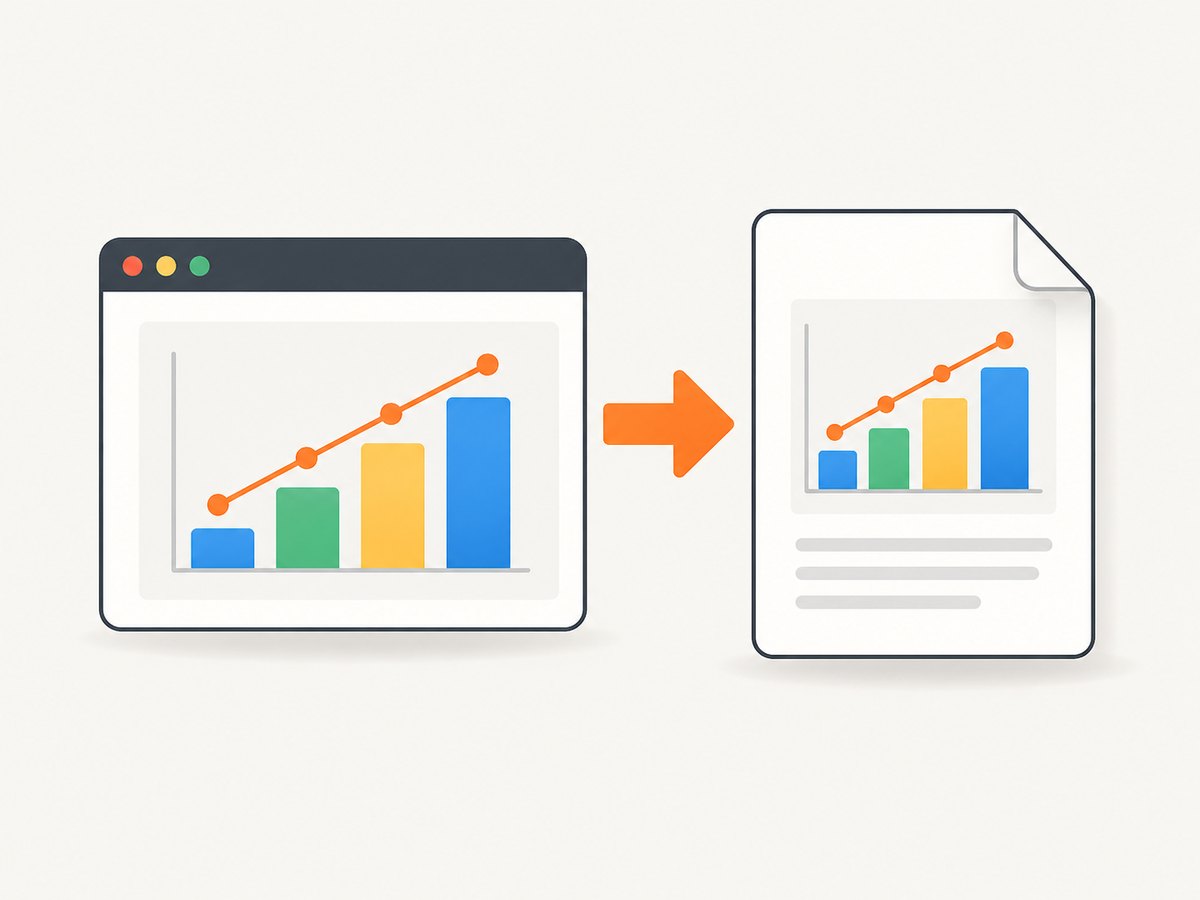
Use Chart.js’s toBase64Image() method, pass the returned data URL to jsPDF’s addImage(), then save the document. The result is an image of the chart embedded in a PDF. It is not established by the documented APIs as editable vector chart output.
const imageData = chart.toBase64Image();
const pdf = new jsPDF();
pdf.addImage(imageData, 'PNG', 20, 20, 170, 95);
pdf.save('chart.pdf');
Chart.js documents chart.toBase64Image(type?, quality?) for exporting the chart’s current rendered state. jsPDF documents addImage(imageData, format, x, y, width, height, ...) for placing a data URL, image, canvas, or byte array in a PDF.
Complete browser example
Save this as chart-pdf.html and open it in a browser. It loads Chart.js and jsPDF from their browser distributions, renders a chart, and adds a button that downloads a PDF.
<!doctype html>
<html lang="en">
<head>
  <meta charset="utf-8">
  <meta name="viewport" content="width=device-width, initial-scale=1">
  <title>Chart.js to PDF</title>
  <script src="https://cdn.jsdelivr.net/npm/chart.js"></script>
  <script src="https://cdn.jsdelivr.net/npm/jspdf@latest/dist/jspdf.umd.min.js"></script>
  <style>
    #chart-wrap { width: 800px; max-width: 100%; }
    canvas { display: block; }
  </style>
</head>
<body>
  <div id="chart-wrap">
    <canvas id="sales-chart" aria-label="Monthly sales"></canvas>
  </div>
  <button id="export-pdf" type="button">Download PDF</button>

  <script>
    const canvas = document.getElementById('sales-chart');
    const chart = new Chart(canvas, {
      type: 'bar',
      data: {
        labels: ['Jan', 'Feb', 'Mar', 'Apr', 'May', 'Jun'],
        datasets: [{
          label: 'Sales',
          data: [12, 19, 14, 23, 27, 31],
          backgroundColor: '#2563eb'
        }]
      },
      options: {
        responsive: true,
        animation: false,
        plugins: {
          title: { display: true, text: 'Monthly sales' }
        }
      }
    });

    document.getElementById('export-pdf').addEventListener('click', () => {
      // Capture after the chart has rendered in its desired state.
      const imageData = chart.toBase64Image('image/png');
      const { jsPDF } = window.jspdf;
      const pdf = new jsPDF({
        orientation: 'landscape',
        unit: 'mm',
        format: 'a4'
      });

      const margin = 15;
      const pageWidth = pdf.internal.pageSize.getWidth();
      const pageHeight = pdf.internal.pageSize.getHeight();
      const imageWidth = pageWidth - margin * 2;
      const imageHeight = imageWidth * (canvas.height / canvas.width);
      const y = Math.max(margin, (pageHeight - imageHeight) / 2);

      pdf.addImage(imageData, 'PNG', margin, y, imageWidth, imageHeight);
      pdf.save('monthly-sales.pdf');
    });
  </script>
</body>
</html>
If your jsPDF setup uses ES modules instead of the browser global, import the package according to the version and bundler in your application. The documented method call remains the same:
import { jsPDF } from 'jspdf';

const imageData = chart.toBase64Image();
const pdf = new jsPDF();
pdf.addImage(imageData, 'PNG', 20, 20, 170, 95);
pdf.save('chart.pdf');
How the export works
- Chart.js draws the current chart state onto a canvas.
toBase64Image()returns that state as a data URL. The default example is PNG; you can request another supported image type and quality.- jsPDF receives the data URL through
addImage(). - The
x,y,width, andheightvalues determine placement in the PDF’s configured units. save()starts the browser download.
Choose image format and quality
Keep the format argument aligned with the data you generated. For PNG:
const imageData = chart.toBase64Image('image/png');
pdf.addImage(imageData, 'PNG', 20, 20, 170, 95);
For a JPEG export, request JPEG data and declare JPEG in addImage():
const imageData = chart.toBase64Image('image/jpeg', 1);
pdf.addImage(imageData, 'JPEG', 20, 20, 170, 95);
PNG is usually the clearer choice for line art, labels, and transparent backgrounds. JPEG can reduce size for photographic or heavily shaded charts, but its compression can soften small text. jsPDF can recognize image types in supported cases, yet its format parameter is the documented fallback when recognition fails.
Size the chart for a readable PDF
The PDF dimensions are independent of the on-screen CSS size. Set the chart’s canvas size before capture when you need predictable output. Chart.js documents chart.resize(width, height), including explicit sizing for print-oriented use.
chart.resize(1400, 800);
// If your application changes data or options, update first.
chart.update();
const imageData = chart.toBase64Image('image/png');
Use the canvas’s pixel ratio and aspect ratio when calculating PDF dimensions. A simple proportional calculation avoids stretching:
const imageWidth = 170;
const imageHeight = imageWidth * (canvas.height / canvas.width);
pdf.addImage(imageData, 'PNG', 20, 20, imageWidth, imageHeight);
Capture only after animations, data loading, fonts, and any asynchronous plugins have finished. Setting animation: false is useful when the export must be deterministic.
Page orientation, units, and margins
Configure the document before adding the image:
const pdf = new jsPDF({
  orientation: 'portrait', // or 'landscape'
  unit: 'mm',               // for example: 'mm', 'pt', or 'in'
  format: 'a4'              // or another supported page format
});
Coordinates and dimensions use the unit selected in the constructor. Read the page dimensions at runtime instead of hard-coding a page width:
const margin = 15;
const pageWidth = pdf.internal.pageSize.getWidth();
const pageHeight = pdf.internal.pageSize.getHeight();
const width = pageWidth - margin * 2;
const height = width * (canvas.height / canvas.width);
const y = margin;
pdf.addImage(imageData, 'PNG', margin, y, width, height);
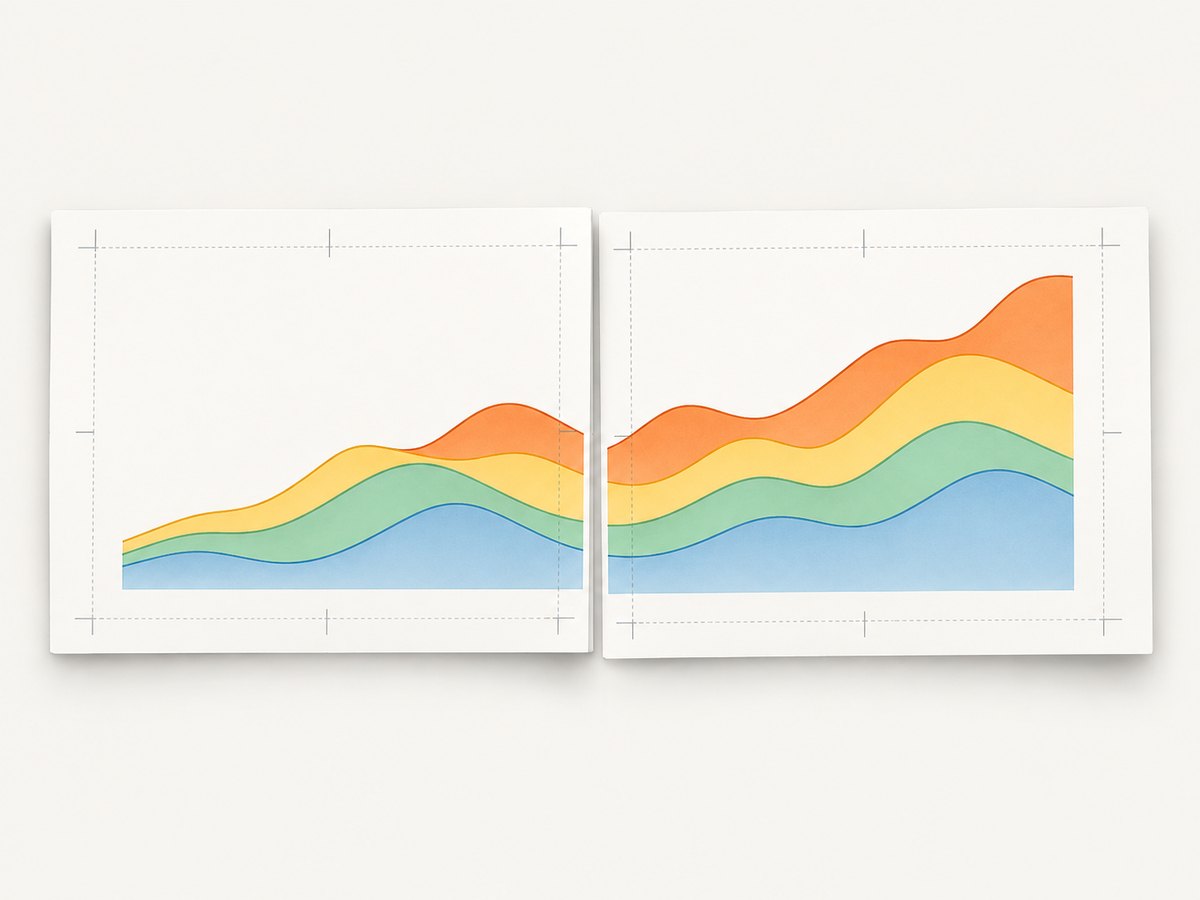
If the computed height exceeds the available page height, use landscape orientation, reduce the width, or split the chart across pages. Do not distort the chart merely to force it into a page.
Add titles, notes, and multiple charts
Text can be placed around the chart as normal PDF content:
const pdf = new jsPDF();
pdf.setFontSize(16);
pdf.text('Monthly sales', 20, 18);
pdf.setFontSize(10);
pdf.text('Report period: January–June', 20, 26);
pdf.addImage(chart.toBase64Image(), 'PNG', 20, 35, 170, 95);
pdf.save('sales-report.pdf');
For multiple charts, add a page when the next chart will not fit:
function addChartPage(pdf, chart, title) {
  const margin = 15;
  const pageWidth = pdf.internal.pageSize.getWidth();
  const width = pageWidth - margin * 2;
  const height = width * (chart.canvas.height / chart.canvas.width);
  pdf.setFontSize(15);
  pdf.text(title, margin, margin);
  pdf.addImage(chart.toBase64Image('image/png'), 'PNG', margin, margin + 8, width, height);
}

const pdf = new jsPDF({ orientation: 'landscape', unit: 'mm', format: 'a4' });
addChartPage(pdf, revenueChart, 'Revenue');
pdf.addPage();
addChartPage(pdf, conversionChart, 'Conversion rate');
pdf.save('dashboard.pdf');
Transparent backgrounds and chart state
The exported image reflects the chart’s current rendered state, including selected data, hidden datasets, zoom or filter state, legends, titles, and plugin output. Set the canvas or chart background intentionally if the PDF should not show transparency. A common approach is a background-color plugin or a surrounding element with a matching color; verify the resulting image in your target browser.
Common errors and fixes
| Symptom | Cause | Fix |
|---|---|---|
| Blank or partially drawn chart | Capture ran before data, fonts, images, or animation finished. | Wait for data and fonts, disable animation for export, call chart.update(), then capture. |
toBase64Image is not a function |
The variable is not a Chart.js chart instance, or code runs before construction. | Keep the value returned by new Chart(...) and call the method on that instance. |
jsPDF is undefined |
The browser bundle was not loaded or the global namespace differs. | Load jsPDF before your script and use window.jspdf.jsPDF for the UMD bundle, or use the package import for your bundler. |
| Image is stretched | Width and height do not preserve the canvas aspect ratio. | Calculate one dimension from canvas.width / canvas.height. |
| Chart is clipped | The image exceeds the page or margin box. | Use page dimensions, reduce the image width, change orientation, or add another page. |
| Unexpected image quality | The canvas is too small for the physical PDF size, or JPEG compression is visible. | Resize the chart to a larger pixel canvas before capture; use PNG for labels and fine lines. |
| Cross-origin drawing problem | External images or plugins may taint a canvas under browser security rules. | Serve assets with appropriate CORS headers, use same-origin assets, or remove the cross-origin content before export. |
| PDF opens but image is missing | Declared format does not match the data URL, or the data is empty. | Generate PNG and pass 'PNG', or generate JPEG and pass 'JPEG'; log and inspect the data URL prefix. |
Performance, reliability, and cost considerations
- Performance: Larger canvas dimensions improve print sharpness but increase memory use, base64 size, and PDF generation time. Export only when requested and release references to unused charts.
- Reliability: Treat export as a snapshot of one rendered state. Reproduce the same filters, dimensions, fonts, and plugin configuration before calling
toBase64Image(). - Accessibility: The embedded chart is an image. Keep the underlying data table or accessible HTML representation available when users need selectable or screen-reader-readable values.
- Output type: The documented workflow creates an image in a PDF. The cited API material does not guarantee editable or vector chart objects.
- Cost: Client-side Chart.js and jsPDF generation does not require a screenshot API request. Your costs are the browser and infrastructure costs of your own application.
Or skip the browser setup
If you need a PDF or screenshot of a whole rendered chart page, ScreenshotNeo provides a single GET request. Its capture options include full-page rendering, custom CSS and JavaScript, waiting for a selector, delay or network idle, device and viewport settings, and PDF paper size, margins, landscape mode, and page ranges. See the ScreenshotNeo API documentation for the current parameters.
curl -G "https://api.screenshotneo.com/v1/shot" -d access_key=YOUR_API_KEY --data-urlencode url=https://example.com/chart -o chart.pdfimport requests
r = requests.get("https://api.screenshotneo.com/v1/shot", params={"access_key": "YOUR_API_KEY", "url": "https://example.com/chart"}, timeout=90)
r.raise_for_status()
open("chart.pdf", "wb").write(r.content)const q = new URLSearchParams({ access_key: 'YOUR_API_KEY', url: 'https://example.com/chart' });
const res = await fetch(`https://api.screenshotneo.com/v1/shot?${q}`);
if (!res.ok) throw new Error(`ScreenshotNeo request failed: ${res.status}`);
const pdf = Buffer.from(await res.arrayBuffer());
require('node:fs').writeFileSync('chart.pdf', pdf);Cookie banners, newsletter popups, and chat widgets are removed before the shot. Bot checks, blank pages, failed loads, timeouts, and cache hits are never billed, and the response identifies the page verdict and billing status. An MCP server lets AI agents use take_screenshot, get_page_info, and capture_pdf. The free plan includes 1,000 screenshots a month with no card; paid plans start at $5 for 3,000.
Create a free ScreenshotNeo account and start with 1,000 screenshots per month at no charge.
FAQ
Does this produce a vector PDF?
The documented Chart.js and jsPDF workflow embeds a raster image. The cited APIs do not establish editable or vector chart output.
Can I export the chart as JPEG?
Yes. Request JPEG data with chart.toBase64Image('image/jpeg', quality) and pass 'JPEG' to addImage().
Why does my PDF show an old chart state?
Capture the chart after the intended data, filters, dimensions, fonts, and plugins have rendered. Call chart.update() before capture when you change configuration.
Can I export more than one chart?
Yes. Add each image to its own coordinates or create additional pages with pdf.addPage().
Where are PDF units configured?
Set unit in the jsPDF constructor. The coordinates and dimensions passed to addImage() use that unit.
References: Chart.js API documentation; jsPDF addImage API; jsPDF project repository.